Races in Bridgton, Maine (ME) Detailed Stats
Data:
Races - White alone (%)
Races - White alone (% change since 2000)
Races - Black alone (%)
Races - Black alone (% change since 2000)
Races - American Indian alone (%)
Races - American Indian alone (% change since 2000)
Races - Asian alone (%)
Races - Asian alone (% change since 2000)
Races - Hispanic (%)
Races - Hispanic (% change since 2000)
Races - Native Hawaiian and Other Pacific Islander alone (%)
Races - Native Hawaiian and Other Pacific Islander alone (% change since 2000)
Races - Two or more races(%)
Races - Two or more races(% change since 2000)
Races - Other race alone (%)
Races - Other race alone (% change since 2000)
Racial diversity
Place of birth - Born in state of residence (%)
Place of birth - Born in state of residence (%) - White
Place of birth - Born in state of residence (%) - Black or African American
Place of birth - Born in state of residence (%) - Asian
Place of birth - Born in state of residence (%) - Hispanic or Latino
Place of birth - Born in state of residence (%) - American Indian and Alaska Native
Place of birth - Born in state of residence (%) - Multirace
Place of birth - Born in state of residence (%) - Other Race
Place of birth - Born in other state (%)
Place of birth - Born in other state (%) - White
Place of birth - Born in other state (%) - Black or African American
Place of birth - Born in other state (%) - Asian
Place of birth - Born in other state (%) - Hispanic or Latino
Place of birth - Born in other state (%) - American Indian and Alaska Native
Place of birth - Born in other state (%) - Multirace
Place of birth - Born in other state (%) - Other Race
Place of birth - Native, outside of US (%)
Place of birth - Native, outside of US (%) - White
Place of birth - Native, outside of US (%) - Black or African American
Place of birth - Native, outside of US (%) - Asian
Place of birth - Native, outside of US (%) - Hispanic or Latino
Place of birth - Native, outside of US (%) - American Indian and Alaska Native
Place of birth - Native, outside of US (%) - Multirace
Place of birth - Native, outside of US (%) - Other Race
Place of birth - Foreign born (%)
Place of birth - Foreign born (%) - White
Place of birth - Foreign born (%) - Black or African American
Place of birth - Foreign born (%) - Asian
Place of birth - Foreign born (%) - Hispanic or Latino
Place of birth - Foreign born (%) - American Indian and Alaska Native
Place of birth - Foreign born (%) - Multirace
Place of birth - Foreign born (%) - Other Race
Residents speaking English at home (%)
Residents speaking English at home - Born in the United States (%)
Residents speaking English at home - Native, born elsewhere (%)
Residents speaking English at home - Foreign born (%)
Residents speaking Spanish at home (%)
Residents speaking Spanish at home - Born in the United States (%)
Residents speaking Spanish at home - Native, born elsewhere (%)
Residents speaking Spanish at home - Foreign born (%)
Residents speaking other language at home (%)
Residents speaking other language at home - Born in the United States (%)
Residents speaking other language at home - Native, born elsewhere (%)
Residents speaking other language at home - Foreign born (%)
Marital status - Never married (%)
Marital status - Now married (%)
Marital status - Separated (%)
Marital status - Widowed (%)
Marital status - Divorced (%)
Ancestries Reported - Arab (%)
Ancestries Reported - Czech (%)
Ancestries Reported - Danish (%)
Ancestries Reported - Dutch (%)
Ancestries Reported - English (%)
Ancestries Reported - French (%)
Ancestries Reported - French Canadian (%)
Ancestries Reported - German (%)
Ancestries Reported - Greek (%)
Ancestries Reported - Hungarian (%)
Ancestries Reported - Irish (%)
Ancestries Reported - Italian (%)
Ancestries Reported - Lithuanian (%)
Ancestries Reported - Norwegian (%)
Ancestries Reported - Polish (%)
Ancestries Reported - Portuguese (%)
Ancestries Reported - Russian (%)
Ancestries Reported - Scotch-Irish (%)
Ancestries Reported - Scottish (%)
Ancestries Reported - Slovak (%)
Ancestries Reported - Subsaharan African (%)
Ancestries Reported - Swedish (%)
Ancestries Reported - Swiss (%)
Ancestries Reported - Ukrainian (%)
Ancestries Reported - United States (%)
Ancestries Reported - Welsh (%)
Ancestries Reported - West Indian (%)
Ancestries Reported - Other (%)
Geographical mobility - Same house 1 year ago (%)
Geographical mobility - Same house 1 year ago (%) - White
Geographical mobility - Same house 1 year ago (%) - Black or African American
Geographical mobility - Same house 1 year ago (%) - Asian
Geographical mobility - Same house 1 year ago (%) - Hispanic or Latino
Geographical mobility - Same house 1 year ago (%) - American Indian and Alaska Native
Geographical mobility - Same house 1 year ago (%) - Multirace
Geographical mobility - Same house 1 year ago (%) - Other Race
Geographical mobility - Moved within same county (%)
Geographical mobility - Moved within same county (%) - White
Geographical mobility - Moved within same county (%) - Black or African American
Geographical mobility - Moved within same county (%) - Asian
Geographical mobility - Moved within same county (%) - Hispanic or Latino
Geographical mobility - Moved within same county (%) - American Indian and Alaska Native
Geographical mobility - Moved within same county (%) - Multirace
Geographical mobility - Moved within same county (%) - Other Race
Geographical mobility - Moved from different county within same state (%)
Geographical mobility - Moved from different county within same state (%) - White
Geographical mobility - Moved from different county within same state (%) - Black or African American
Geographical mobility - Moved from different county within same state (%) - Asian
Geographical mobility - Moved from different county within same state (%) - Hispanic or Latino
Geographical mobility - Moved from different county within same state (%) - American Indian and Alaska Native
Geographical mobility - Moved from different county within same state (%) - Multirace
Geographical mobility - Moved from different county within same state (%) - Other Race
Geographical mobility - Moved from different state (%)
Geographical mobility - Moved from different state (%) - White
Geographical mobility - Moved from different state (%) - Black or African American
Geographical mobility - Moved from different state (%) - Asian
Geographical mobility - Moved from different state (%) - Hispanic or Latino
Geographical mobility - Moved from different state (%) - American Indian and Alaska Native
Geographical mobility - Moved from different state (%) - Multirace
Geographical mobility - Moved from different state (%) - Other Race
Geographical mobility - Moved from abroad (%)
Geographical mobility - Moved from abroad (%) - White
Geographical mobility - Moved from abroad (%) - Black or African American
Geographical mobility - Moved from abroad (%) - Asian
Geographical mobility - Moved from abroad (%) - Hispanic or Latino
Geographical mobility - Moved from abroad (%) - American Indian and Alaska Native
Geographical mobility - Moved from abroad (%) - Multirace
Geographical mobility - Moved from abroad (%) - Other Race
Place of birth for the foreign-born population - Ireland (%)
Place of birth for the foreign-born population - Denmark (%)
Place of birth for the foreign-born population - Norway (%)
Place of birth for the foreign-born population - Sweden (%)
Place of birth for the foreign-born population - United Kingdom (%)
Place of birth for the foreign-born population - England (%)
Place of birth for the foreign-born population - Scotland (%)
Place of birth for the foreign-born population - Other Northern Europe (%)
Place of birth for the foreign-born population - Austria (%)
Place of birth for the foreign-born population - Belgium (%)
Place of birth for the foreign-born population - France (%)
Place of birth for the foreign-born population - Germany (%)
Place of birth for the foreign-born population - Netherlands (%)
Place of birth for the foreign-born population - Switzerland (%)
Place of birth for the foreign-born population - Other Western Europe (%)
Place of birth for the foreign-born population - Greece (%)
Place of birth for the foreign-born population - Italy (%)
Place of birth for the foreign-born population - Portugal (%)
Place of birth for the foreign-born population - Spain (%)
Place of birth for the foreign-born population - Other Southern Europe (%)
Place of birth for the foreign-born population - Albania (%)
Place of birth for the foreign-born population - Belarus (%)
Place of birth for the foreign-born population - Bosnia and Herzegovina (%)
Place of birth for the foreign-born population - Bulgaria (%)
Place of birth for the foreign-born population - Croatia (%)
Place of birth for the foreign-born population - Czechoslovakia (%)
Place of birth for the foreign-born population - Hungary (%)
Place of birth for the foreign-born population - Latvia (%)
Place of birth for the foreign-born population - Lithuania (%)
Place of birth for the foreign-born population - North Macedonia (Macedonia) (%)
Place of birth for the foreign-born population - Moldova (%)
Place of birth for the foreign-born population - Poland (%)
Place of birth for the foreign-born population - Romania (%)
Place of birth for the foreign-born population - Russia (%)
Place of birth for the foreign-born population - Serbia (%)
Place of birth for the foreign-born population - Ukraine (%)
Place of birth for the foreign-born population - Other Eastern Europe (%)
Place of birth for the foreign-born population - China (%)
Place of birth for the foreign-born population - Hong Kong (%)
Place of birth for the foreign-born population - Taiwan (%)
Place of birth for the foreign-born population - Japan (%)
Place of birth for the foreign-born population - Korea (%)
Place of birth for the foreign-born population - Other Eastern Asia (%)
Place of birth for the foreign-born population - Afghanistan (%)
Place of birth for the foreign-born population - Bangladesh (%)
Place of birth for the foreign-born population - India (%)
Place of birth for the foreign-born population - Iran (%)
Place of birth for the foreign-born population - Kazakhstan (%)
Place of birth for the foreign-born population - Nepal (%)
Place of birth for the foreign-born population - Pakistan (%)
Place of birth for the foreign-born population - Sri Lanka (%)
Place of birth for the foreign-born population - Uzbekistan (%)
Place of birth for the foreign-born population - Other South Central Asia (%)
Place of birth for the foreign-born population - Burma (%)
Place of birth for the foreign-born population - Cambodia (%)
Place of birth for the foreign-born population - Indonesia (%)
Place of birth for the foreign-born population - Laos (%)
Place of birth for the foreign-born population - Malaysia (%)
Place of birth for the foreign-born population - Philippines (%)
Place of birth for the foreign-born population - Singapore (%)
Place of birth for the foreign-born population - Thailand (%)
Place of birth for the foreign-born population - Vietnam (%)
Place of birth for the foreign-born population - Other South Eastern Asia (%)
Place of birth for the foreign-born population - Armenia (%)
Place of birth for the foreign-born population - Iraq (%)
Place of birth for the foreign-born population - Israel (%)
Place of birth for the foreign-born population - Jordan (%)
Place of birth for the foreign-born population - Kuwait (%)
Place of birth for the foreign-born population - Lebanon (%)
Place of birth for the foreign-born population - Saudi Arabia (%)
Place of birth for the foreign-born population - Syria (%)
Place of birth for the foreign-born population - Turkey (%)
Place of birth for the foreign-born population - Yemen (%)
Place of birth for the foreign-born population - Other Western Asia (%)
Place of birth for the foreign-born population - Eritrea (%)
Place of birth for the foreign-born population - Ethiopia (%)
Place of birth for the foreign-born population - Kenya (%)
Place of birth for the foreign-born population - Somalia (%)
Place of birth for the foreign-born population - Uganda (%)
Place of birth for the foreign-born population - Zimbabwe (%)
Place of birth for the foreign-born population - Other Eastern Africa (%)
Place of birth for the foreign-born population - Cameroon (%)
Place of birth for the foreign-born population - Congo (%)
Place of birth for the foreign-born population - Democratic Republic of Congo (Zaire) (%)
Place of birth for the foreign-born population - Other Middle Africa (%)
Place of birth for the foreign-born population - Egypt (%)
Place of birth for the foreign-born population - Morocco (%)
Place of birth for the foreign-born population - Sudan (%)
Place of birth for the foreign-born population - Other Northern Africa (%)
Place of birth for the foreign-born population - South Africa (%)
Place of birth for the foreign-born population - Other Southern Africa (%)
Place of birth for the foreign-born population - Cabo Verde (%)
Place of birth for the foreign-born population - Ghana (%)
Place of birth for the foreign-born population - Liberia (%)
Place of birth for the foreign-born population - Nigeria (%)
Place of birth for the foreign-born population - Senegal (%)
Place of birth for the foreign-born population - Sierra Leone (%)
Place of birth for the foreign-born population - Other Western Africa (%)
Place of birth for the foreign-born population - Australia (%)
Place of birth for the foreign-born population - New Zealand (%)
Place of birth for the foreign-born population - Fiji (%)
Place of birth for the foreign-born population - Micronesia (%)
Place of birth for the foreign-born population - Bahamas (%)
Place of birth for the foreign-born population - Barbados (%)
Place of birth for the foreign-born population - Cuba (%)
Place of birth for the foreign-born population - Dominica (%)
Place of birth for the foreign-born population - Dominican Republic (%)
Place of birth for the foreign-born population - Grenada (%)
Place of birth for the foreign-born population - Haiti (%)
Place of birth for the foreign-born population - Jamaica (%)
Place of birth for the foreign-born population - St. Vincent and the Grenadines (%)
Place of birth for the foreign-born population - Trinidad and Tobago (%)
Place of birth for the foreign-born population - West Indies (%)
Place of birth for the foreign-born population - Other Caribbean (%)
Place of birth for the foreign-born population - Belize (%)
Place of birth for the foreign-born population - Costa Rica (%)
Place of birth for the foreign-born population - El Salvador (%)
Place of birth for the foreign-born population - Guatemala (%)
Place of birth for the foreign-born population - Honduras (%)
Place of birth for the foreign-born population - Mexico (%)
Place of birth for the foreign-born population - Nicaragua (%)
Place of birth for the foreign-born population - Panama (%)
Place of birth for the foreign-born population - Other Central America (%)
Place of birth for the foreign-born population - Argentina (%)
Place of birth for the foreign-born population - Bolivia (%)
Place of birth for the foreign-born population - Brazil (%)
Place of birth for the foreign-born population - Chile (%)
Place of birth for the foreign-born population - Colombia (%)
Place of birth for the foreign-born population - Ecuador (%)
Place of birth for the foreign-born population - Guyana (%)
Place of birth for the foreign-born population - Peru (%)
Place of birth for the foreign-born population - Uruguay (%)
Place of birth for the foreign-born population - Venezuela (%)
Place of birth for the foreign-born population - Other South America (%)
Place of birth for the foreign-born population - Canada (%)
Place of birth for the foreign-born population - Other Northern America (%)
Place of birth for the foreign-born population - Other (%)
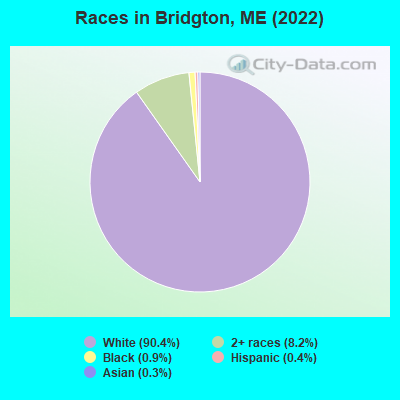
According to 2022 data, the most numerous races in Bridgton, ME are White alone (1,386 residents), Two or more races (126 residents), and Hispanic (6 residents). 96.8% of Bridgton residents speak English at home. 0.3% of Bridgton, ME residents are foreign-born , which is 820.4% less than the foreign-born rate of 3.0% across the entire state of Maine.
Race distribution in Bridgton
2000 2022
1,230,297 96.5% White alone 11,731 0.9% Two or more races 9,360 0.7% Hispanic 9,014 0.7% Asian alone 6,440 0.5% Black alone 6,911 0.5% American Indian alone 836 0.07% Other race alone 334 0.03% Native Hawaiian and Other
1,249,233 90.2% White alone 58,357 4.2% Two or more races 28,717 2.1% Hispanic 21,583 1.6% Black alone 16,151 1.2% Asian alone 5,873 0.4% Other race alone 5,205 0.4% American Indian alone 221 0.02% Native Hawaiian and Other
Income and house value in Bridgton Median household income in 2022 $58,335 White non-Hispanic householdersMedian 2022 house value $260,235 White Non-Hispanic householders$221,288 Black or African American householders
Household income for White non-Hispanic householders
Median age by race in Bridgton
47.3 Median age for White residents31.0 52.2 25.4 Median age for Black or African American residents26.0 -666,666,666.0 -639,386,188.6 Median age for American Indian / Alaska Native residents-664,907,651.1 -464,646,464.2 -768,270,944.0 Median age for Asian residents-730,245,230.9 -765,171,503.2 -442,352,940.7 Median age for Native Hawaiian / Pacific Islander residents-668,724,279.2 -453,900,708.8 -670,995,670.3 Median age for Other race residents-675,347,221.5 -591,283,862.8 82.8 Median age for Two or more races residents35.3 -746,331,236.2 47.4 Median age for White alone residents34.1 52.3 -642,140,467.6 Median age for Hispanic or Latino residents-564,784,052.6 -788,087,055.3
Owner/renter occupied households by race in Bridgton
House owners and renters - White residents 412 69.5% Owner occupied181 30.5% Renter occupiedHouse owners and renters - Two or more races residents 36 100.0% Owner occupiedHouse owners and renters - White alone residents 413 69.5% Owner occupied181 30.5% Renter occupied
Language usage in Bridgton
English speakers - Total 96.8% of residents of Bridgton speak English at home.
1.1% of residents speak Spanish at home 4 23.5% Speak English very well13 76.5% Speak English less than very well0.8% of residents speak other language at home 12 100.0% Speak English very well
English speakers - Born in the United States 95.0% of residents of Bridgton speak English at home.
3.3% of residents speak Spanish at home 4 21.1% Speak English very well15 78.9% Speak English less than very well
English speakers - Native, born elsewhere 0.0% of residents of Bridgton speak English at home.
216.7% of residents speak other language at home 13 100.0% Speak English very well
English speakers - Foreign-born 0.0% of residents of Bridgton speak English at home.
116.7% of residents speak other language at home 7 100.0% Speak English very well
Foreign-born residents in Bridgton 5 residents are foreign born
Marital status for residents in Bridgton Marital status - White (Caucasian) population 15 years and over
Males 59.1% Never married28.9% Now married0.0% Separated0.0% Widowed12.0% DivorcedFemales 31.2% Never married27.0% Now married0.0% Separated11.3% Widowed30.6% DivorcedWomen who gave birth in the past 12 months Now married:
100.0% (21)Unmarried:
0.0% (0)
Women who did not give birth in the past 12 months Now married:
8.6% (22)Unmarried:
91.4% (231)
Marital status - Two or more races population 15 years and over
Males 51.4% Never married48.6% Now married0.0% Separated0.0% Widowed0.0% DivorcedFemales 0.0% Never married100.0% Now married0.0% Separated0.0% Widowed0.0% DivorcedMarital status - White alone, not Hispanic / Latino population 15 years and over
Males 58.7% Never married29.2% Now married0.0% Separated0.0% Widowed12.1% DivorcedFemales 31.2% Never married27.0% Now married0.0% Separated11.3% Widowed30.6% DivorcedWomen who gave birth in the past 12 months Now married:
100.0% (21)Unmarried:
0.0% (0)
Women who did not give birth in the past 12 months Now married:
8.6% (22)Unmarried:
91.4% (232)
Ancestries in Bridgton
107 21.1% American106 20.9% Hungarian52 10.3% French41 8.1% Irish34 6.7% Italian33 6.5% German22 4.3% English22 4.3% African17 3.4% Scotch-Irish1 0.2% Lithuanian
Children Nativity (place of birth) in Bridgton
Children under 6 years - Living with two parents Both parents native 22 100.0% NativeChildren under 6 years - Living with one parent Native parent 33 100.0% Native
Children 6 to 17 years - Living with two parents Both parents native 47 100.0% NativeChildren 6 to 17 years - Living with one parent Native parent 154 100.0% Native
Place of birth for residents in Bridgton 5 Africa4 Middle Africa1 Eastern Africa
Grandparents responsible for own grandchildren in Bridgton
Grandparents (30 to 59 years) White / Caucasian 14 100.0% Not responsible for grandchildrenWhite alone, not Hispanic / Latino 14 100.0% Not responsible for grandchildren
Grandparents (60 years and over) White / Caucasian 33 100.0% Responsible for grandchildrenWhite alone, not Hispanic / Latino 33 100.0% Responsible for grandchildren