Races in Braselton, Georgia (GA) Detailed Stats
Data:
Races - White alone (%)
Races - White alone (% change since 2000)
Races - Black alone (%)
Races - Black alone (% change since 2000)
Races - American Indian alone (%)
Races - American Indian alone (% change since 2000)
Races - Asian alone (%)
Races - Asian alone (% change since 2000)
Races - Hispanic (%)
Races - Hispanic (% change since 2000)
Races - Native Hawaiian and Other Pacific Islander alone (%)
Races - Native Hawaiian and Other Pacific Islander alone (% change since 2000)
Races - Two or more races(%)
Races - Two or more races(% change since 2000)
Races - Other race alone (%)
Races - Other race alone (% change since 2000)
Racial diversity
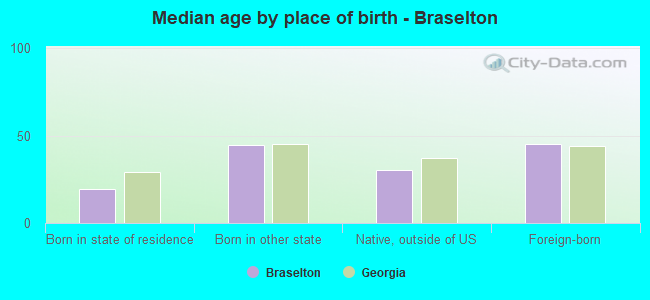
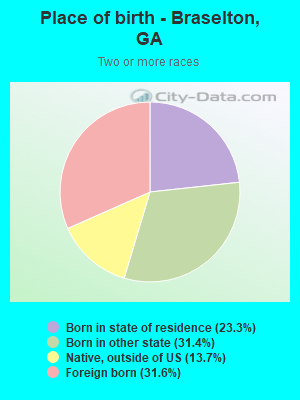
Place of birth - Born in state of residence (%)
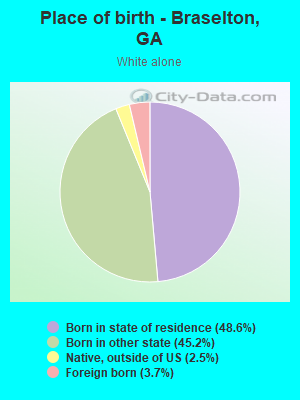
Place of birth - Born in state of residence (%) - White
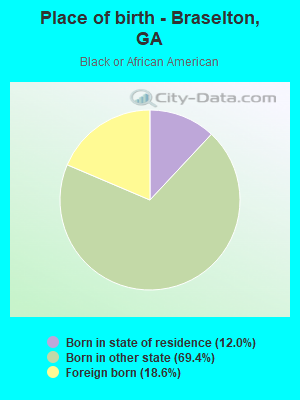
Place of birth - Born in state of residence (%) - Black or African American
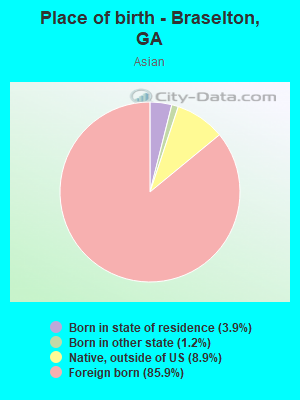
Place of birth - Born in state of residence (%) - Asian
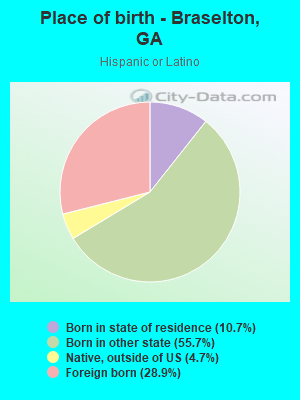
Place of birth - Born in state of residence (%) - Hispanic or Latino
Place of birth - Born in state of residence (%) - American Indian and Alaska Native
Place of birth - Born in state of residence (%) - Multirace
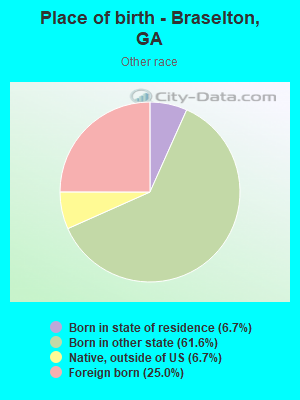
Place of birth - Born in state of residence (%) - Other Race
Place of birth - Born in other state (%)
Place of birth - Born in other state (%) - White
Place of birth - Born in other state (%) - Black or African American
Place of birth - Born in other state (%) - Asian
Place of birth - Born in other state (%) - Hispanic or Latino
Place of birth - Born in other state (%) - American Indian and Alaska Native
Place of birth - Born in other state (%) - Multirace
Place of birth - Born in other state (%) - Other Race
Place of birth - Native, outside of US (%)
Place of birth - Native, outside of US (%) - White
Place of birth - Native, outside of US (%) - Black or African American
Place of birth - Native, outside of US (%) - Asian
Place of birth - Native, outside of US (%) - Hispanic or Latino
Place of birth - Native, outside of US (%) - American Indian and Alaska Native
Place of birth - Native, outside of US (%) - Multirace
Place of birth - Native, outside of US (%) - Other Race
Place of birth - Foreign born (%)
Place of birth - Foreign born (%) - White
Place of birth - Foreign born (%) - Black or African American
Place of birth - Foreign born (%) - Asian
Place of birth - Foreign born (%) - Hispanic or Latino
Place of birth - Foreign born (%) - American Indian and Alaska Native
Place of birth - Foreign born (%) - Multirace
Place of birth - Foreign born (%) - Other Race
Residents speaking English at home (%)
Residents speaking English at home - Born in the United States (%)
Residents speaking English at home - Native, born elsewhere (%)
Residents speaking English at home - Foreign born (%)
Residents speaking Spanish at home (%)
Residents speaking Spanish at home - Born in the United States (%)
Residents speaking Spanish at home - Native, born elsewhere (%)
Residents speaking Spanish at home - Foreign born (%)
Residents speaking other language at home (%)
Residents speaking other language at home - Born in the United States (%)
Residents speaking other language at home - Native, born elsewhere (%)
Residents speaking other language at home - Foreign born (%)
Marital status - Never married (%)
Marital status - Now married (%)
Marital status - Separated (%)
Marital status - Widowed (%)
Marital status - Divorced (%)
Ancestries Reported - Arab (%)
Ancestries Reported - Czech (%)
Ancestries Reported - Danish (%)
Ancestries Reported - Dutch (%)
Ancestries Reported - English (%)
Ancestries Reported - French (%)
Ancestries Reported - French Canadian (%)
Ancestries Reported - German (%)
Ancestries Reported - Greek (%)
Ancestries Reported - Hungarian (%)
Ancestries Reported - Irish (%)
Ancestries Reported - Italian (%)
Ancestries Reported - Lithuanian (%)
Ancestries Reported - Norwegian (%)
Ancestries Reported - Polish (%)
Ancestries Reported - Portuguese (%)
Ancestries Reported - Russian (%)
Ancestries Reported - Scotch-Irish (%)
Ancestries Reported - Scottish (%)
Ancestries Reported - Slovak (%)
Ancestries Reported - Subsaharan African (%)
Ancestries Reported - Swedish (%)
Ancestries Reported - Swiss (%)
Ancestries Reported - Ukrainian (%)
Ancestries Reported - United States (%)
Ancestries Reported - Welsh (%)
Ancestries Reported - West Indian (%)
Ancestries Reported - Other (%)
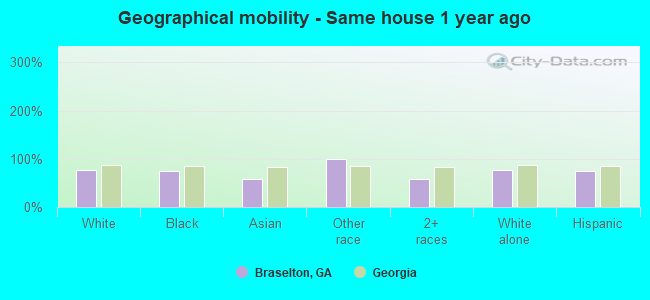
Geographical mobility - Same house 1 year ago (%)
Geographical mobility - Same house 1 year ago (%) - White
Geographical mobility - Same house 1 year ago (%) - Black or African American
Geographical mobility - Same house 1 year ago (%) - Asian
Geographical mobility - Same house 1 year ago (%) - Hispanic or Latino
Geographical mobility - Same house 1 year ago (%) - American Indian and Alaska Native
Geographical mobility - Same house 1 year ago (%) - Multirace
Geographical mobility - Same house 1 year ago (%) - Other Race
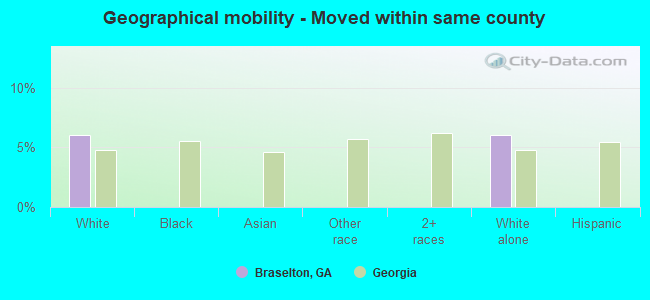
Geographical mobility - Moved within same county (%)
Geographical mobility - Moved within same county (%) - White
Geographical mobility - Moved within same county (%) - Black or African American
Geographical mobility - Moved within same county (%) - Asian
Geographical mobility - Moved within same county (%) - Hispanic or Latino
Geographical mobility - Moved within same county (%) - American Indian and Alaska Native
Geographical mobility - Moved within same county (%) - Multirace
Geographical mobility - Moved within same county (%) - Other Race
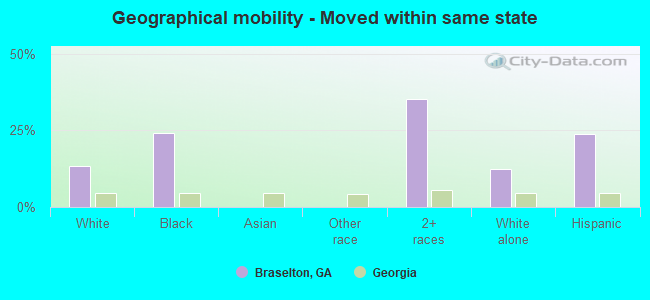
Geographical mobility - Moved from different county within same state (%)
Geographical mobility - Moved from different county within same state (%) - White
Geographical mobility - Moved from different county within same state (%) - Black or African American
Geographical mobility - Moved from different county within same state (%) - Asian
Geographical mobility - Moved from different county within same state (%) - Hispanic or Latino
Geographical mobility - Moved from different county within same state (%) - American Indian and Alaska Native
Geographical mobility - Moved from different county within same state (%) - Multirace
Geographical mobility - Moved from different county within same state (%) - Other Race
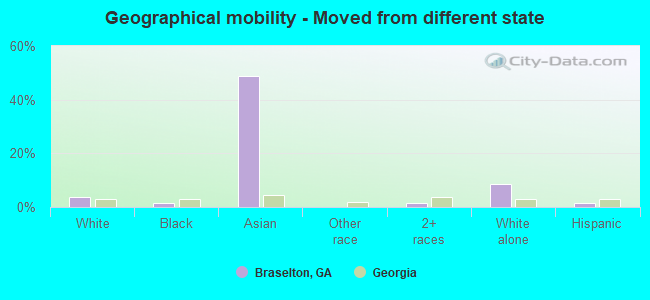
Geographical mobility - Moved from different state (%)
Geographical mobility - Moved from different state (%) - White
Geographical mobility - Moved from different state (%) - Black or African American
Geographical mobility - Moved from different state (%) - Asian
Geographical mobility - Moved from different state (%) - Hispanic or Latino
Geographical mobility - Moved from different state (%) - American Indian and Alaska Native
Geographical mobility - Moved from different state (%) - Multirace
Geographical mobility - Moved from different state (%) - Other Race
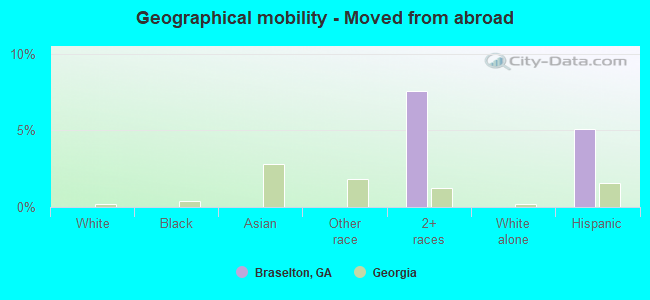
Geographical mobility - Moved from abroad (%)
Geographical mobility - Moved from abroad (%) - White
Geographical mobility - Moved from abroad (%) - Black or African American
Geographical mobility - Moved from abroad (%) - Asian
Geographical mobility - Moved from abroad (%) - Hispanic or Latino
Geographical mobility - Moved from abroad (%) - American Indian and Alaska Native
Geographical mobility - Moved from abroad (%) - Multirace
Geographical mobility - Moved from abroad (%) - Other Race
Place of birth for the foreign-born population - Ireland (%)
Place of birth for the foreign-born population - Denmark (%)
Place of birth for the foreign-born population - Norway (%)
Place of birth for the foreign-born population - Sweden (%)
Place of birth for the foreign-born population - United Kingdom (%)
Place of birth for the foreign-born population - England (%)
Place of birth for the foreign-born population - Scotland (%)
Place of birth for the foreign-born population - Other Northern Europe (%)
Place of birth for the foreign-born population - Austria (%)
Place of birth for the foreign-born population - Belgium (%)
Place of birth for the foreign-born population - France (%)
Place of birth for the foreign-born population - Germany (%)
Place of birth for the foreign-born population - Netherlands (%)
Place of birth for the foreign-born population - Switzerland (%)
Place of birth for the foreign-born population - Other Western Europe (%)
Place of birth for the foreign-born population - Greece (%)
Place of birth for the foreign-born population - Italy (%)
Place of birth for the foreign-born population - Portugal (%)
Place of birth for the foreign-born population - Spain (%)
Place of birth for the foreign-born population - Other Southern Europe (%)
Place of birth for the foreign-born population - Albania (%)
Place of birth for the foreign-born population - Belarus (%)
Place of birth for the foreign-born population - Bosnia and Herzegovina (%)
Place of birth for the foreign-born population - Bulgaria (%)
Place of birth for the foreign-born population - Croatia (%)
Place of birth for the foreign-born population - Czechoslovakia (%)
Place of birth for the foreign-born population - Hungary (%)
Place of birth for the foreign-born population - Latvia (%)
Place of birth for the foreign-born population - Lithuania (%)
Place of birth for the foreign-born population - North Macedonia (Macedonia) (%)
Place of birth for the foreign-born population - Moldova (%)
Place of birth for the foreign-born population - Poland (%)
Place of birth for the foreign-born population - Romania (%)
Place of birth for the foreign-born population - Russia (%)
Place of birth for the foreign-born population - Serbia (%)
Place of birth for the foreign-born population - Ukraine (%)
Place of birth for the foreign-born population - Other Eastern Europe (%)
Place of birth for the foreign-born population - China (%)
Place of birth for the foreign-born population - Hong Kong (%)
Place of birth for the foreign-born population - Taiwan (%)
Place of birth for the foreign-born population - Japan (%)
Place of birth for the foreign-born population - Korea (%)
Place of birth for the foreign-born population - Other Eastern Asia (%)
Place of birth for the foreign-born population - Afghanistan (%)
Place of birth for the foreign-born population - Bangladesh (%)
Place of birth for the foreign-born population - India (%)
Place of birth for the foreign-born population - Iran (%)
Place of birth for the foreign-born population - Kazakhstan (%)
Place of birth for the foreign-born population - Nepal (%)
Place of birth for the foreign-born population - Pakistan (%)
Place of birth for the foreign-born population - Sri Lanka (%)
Place of birth for the foreign-born population - Uzbekistan (%)
Place of birth for the foreign-born population - Other South Central Asia (%)
Place of birth for the foreign-born population - Burma (%)
Place of birth for the foreign-born population - Cambodia (%)
Place of birth for the foreign-born population - Indonesia (%)
Place of birth for the foreign-born population - Laos (%)
Place of birth for the foreign-born population - Malaysia (%)
Place of birth for the foreign-born population - Philippines (%)
Place of birth for the foreign-born population - Singapore (%)
Place of birth for the foreign-born population - Thailand (%)
Place of birth for the foreign-born population - Vietnam (%)
Place of birth for the foreign-born population - Other South Eastern Asia (%)
Place of birth for the foreign-born population - Armenia (%)
Place of birth for the foreign-born population - Iraq (%)
Place of birth for the foreign-born population - Israel (%)
Place of birth for the foreign-born population - Jordan (%)
Place of birth for the foreign-born population - Kuwait (%)
Place of birth for the foreign-born population - Lebanon (%)
Place of birth for the foreign-born population - Saudi Arabia (%)
Place of birth for the foreign-born population - Syria (%)
Place of birth for the foreign-born population - Turkey (%)
Place of birth for the foreign-born population - Yemen (%)
Place of birth for the foreign-born population - Other Western Asia (%)
Place of birth for the foreign-born population - Eritrea (%)
Place of birth for the foreign-born population - Ethiopia (%)
Place of birth for the foreign-born population - Kenya (%)
Place of birth for the foreign-born population - Somalia (%)
Place of birth for the foreign-born population - Uganda (%)
Place of birth for the foreign-born population - Zimbabwe (%)
Place of birth for the foreign-born population - Other Eastern Africa (%)
Place of birth for the foreign-born population - Cameroon (%)
Place of birth for the foreign-born population - Congo (%)
Place of birth for the foreign-born population - Democratic Republic of Congo (Zaire) (%)
Place of birth for the foreign-born population - Other Middle Africa (%)
Place of birth for the foreign-born population - Egypt (%)
Place of birth for the foreign-born population - Morocco (%)
Place of birth for the foreign-born population - Sudan (%)
Place of birth for the foreign-born population - Other Northern Africa (%)
Place of birth for the foreign-born population - South Africa (%)
Place of birth for the foreign-born population - Other Southern Africa (%)
Place of birth for the foreign-born population - Cabo Verde (%)
Place of birth for the foreign-born population - Ghana (%)
Place of birth for the foreign-born population - Liberia (%)
Place of birth for the foreign-born population - Nigeria (%)
Place of birth for the foreign-born population - Senegal (%)
Place of birth for the foreign-born population - Sierra Leone (%)
Place of birth for the foreign-born population - Other Western Africa (%)
Place of birth for the foreign-born population - Australia (%)
Place of birth for the foreign-born population - New Zealand (%)
Place of birth for the foreign-born population - Fiji (%)
Place of birth for the foreign-born population - Micronesia (%)
Place of birth for the foreign-born population - Bahamas (%)
Place of birth for the foreign-born population - Barbados (%)
Place of birth for the foreign-born population - Cuba (%)
Place of birth for the foreign-born population - Dominica (%)
Place of birth for the foreign-born population - Dominican Republic (%)
Place of birth for the foreign-born population - Grenada (%)
Place of birth for the foreign-born population - Haiti (%)
Place of birth for the foreign-born population - Jamaica (%)
Place of birth for the foreign-born population - St. Vincent and the Grenadines (%)
Place of birth for the foreign-born population - Trinidad and Tobago (%)
Place of birth for the foreign-born population - West Indies (%)
Place of birth for the foreign-born population - Other Caribbean (%)
Place of birth for the foreign-born population - Belize (%)
Place of birth for the foreign-born population - Costa Rica (%)
Place of birth for the foreign-born population - El Salvador (%)
Place of birth for the foreign-born population - Guatemala (%)
Place of birth for the foreign-born population - Honduras (%)
Place of birth for the foreign-born population - Mexico (%)
Place of birth for the foreign-born population - Nicaragua (%)
Place of birth for the foreign-born population - Panama (%)
Place of birth for the foreign-born population - Other Central America (%)
Place of birth for the foreign-born population - Argentina (%)
Place of birth for the foreign-born population - Bolivia (%)
Place of birth for the foreign-born population - Brazil (%)
Place of birth for the foreign-born population - Chile (%)
Place of birth for the foreign-born population - Colombia (%)
Place of birth for the foreign-born population - Ecuador (%)
Place of birth for the foreign-born population - Guyana (%)
Place of birth for the foreign-born population - Peru (%)
Place of birth for the foreign-born population - Uruguay (%)
Place of birth for the foreign-born population - Venezuela (%)
Place of birth for the foreign-born population - Other South America (%)
Place of birth for the foreign-born population - Canada (%)
Place of birth for the foreign-born population - Other Northern America (%)
Place of birth for the foreign-born population - Other (%)
Latest news about races in Braselton, GA collected exclusively by city-data.com from local newspapers, TV, and radio stations
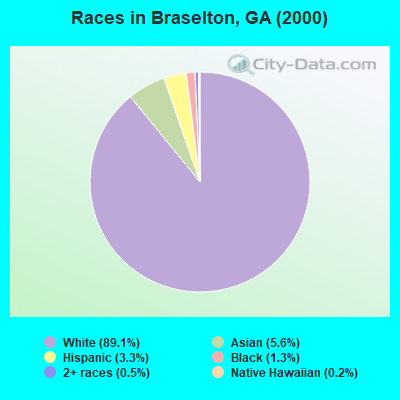
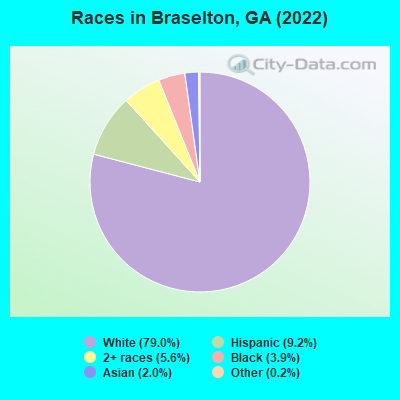
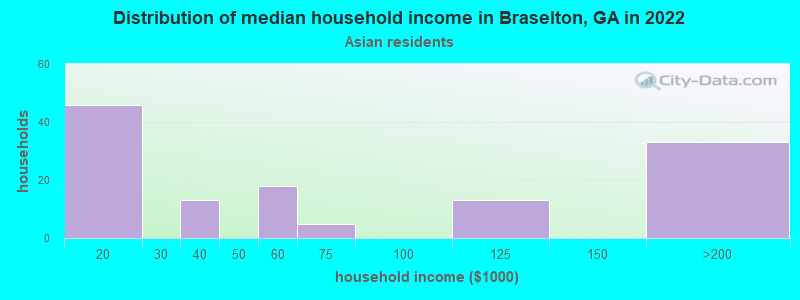
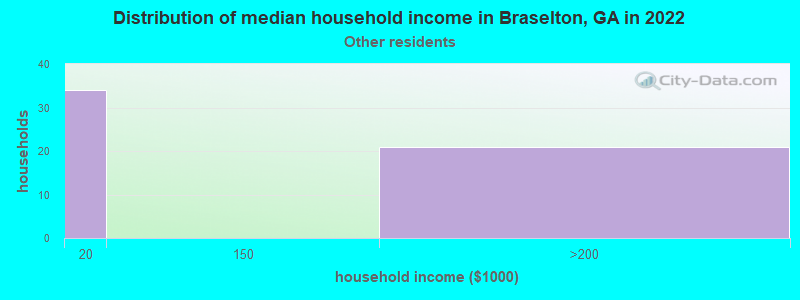
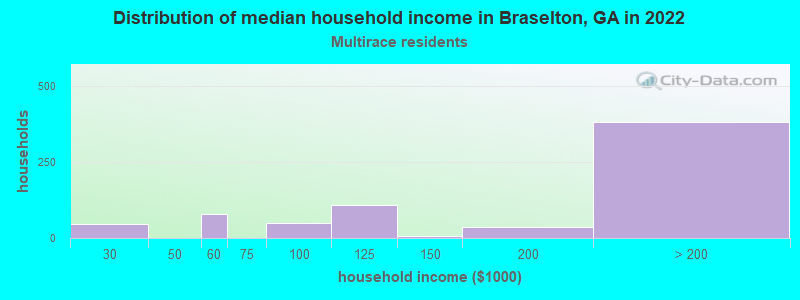
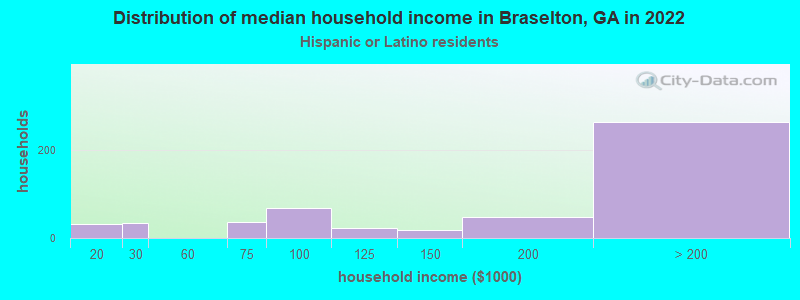
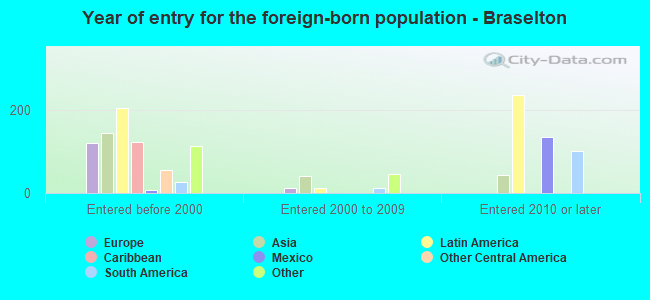
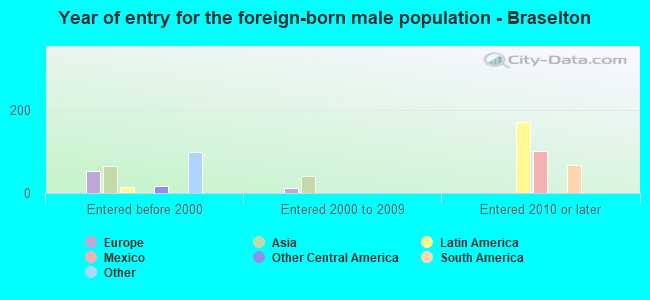
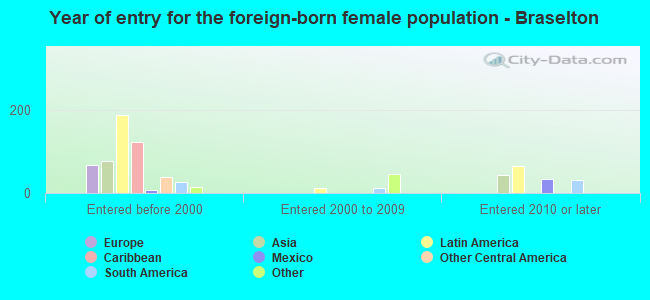
According to 2022 data, the most numerous races in Braselton, GA are White alone (11,875 residents), Black alone (589 residents), and Hispanic (1,386 residents). 89.1% of Braselton residents speak English at home. 6.5% of Braselton, GA residents are foreign-born (3.0% born in Latin America, 1.7% born in Asia, 1.0% born in Europe), which is 54.0% less than the foreign-born rate of 10.0% across the entire state of Georgia.
Race distribution in Braselton
2000 2022
5,128,661 62.6% White alone 2,331,465 28.5% Black alone 435,227 5.3% Hispanic 171,513 2.1% Asian alone 87,364 1.1% Two or more races 17,670 0.2% American Indian alone 11,275 0.1% Other race alone 3,278 0.04% Native Hawaiian and Other
5,415,657 49.6% White alone 3,349,240 30.7% Black alone 1,132,604 10.4% Hispanic 479,156 4.4% Asian alone 462,923 4.2% Two or more races 54,416 0.5% Other race alone 11,923 0.1% American Indian alone 6,957 0.06% Native Hawaiian and Other
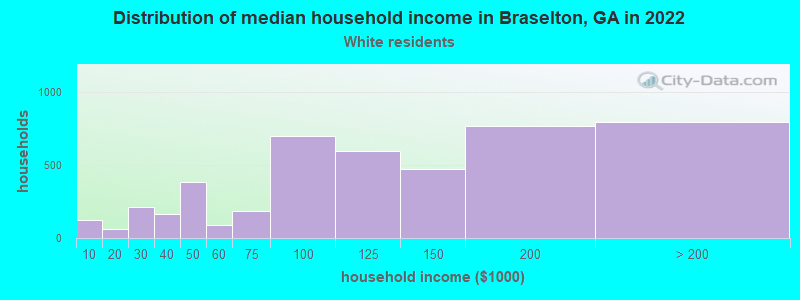
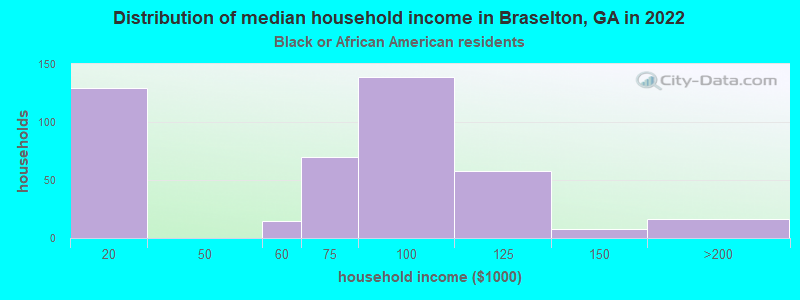
Income and house value in Braselton Median household income in 2022 $121,131 White non-Hispanic householders$59,591 Black householders$199,763 Two or more races householders$162,925 Hispanic or Latino race householdersMedian 2022 house value $477,765 White Non-Hispanic householders $440,595 Asian householders$314,985 Hispanic or Latino householders
Median age by race in Braselton
35.8 Median age for White residents36.3 35.6 64.1 Median age for Black or African American residents53.0 66.3 -597,462,513.8 Median age for American Indian / Alaska Native residents-666,666,666.0 -666,666,666.0 57.6 Median age for Asian residents82.5 54.9 -666,666,666.0 Median age for Native Hawaiian / Pacific Islander residents-666,666,666.0 -666,666,666.0 49.7 Median age for Other race residents-478,808,705.1 52.6 33.9 Median age for Two or more races residents27.8 34.4 36.1 Median age for White alone residents36.9 35.8 35.6 Median age for Hispanic or Latino residents25.1 46.1
Owner/renter occupied households by race in Braselton
House owners and renters - White residents 3,805 85.8% Owner occupied632 14.2% Renter occupiedHouse owners and renters - Black or African American residents 215 61.7% Owner occupied133 38.3% Renter occupiedHouse owners and renters - Asian residents 129 100.0% Owner occupiedHouse owners and renters - Other race residents 47 100.0% Owner occupiedHouse owners and renters - Two or more races residents 561 90.9% Owner occupied56 9.1% Renter occupiedHouse owners and renters - White alone residents 3,746 85.7% Owner occupied627 14.3% Renter occupiedHouse owners and renters - Hispanic or Latino residents 484 94.0% Owner occupied31 6.0% Renter occupied
Language usage in Braselton
English speakers - Total 89.1% of residents of Braselton speak English at home.
6.7% of residents speak Spanish at home 574 60.2% Speak English very well379 39.8% Speak English less than very well3.8% of residents speak other language at home 425 78.4% Speak English very well117 21.6% Speak English less than very well
English speakers - Born in the United States 90.4% of residents of Braselton speak English at home.
8.7% of residents speak Spanish at home 512 88.4% Speak English very well67 11.6% Speak English less than very well0.6% of residents speak other language at home 41 100.0% Speak English very well
English speakers - Native, born elsewhere 52.3% of residents of Braselton speak English at home.
0.8% of residents speak Spanish at home 7 100.0% Speak English very well2.8% of residents speak other language at home 23 100.0% Speak English very well
English speakers - Foreign-born 45.1% of residents of Braselton speak English at home.
29.7% of residents speak Spanish at home 179 39.3% Speak English very well277 60.7% Speak English less than very well29.2% of residents speak other language at home 284 63.3% Speak English very well165 36.7% Speak English less than very well
White (Caucasian) - Speak only English Native:
99.1% (11,040)Foreign-born:
23.2% (107)
White (Caucasian) - Speak another language Native:
1.1% (124)Foreign-born:
71.1% (328)
Black or African American - Speak only English Native:
99.8% (541)Foreign-born:
90.4% (137)
Asian - Speak another language Native:
100.0% (40)Foreign-born:
83.4% (198)
Other race - Speak only English Native:
34.1% (50)Foreign-born:
37.4% (18)
Other race - Speak another language Native:
65.8% (97)Foreign-born:
66.9% (32)
Two or more races - Speak only English Native:
67.4% (850)Foreign-born:
8.1% (42)
Two or more races - Speak another language Native:
32.3% (408)Foreign-born:
62.6% (323)
White alone - Speak only English Native:
98.9% (10,832)Foreign-born:
27.6% (120)
White alone - Speak another language Native:
1.0% (114)Foreign-born:
72.8% (318)
Hispanic or Latino - Speak another language Native:
44.9% (411)Foreign-born:
100.0% (443)
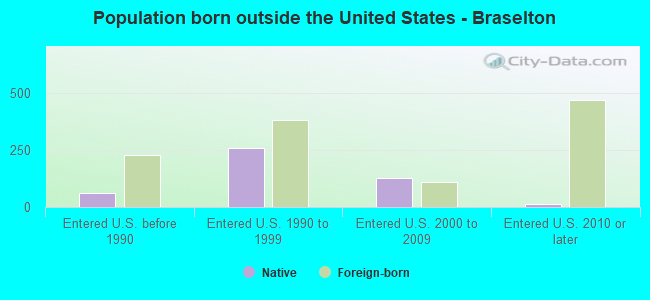
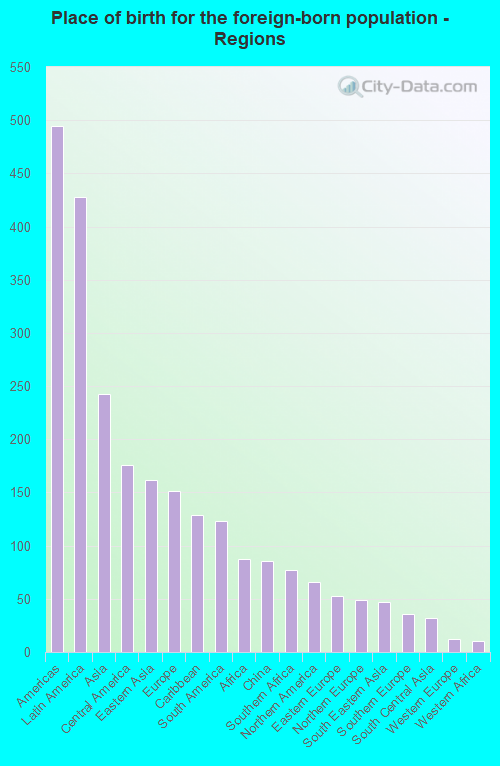
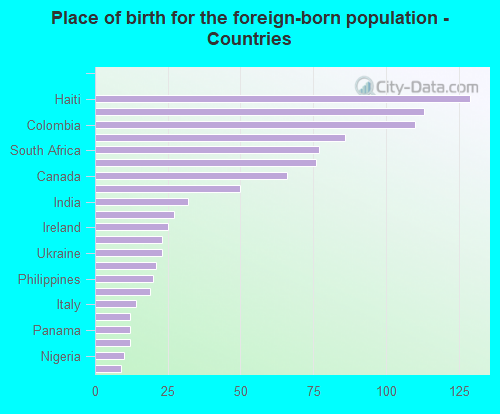
Foreign-born residents in Braselton 977 residents are foreign born (3.0% Latin America , 1.7% Asia , 1.0% Europe ).
This city:
6.5%Georgia:
10.4%
Marital status for residents in Braselton Marital status - White (Caucasian) population 15 years and over
Males 24.0% Never married67.6% Now married1.1% Separated2.9% Widowed4.4% DivorcedFemales 23.4% Never married60.0% Now married0.8% Separated5.5% Widowed10.2% DivorcedWomen who gave birth in the past 12 months Now married:
79.2% (126)Unmarried:
20.8% (33)
Women who did not give birth in the past 12 months Now married:
53.1% (1,624)Unmarried:
46.9% (1,436)
Marital status - Black or African American population 15 years and over
Males 29.9% Never married70.1% Now married0.0% Separated0.0% Widowed0.0% DivorcedFemales 36.3% Never married14.8% Now married0.0% Separated5.5% Widowed43.3% DivorcedWomen who gave birth in the past 12 months Now married:
0.0% (0)Unmarried:
100.0% (44)
Women who did not give birth in the past 12 months Now married:
35.1% (40)Unmarried:
64.9% (73)
Marital status - Asian population 15 years and over
Males 8.3% Never married71.1% Now married0.0% Separated4.1% Widowed16.5% DivorcedFemales 2.4% Never married71.2% Now married0.0% Separated0.0% Widowed26.4% DivorcedWomen who did not give birth in the past 12 months Now married:
65.4% (70)Unmarried:
34.6% (37)
Marital status - Other race population 15 years and over
Males 100.0% Never married0.0% Now married0.0% Separated0.0% Widowed0.0% DivorcedFemales 32.4% Never married49.3% Now married0.0% Separated0.0% Widowed18.4% DivorcedWomen who did not give birth in the past 12 months Now married:
55.6% (71)Unmarried:
44.4% (57)
Marital status - Two or more races population 15 years and over
Males 24.2% Never married73.2% Now married0.0% Separated0.0% Widowed2.5% DivorcedFemales 32.5% Never married41.2% Now married0.0% Separated7.8% Widowed18.4% DivorcedWomen who gave birth in the past 12 months Now married:
100.0% (24)Unmarried:
0.0% (0)
Women who did not give birth in the past 12 months Now married:
39.3% (147)Unmarried:
60.7% (226)
Marital status - White alone, not Hispanic / Latino population 15 years and over
Males 22.9% Never married68.4% Now married1.1% Separated3.1% Widowed4.5% DivorcedFemales 23.4% Never married60.6% Now married0.8% Separated5.0% Widowed10.1% DivorcedWomen who gave birth in the past 12 months Now married:
79.2% (128)Unmarried:
20.8% (34)
Women who did not give birth in the past 12 months Now married:
53.3% (1,628)Unmarried:
46.7% (1,426)
Marital status - Hispanic or Latino population 15 years and over
Males 35.0% Never married65.0% Now married0.0% Separated0.0% Widowed0.0% DivorcedFemales 25.7% Never married42.3% Now married0.0% Separated13.7% Widowed18.3% DivorcedWomen who did not give birth in the past 12 months Now married:
48.1% (219)Unmarried:
51.9% (236)
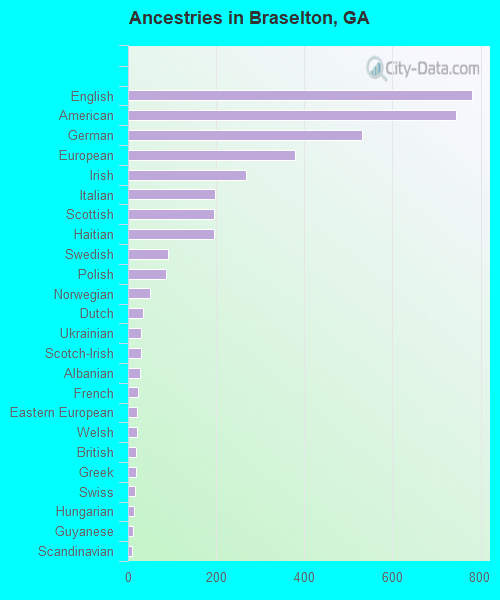
Ancestries in Braselton
780 13.9% English744 13.2% American531 9.4% German380 6.8% European268 4.8% Irish197 3.5% Italian196 3.5% Scottish195 3.5% Haitian90 1.6% Swedish86 1.5% Polish51 0.9% Norwegian35 0.6% Dutch30 0.5% Ukrainian29 0.5% Scotch-Irish27 0.5% Albanian22 0.4% French20 0.4% Eastern European20 0.4% Welsh19 0.3% British18 0.3% Greek16 0.3% Swiss14 0.2% Hungarian12 0.2% Guyanese9 0.2% Scandinavian
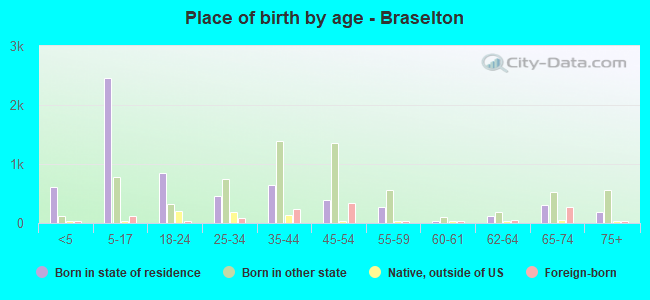
Children Nativity (place of birth) in Braselton
Children under 6 years - Living with two parents Both parents native 678 100.0% NativeBoth parents foreign-born 35 100.0% NativeOne native, one foreign-born parent 59 100.0% NativeChildren under 6 years - Living with one parent Native parent 119 100.0% NativeChildren 6 to 17 years - Living with two parents Both parents native 2,070 100.0% NativeBoth parents foreign-born 15 14.1% Native93 85.9% Foreign-bornOne native, one foreign-born parent 116 100.0% NativeChildren 6 to 17 years - Living with one parent Native parent 488 100.0% NativeForeign-born parent 53 50.3% Native53 49.7% Foreign-born
Grandparents responsible for own grandchildren in Braselton
Grandparents (30 to 59 years) White / Caucasian 9 100.0% Responsible for grandchildrenHispanic or Latino 8 100.0% Responsible for grandchildrenGrandparents (60 years and over) White / Caucasian 12 32.2% Responsible for grandchildren26 67.8% Not responsible for grandchildrenHispanic or Latino 16 100.0% Responsible for grandchildren