Races in Brandywine, Maryland (MD) Detailed Stats
Data:
Races - White alone (%)
Races - White alone (% change since 2000)
Races - Black alone (%)
Races - Black alone (% change since 2000)
Races - American Indian alone (%)
Races - American Indian alone (% change since 2000)
Races - Asian alone (%)
Races - Asian alone (% change since 2000)
Races - Hispanic (%)
Races - Hispanic (% change since 2000)
Races - Native Hawaiian and Other Pacific Islander alone (%)
Races - Native Hawaiian and Other Pacific Islander alone (% change since 2000)
Races - Two or more races(%)
Races - Two or more races(% change since 2000)
Races - Other race alone (%)
Races - Other race alone (% change since 2000)
Racial diversity
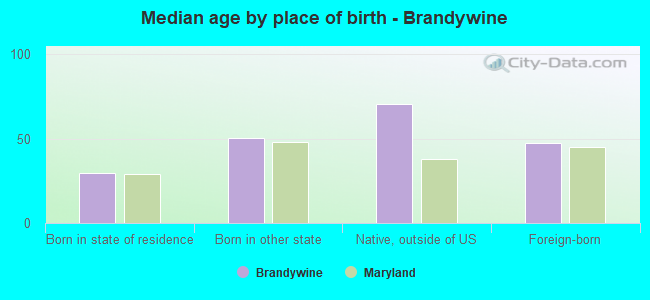
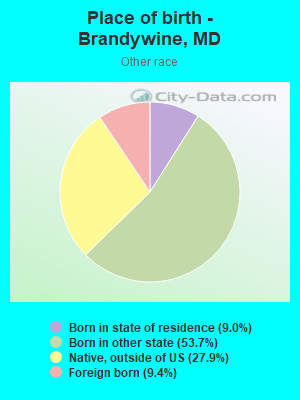
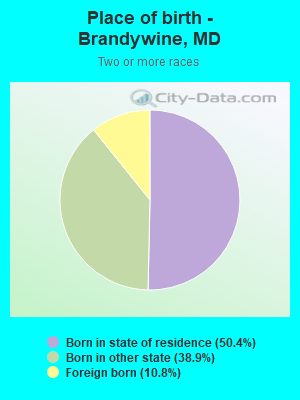
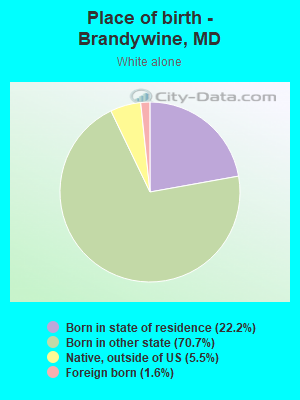
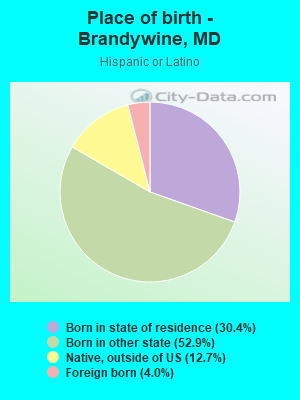
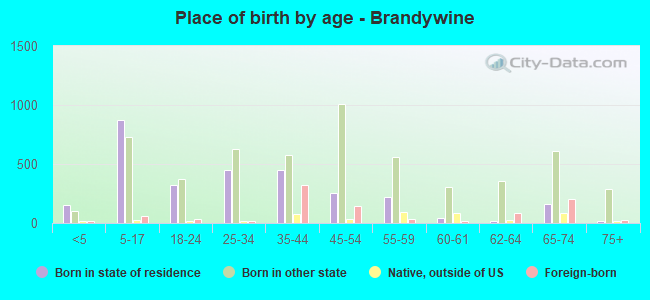
Place of birth - Born in state of residence (%)
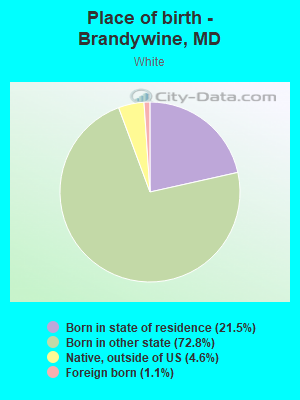
Place of birth - Born in state of residence (%) - White
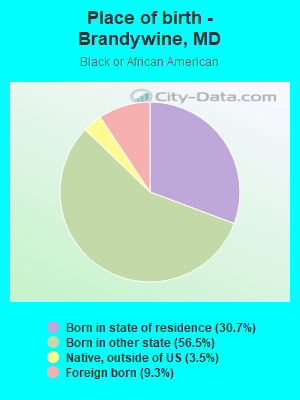
Place of birth - Born in state of residence (%) - Black or African American
Place of birth - Born in state of residence (%) - Asian
Place of birth - Born in state of residence (%) - Hispanic or Latino
Place of birth - Born in state of residence (%) - American Indian and Alaska Native
Place of birth - Born in state of residence (%) - Multirace
Place of birth - Born in state of residence (%) - Other Race
Place of birth - Born in other state (%)
Place of birth - Born in other state (%) - White
Place of birth - Born in other state (%) - Black or African American
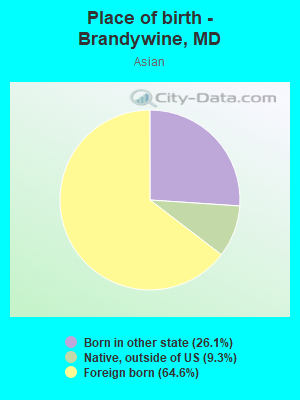
Place of birth - Born in other state (%) - Asian
Place of birth - Born in other state (%) - Hispanic or Latino
Place of birth - Born in other state (%) - American Indian and Alaska Native
Place of birth - Born in other state (%) - Multirace
Place of birth - Born in other state (%) - Other Race
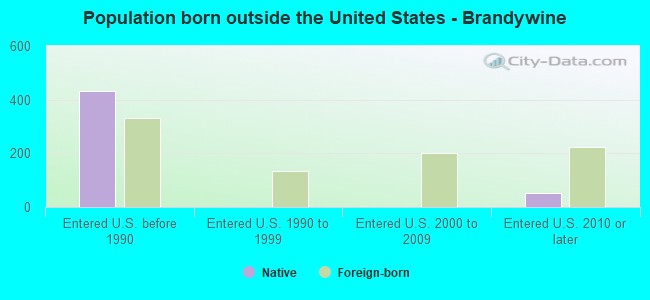
Place of birth - Native, outside of US (%)
Place of birth - Native, outside of US (%) - White
Place of birth - Native, outside of US (%) - Black or African American
Place of birth - Native, outside of US (%) - Asian
Place of birth - Native, outside of US (%) - Hispanic or Latino
Place of birth - Native, outside of US (%) - American Indian and Alaska Native
Place of birth - Native, outside of US (%) - Multirace
Place of birth - Native, outside of US (%) - Other Race
Place of birth - Foreign born (%)
Place of birth - Foreign born (%) - White
Place of birth - Foreign born (%) - Black or African American
Place of birth - Foreign born (%) - Asian
Place of birth - Foreign born (%) - Hispanic or Latino
Place of birth - Foreign born (%) - American Indian and Alaska Native
Place of birth - Foreign born (%) - Multirace
Place of birth - Foreign born (%) - Other Race
Residents speaking English at home (%)
Residents speaking English at home - Born in the United States (%)
Residents speaking English at home - Native, born elsewhere (%)
Residents speaking English at home - Foreign born (%)
Residents speaking Spanish at home (%)
Residents speaking Spanish at home - Born in the United States (%)
Residents speaking Spanish at home - Native, born elsewhere (%)
Residents speaking Spanish at home - Foreign born (%)
Residents speaking other language at home (%)
Residents speaking other language at home - Born in the United States (%)
Residents speaking other language at home - Native, born elsewhere (%)
Residents speaking other language at home - Foreign born (%)
Marital status - Never married (%)
Marital status - Now married (%)
Marital status - Separated (%)
Marital status - Widowed (%)
Marital status - Divorced (%)
Ancestries Reported - Arab (%)
Ancestries Reported - Czech (%)
Ancestries Reported - Danish (%)
Ancestries Reported - Dutch (%)
Ancestries Reported - English (%)
Ancestries Reported - French (%)
Ancestries Reported - French Canadian (%)
Ancestries Reported - German (%)
Ancestries Reported - Greek (%)
Ancestries Reported - Hungarian (%)
Ancestries Reported - Irish (%)
Ancestries Reported - Italian (%)
Ancestries Reported - Lithuanian (%)
Ancestries Reported - Norwegian (%)
Ancestries Reported - Polish (%)
Ancestries Reported - Portuguese (%)
Ancestries Reported - Russian (%)
Ancestries Reported - Scotch-Irish (%)
Ancestries Reported - Scottish (%)
Ancestries Reported - Slovak (%)
Ancestries Reported - Subsaharan African (%)
Ancestries Reported - Swedish (%)
Ancestries Reported - Swiss (%)
Ancestries Reported - Ukrainian (%)
Ancestries Reported - United States (%)
Ancestries Reported - Welsh (%)
Ancestries Reported - West Indian (%)
Ancestries Reported - Other (%)
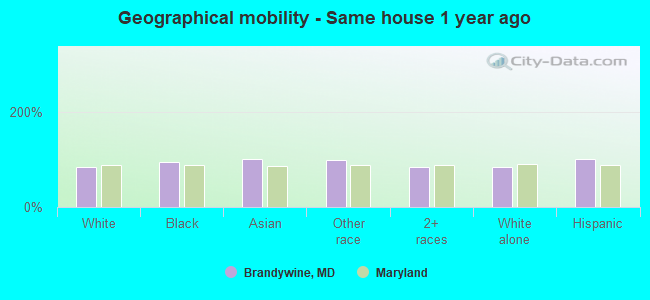
Geographical mobility - Same house 1 year ago (%)
Geographical mobility - Same house 1 year ago (%) - White
Geographical mobility - Same house 1 year ago (%) - Black or African American
Geographical mobility - Same house 1 year ago (%) - Asian
Geographical mobility - Same house 1 year ago (%) - Hispanic or Latino
Geographical mobility - Same house 1 year ago (%) - American Indian and Alaska Native
Geographical mobility - Same house 1 year ago (%) - Multirace
Geographical mobility - Same house 1 year ago (%) - Other Race
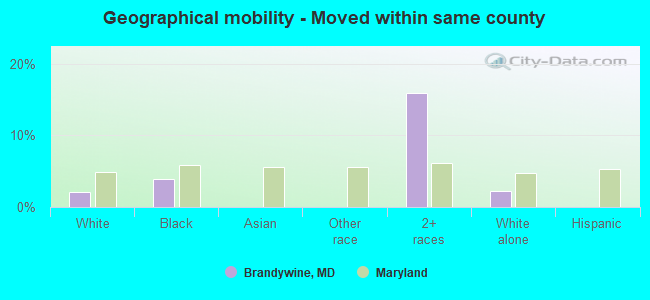
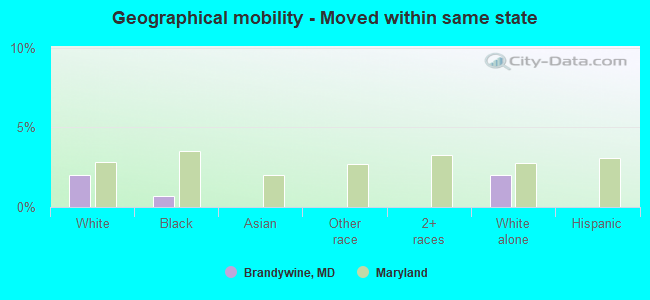
Geographical mobility - Moved within same county (%)
Geographical mobility - Moved within same county (%) - White
Geographical mobility - Moved within same county (%) - Black or African American
Geographical mobility - Moved within same county (%) - Asian
Geographical mobility - Moved within same county (%) - Hispanic or Latino
Geographical mobility - Moved within same county (%) - American Indian and Alaska Native
Geographical mobility - Moved within same county (%) - Multirace
Geographical mobility - Moved within same county (%) - Other Race
Geographical mobility - Moved from different county within same state (%)
Geographical mobility - Moved from different county within same state (%) - White
Geographical mobility - Moved from different county within same state (%) - Black or African American
Geographical mobility - Moved from different county within same state (%) - Asian
Geographical mobility - Moved from different county within same state (%) - Hispanic or Latino
Geographical mobility - Moved from different county within same state (%) - American Indian and Alaska Native
Geographical mobility - Moved from different county within same state (%) - Multirace
Geographical mobility - Moved from different county within same state (%) - Other Race
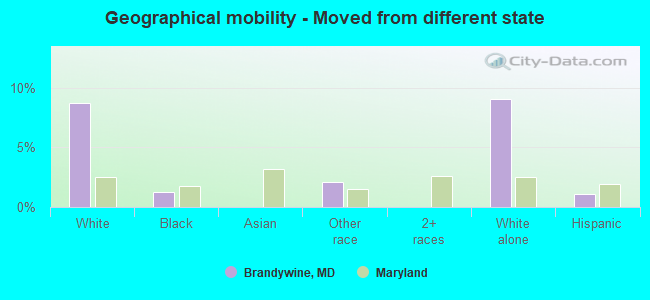
Geographical mobility - Moved from different state (%)
Geographical mobility - Moved from different state (%) - White
Geographical mobility - Moved from different state (%) - Black or African American
Geographical mobility - Moved from different state (%) - Asian
Geographical mobility - Moved from different state (%) - Hispanic or Latino
Geographical mobility - Moved from different state (%) - American Indian and Alaska Native
Geographical mobility - Moved from different state (%) - Multirace
Geographical mobility - Moved from different state (%) - Other Race
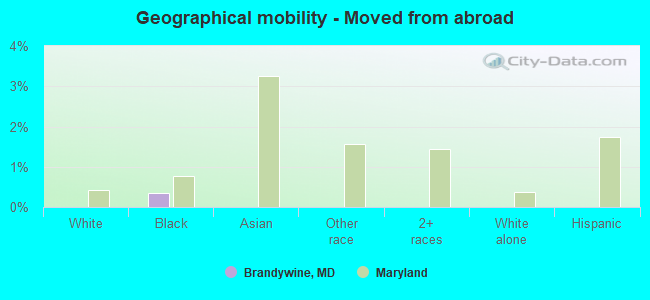
Geographical mobility - Moved from abroad (%)
Geographical mobility - Moved from abroad (%) - White
Geographical mobility - Moved from abroad (%) - Black or African American
Geographical mobility - Moved from abroad (%) - Asian
Geographical mobility - Moved from abroad (%) - Hispanic or Latino
Geographical mobility - Moved from abroad (%) - American Indian and Alaska Native
Geographical mobility - Moved from abroad (%) - Multirace
Geographical mobility - Moved from abroad (%) - Other Race
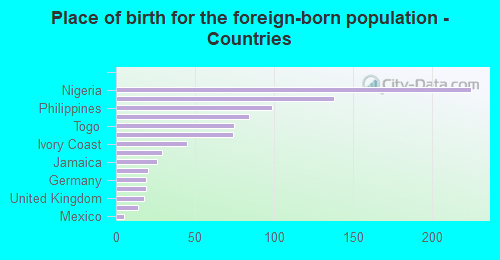
Place of birth for the foreign-born population - Ireland (%)
Place of birth for the foreign-born population - Denmark (%)
Place of birth for the foreign-born population - Norway (%)
Place of birth for the foreign-born population - Sweden (%)
Place of birth for the foreign-born population - United Kingdom (%)
Place of birth for the foreign-born population - England (%)
Place of birth for the foreign-born population - Scotland (%)
Place of birth for the foreign-born population - Other Northern Europe (%)
Place of birth for the foreign-born population - Austria (%)
Place of birth for the foreign-born population - Belgium (%)
Place of birth for the foreign-born population - France (%)
Place of birth for the foreign-born population - Germany (%)
Place of birth for the foreign-born population - Netherlands (%)
Place of birth for the foreign-born population - Switzerland (%)
Place of birth for the foreign-born population - Other Western Europe (%)
Place of birth for the foreign-born population - Greece (%)
Place of birth for the foreign-born population - Italy (%)
Place of birth for the foreign-born population - Portugal (%)
Place of birth for the foreign-born population - Spain (%)
Place of birth for the foreign-born population - Other Southern Europe (%)
Place of birth for the foreign-born population - Albania (%)
Place of birth for the foreign-born population - Belarus (%)
Place of birth for the foreign-born population - Bosnia and Herzegovina (%)
Place of birth for the foreign-born population - Bulgaria (%)
Place of birth for the foreign-born population - Croatia (%)
Place of birth for the foreign-born population - Czechoslovakia (%)
Place of birth for the foreign-born population - Hungary (%)
Place of birth for the foreign-born population - Latvia (%)
Place of birth for the foreign-born population - Lithuania (%)
Place of birth for the foreign-born population - North Macedonia (Macedonia) (%)
Place of birth for the foreign-born population - Moldova (%)
Place of birth for the foreign-born population - Poland (%)
Place of birth for the foreign-born population - Romania (%)
Place of birth for the foreign-born population - Russia (%)
Place of birth for the foreign-born population - Serbia (%)
Place of birth for the foreign-born population - Ukraine (%)
Place of birth for the foreign-born population - Other Eastern Europe (%)
Place of birth for the foreign-born population - China (%)
Place of birth for the foreign-born population - Hong Kong (%)
Place of birth for the foreign-born population - Taiwan (%)
Place of birth for the foreign-born population - Japan (%)
Place of birth for the foreign-born population - Korea (%)
Place of birth for the foreign-born population - Other Eastern Asia (%)
Place of birth for the foreign-born population - Afghanistan (%)
Place of birth for the foreign-born population - Bangladesh (%)
Place of birth for the foreign-born population - India (%)
Place of birth for the foreign-born population - Iran (%)
Place of birth for the foreign-born population - Kazakhstan (%)
Place of birth for the foreign-born population - Nepal (%)
Place of birth for the foreign-born population - Pakistan (%)
Place of birth for the foreign-born population - Sri Lanka (%)
Place of birth for the foreign-born population - Uzbekistan (%)
Place of birth for the foreign-born population - Other South Central Asia (%)
Place of birth for the foreign-born population - Burma (%)
Place of birth for the foreign-born population - Cambodia (%)
Place of birth for the foreign-born population - Indonesia (%)
Place of birth for the foreign-born population - Laos (%)
Place of birth for the foreign-born population - Malaysia (%)
Place of birth for the foreign-born population - Philippines (%)
Place of birth for the foreign-born population - Singapore (%)
Place of birth for the foreign-born population - Thailand (%)
Place of birth for the foreign-born population - Vietnam (%)
Place of birth for the foreign-born population - Other South Eastern Asia (%)
Place of birth for the foreign-born population - Armenia (%)
Place of birth for the foreign-born population - Iraq (%)
Place of birth for the foreign-born population - Israel (%)
Place of birth for the foreign-born population - Jordan (%)
Place of birth for the foreign-born population - Kuwait (%)
Place of birth for the foreign-born population - Lebanon (%)
Place of birth for the foreign-born population - Saudi Arabia (%)
Place of birth for the foreign-born population - Syria (%)
Place of birth for the foreign-born population - Turkey (%)
Place of birth for the foreign-born population - Yemen (%)
Place of birth for the foreign-born population - Other Western Asia (%)
Place of birth for the foreign-born population - Eritrea (%)
Place of birth for the foreign-born population - Ethiopia (%)
Place of birth for the foreign-born population - Kenya (%)
Place of birth for the foreign-born population - Somalia (%)
Place of birth for the foreign-born population - Uganda (%)
Place of birth for the foreign-born population - Zimbabwe (%)
Place of birth for the foreign-born population - Other Eastern Africa (%)
Place of birth for the foreign-born population - Cameroon (%)
Place of birth for the foreign-born population - Congo (%)
Place of birth for the foreign-born population - Democratic Republic of Congo (Zaire) (%)
Place of birth for the foreign-born population - Other Middle Africa (%)
Place of birth for the foreign-born population - Egypt (%)
Place of birth for the foreign-born population - Morocco (%)
Place of birth for the foreign-born population - Sudan (%)
Place of birth for the foreign-born population - Other Northern Africa (%)
Place of birth for the foreign-born population - South Africa (%)
Place of birth for the foreign-born population - Other Southern Africa (%)
Place of birth for the foreign-born population - Cabo Verde (%)
Place of birth for the foreign-born population - Ghana (%)
Place of birth for the foreign-born population - Liberia (%)
Place of birth for the foreign-born population - Nigeria (%)
Place of birth for the foreign-born population - Senegal (%)
Place of birth for the foreign-born population - Sierra Leone (%)
Place of birth for the foreign-born population - Other Western Africa (%)
Place of birth for the foreign-born population - Australia (%)
Place of birth for the foreign-born population - New Zealand (%)
Place of birth for the foreign-born population - Fiji (%)
Place of birth for the foreign-born population - Micronesia (%)
Place of birth for the foreign-born population - Bahamas (%)
Place of birth for the foreign-born population - Barbados (%)
Place of birth for the foreign-born population - Cuba (%)
Place of birth for the foreign-born population - Dominica (%)
Place of birth for the foreign-born population - Dominican Republic (%)
Place of birth for the foreign-born population - Grenada (%)
Place of birth for the foreign-born population - Haiti (%)
Place of birth for the foreign-born population - Jamaica (%)
Place of birth for the foreign-born population - St. Vincent and the Grenadines (%)
Place of birth for the foreign-born population - Trinidad and Tobago (%)
Place of birth for the foreign-born population - West Indies (%)
Place of birth for the foreign-born population - Other Caribbean (%)
Place of birth for the foreign-born population - Belize (%)
Place of birth for the foreign-born population - Costa Rica (%)
Place of birth for the foreign-born population - El Salvador (%)
Place of birth for the foreign-born population - Guatemala (%)
Place of birth for the foreign-born population - Honduras (%)
Place of birth for the foreign-born population - Mexico (%)
Place of birth for the foreign-born population - Nicaragua (%)
Place of birth for the foreign-born population - Panama (%)
Place of birth for the foreign-born population - Other Central America (%)
Place of birth for the foreign-born population - Argentina (%)
Place of birth for the foreign-born population - Bolivia (%)
Place of birth for the foreign-born population - Brazil (%)
Place of birth for the foreign-born population - Chile (%)
Place of birth for the foreign-born population - Colombia (%)
Place of birth for the foreign-born population - Ecuador (%)
Place of birth for the foreign-born population - Guyana (%)
Place of birth for the foreign-born population - Peru (%)
Place of birth for the foreign-born population - Uruguay (%)
Place of birth for the foreign-born population - Venezuela (%)
Place of birth for the foreign-born population - Other South America (%)
Place of birth for the foreign-born population - Canada (%)
Place of birth for the foreign-born population - Other Northern America (%)
Place of birth for the foreign-born population - Other (%)
Latest news about races in Brandywine, MD collected exclusively by city-data.com from local newspapers, TV, and radio stations
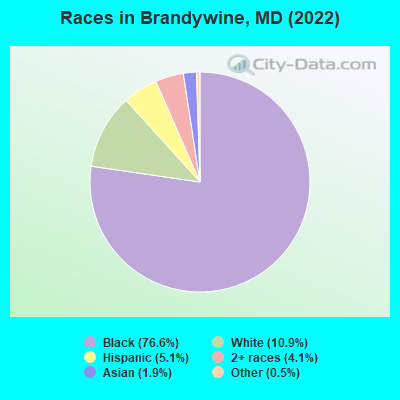
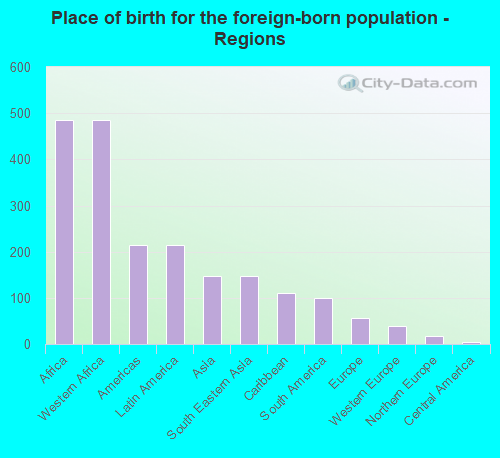
According to 2022 data, the most numerous races in Brandywine, MD are White alone (1,084 residents), Black alone (7,643 residents), and Hispanic (504 residents). 87.8% of Brandywine residents speak English at home. 9.1% of Brandywine, MD residents are foreign-born (4.5% born in Africa, 2.0% born in Latin America, 1.4% born in Asia), which is 76.2% less than the foreign-born rate of 16.0% across the entire state of Maryland.
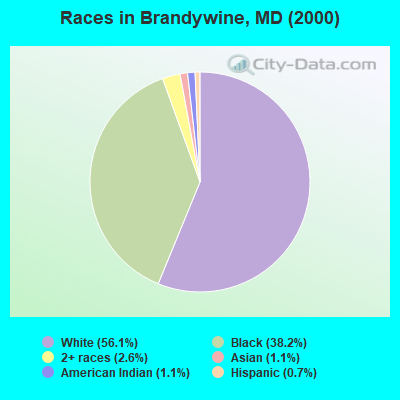
Race distribution in Brandywine
2000 2022
3,286,547 62.1% White alone 1,464,735 27.7% Black alone 227,916 4.3% Hispanic 209,738 4.0% Asian alone 82,946 1.6% Two or more races 13,312 0.3% American Indian alone 9,379 0.2% Other race alone 1,913 0.04% Native Hawaiian and Other
2,906,492 47.1% White alone 1,800,914 29.2% Black alone 705,842 11.4% Hispanic 401,818 6.5% Asian alone 291,317 4.7% Two or more races 46,930 0.8% Other race alone 8,930 0.1% American Indian alone 2,417 0.04% Native Hawaiian and Other
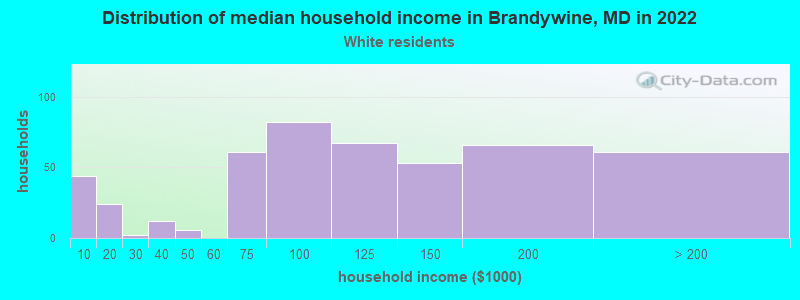
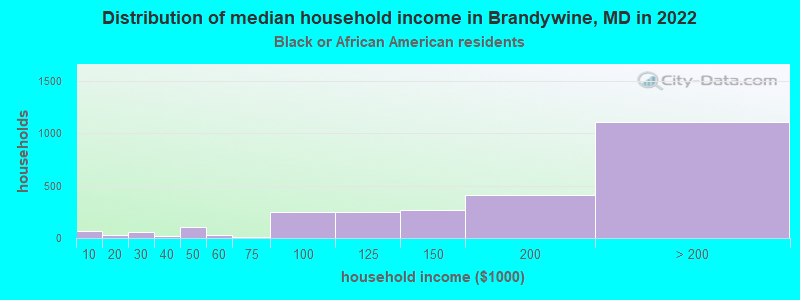
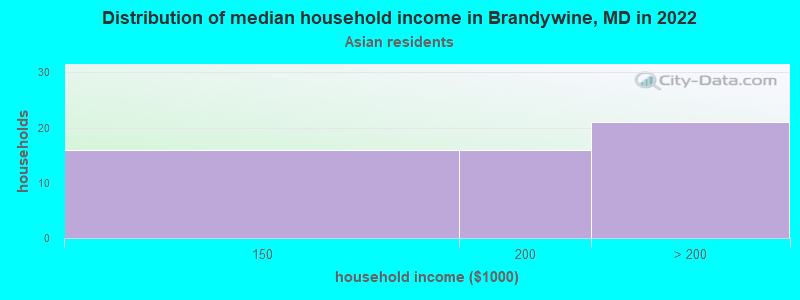
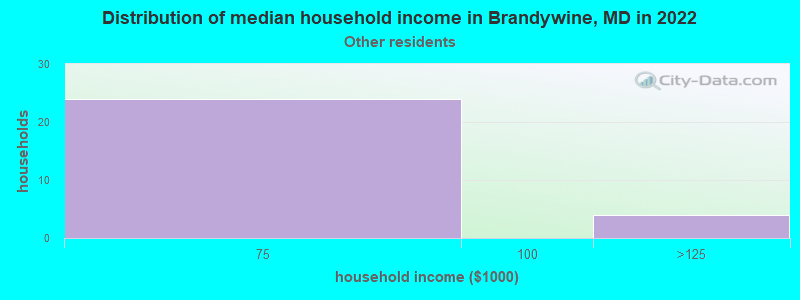
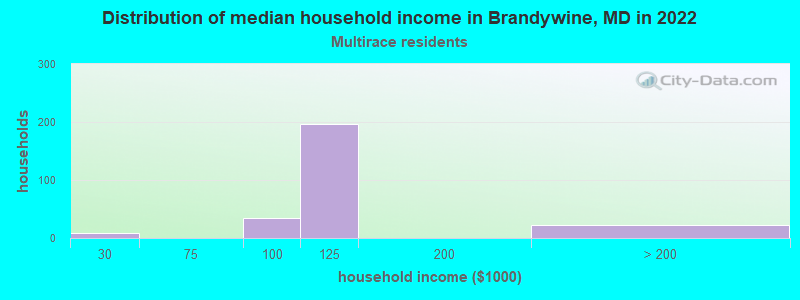
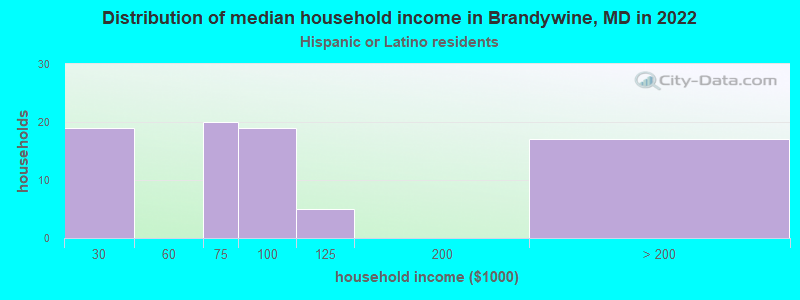
Income and house value in Brandywine Median household income in 2022 $108,649 White non-Hispanic householders$168,339 Black householdersover $200,000 Asian householders$102,495 Two or more races householders$89,692 Hispanic or Latino race householdersMedian 2022 house value $512,161 White Non-Hispanic householders$576,556 Black or African American householders$647,315 Two or more races householders
Median age by race in Brandywine
57.8 Median age for White residents52.2 61.5 45.1 Median age for Black or African American residents44.9 46.4 -780,410,741.7 Median age for American Indian / Alaska Native residents-888,297,871.5 -689,905,591.2 54.3 Median age for Asian residents67.5 54.7 -571,600,480.8 Median age for Native Hawaiian / Pacific Islander residents-720,061,021.4 -760,942,760.2 40.6 Median age for Other race residents17.0 42.8 23.8 Median age for Two or more races residents20.6 31.0 57.8 Median age for White alone residents52.5 59.9 32.9 Median age for Hispanic or Latino residents20.0 41.4
Owner/renter occupied households by race in Brandywine
House owners and renters - White residents 415 90.3% Owner occupied45 9.7% Renter occupiedHouse owners and renters - Black or African American residents 2,529 95.8% Owner occupied112 4.2% Renter occupiedHouse owners and renters - Asian residents 75 100.0% Owner occupiedHouse owners and renters - Other race residents 24 100.0% Owner occupiedHouse owners and renters - Two or more races residents 221 100.0% Owner occupiedHouse owners and renters - White alone residents 432 90.5% Owner occupied45 9.5% Renter occupiedHouse owners and renters - Hispanic or Latino residents 79 100.0% Owner occupied
Language usage in Brandywine
English speakers - Total 87.8% of residents of Brandywine speak English at home.
2.3% of residents speak Spanish at home 195 88.6% Speak English very well25 11.4% Speak English less than very well7.8% of residents speak other language at home 532 70.5% Speak English very well223 29.5% Speak English less than very well
English speakers - Born in the United States 95.7% of residents of Brandywine speak English at home.
1.8% of residents speak Spanish at home 98 100.0% Speak English very well1.8% of residents speak other language at home 81 81.8% Speak English very well18 18.2% Speak English less than very well
English speakers - Native, born elsewhere 76.0% of residents of Brandywine speak English at home.
11.6% of residents speak Spanish at home 45 100.0% Speak English very well4.4% of residents speak other language at home 17 100.0% Speak English very well
English speakers - Foreign-born 38.3% of residents of Brandywine speak English at home.
2.0% of residents speak Spanish at home 13 72.2% Speak English very well5 27.8% Speak English less than very well61.5% of residents speak other language at home 392 69.4% Speak English very well173 30.6% Speak English less than very well
White (Caucasian) - Speak only English Native:
99.4% (1,066)Foreign-born:
100.0% (11)
Black or African American - Speak only English Native:
96.9% (6,441)Foreign-born:
22.9% (163)
Black or African American - Speak another language Native:
2.9% (196)Foreign-born:
79.1% (564)
Asian - Speak only English Native:
60.6% (36)Foreign-born:
97.3% (128)
Asian - Speak another language Native:
27.5% (16)Foreign-born:
19.7% (26)
Other race - Speak another language Native:
60.5% (122)Foreign-born:
100.0% (20)
Two or more races - Speak only English Native:
90.6% (514)Foreign-born:
82.8% (61)
Two or more races - Speak another language Native:
8.1% (46)Foreign-born:
2.1% (2)
White alone - Speak only English Native:
97.5% (1,026)Foreign-born:
100.0% (17)
Hispanic or Latino - Speak another language Native:
35.7% (157)Foreign-born:
100.0% (20)
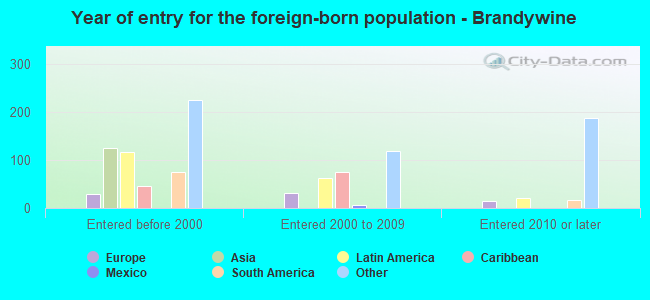
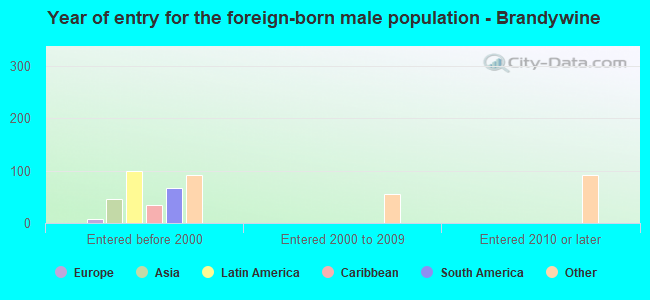
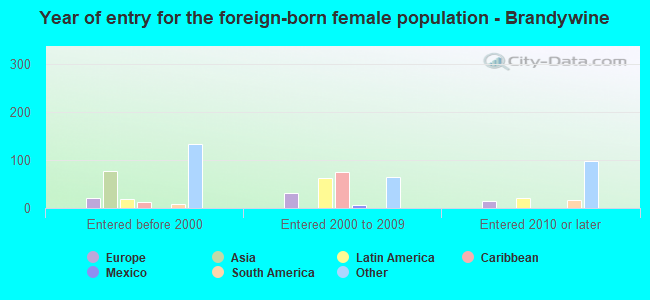
Foreign-born residents in Brandywine 906 residents are foreign born (4.5% Africa , 2.0% Latin America , 1.4% Asia ).
This city:
9.1%Maryland:
15.7%
Marital status for residents in Brandywine Marital status - White (Caucasian) population 15 years and over
Males 27.5% Never married59.4% Now married0.0% Separated0.0% Widowed13.1% DivorcedFemales 25.6% Never married46.9% Now married7.2% Separated9.4% Widowed10.9% DivorcedWomen who gave birth in the past 12 months Now married:
0.0% (0)Unmarried:
100.0% (13)
Women who did not give birth in the past 12 months Now married:
28.2% (44)Unmarried:
71.8% (112)
Marital status - Black or African American population 15 years and over
Males 37.6% Never married54.1% Now married0.4% Separated1.3% Widowed6.7% DivorcedFemales 34.1% Never married45.7% Now married1.6% Separated10.8% Widowed7.8% DivorcedWomen who gave birth in the past 12 months Now married:
76.0% (54)Unmarried:
24.0% (17)
Women who did not give birth in the past 12 months Now married:
39.3% (618)Unmarried:
60.7% (953)
Marital status - Asian population 15 years and over
Males 0.0% Never married100.0% Now married0.0% Separated0.0% Widowed0.0% DivorcedFemales 14.9% Never married71.1% Now married0.0% Separated14.0% Widowed0.0% DivorcedWomen who did not give birth in the past 12 months Now married:
35.3% (17)Unmarried:
64.7% (31)
Marital status - Other race population 15 years and over
Males 71.7% Never married13.2% Now married0.0% Separated0.0% Widowed15.1% DivorcedFemales 43.2% Never married56.8% Now married0.0% Separated0.0% Widowed0.0% DivorcedWomen who did not give birth in the past 12 months Now married:
28.9% (29)Unmarried:
71.1% (71)
Marital status - Two or more races population 15 years and over
Males 65.4% Never married26.4% Now married0.0% Separated0.0% Widowed8.2% DivorcedFemales 66.1% Never married33.9% Now married0.0% Separated0.0% Widowed0.0% DivorcedWomen who gave birth in the past 12 months Now married:
0.0% (0)Unmarried:
100.0% (15)
Women who did not give birth in the past 12 months Now married:
28.9% (52)Unmarried:
71.1% (128)
Marital status - White alone, not Hispanic / Latino population 15 years and over
Males 28.9% Never married62.5% Now married0.0% Separated0.0% Widowed8.6% DivorcedFemales 26.4% Never married48.3% Now married7.4% Separated9.7% Widowed8.3% DivorcedWomen who did not give birth in the past 12 months Now married:
28.2% (49)Unmarried:
71.8% (124)
Marital status - Hispanic or Latino population 15 years and over
Males 35.5% Never married32.6% Now married0.0% Separated0.0% Widowed31.9% DivorcedFemales 45.2% Never married47.6% Now married0.0% Separated0.0% Widowed7.1% DivorcedWomen who gave birth in the past 12 months Now married:
0.0% (0)Unmarried:
100.0% (30)
Women who did not give birth in the past 12 months Now married:
34.1% (43)Unmarried:
65.9% (83)
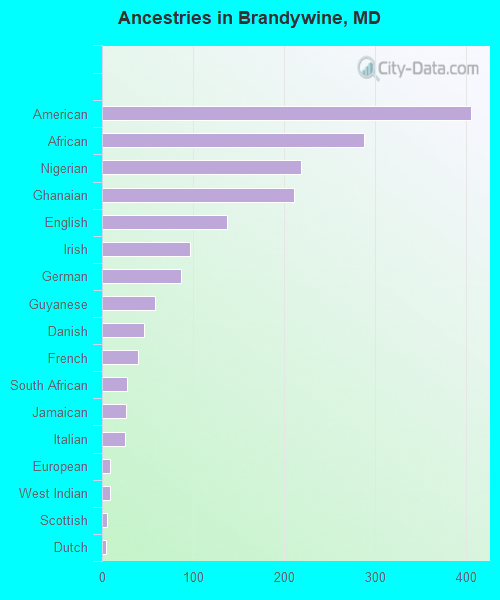
Ancestries in Brandywine
405 5.7% American288 4.1% African219 3.1% Nigerian211 3.0% Ghanaian137 1.9% English97 1.4% Irish87 1.2% German58 0.8% Guyanese46 0.7% Danish40 0.6% French28 0.4% South African26 0.4% Jamaican25 0.4% Italian9 0.1% European9 0.1% West Indian6 0.08% Scottish4 0.06% Dutch
Children Nativity (place of birth) in Brandywine
Children under 6 years - Living with two parents Both parents native 97 100.0% NativeBoth parents foreign-born 46 100.0% NativeOne native, one foreign-born parent 150 100.0% NativeChildren under 6 years - Living with one parent Native parent 204 100.0% Native0 0.0% Foreign-bornForeign-born parent 10 43.7% Native13 56.3% Foreign-bornChildren 6 to 17 years - Living with two parents Both parents native 592 100.0% NativeBoth parents foreign-born 100 100.0% NativeOne native, one foreign-born parent 160 100.0% NativeChildren 6 to 17 years - Living with one parent Native parent 475 92.1% Native41 7.9% Foreign-bornForeign-born parent 51 84.4% Native10 15.6% Foreign-born
Grandparents responsible for own grandchildren in Brandywine
Grandparents (30 to 59 years) White / Caucasian 11 100.0% Not responsible for grandchildrenBlack or African American 20 41.7% Responsible for grandchildren28 58.3% Not responsible for grandchildrenWhite alone, not Hispanic / Latino 12 100.0% Not responsible for grandchildrenGrandparents (60 years and over) Black or African American 63 28.9% Responsible for grandchildren154 71.1% Not responsible for grandchildren