Races in Brandywine, Delaware (DE) Detailed Stats
Ancestries, Foreign-born residents, place of birth
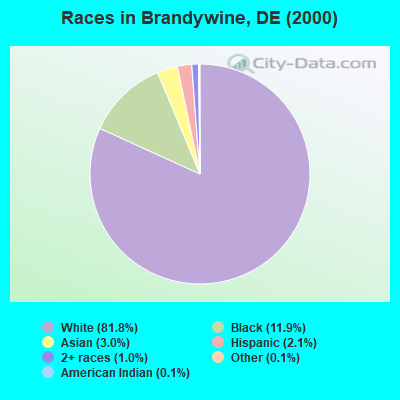
Race distribution in Brandywine

- 64,29081.8%White alone
- 9,38111.9%Black alone
- 2,3293.0%Asian alone
- 1,6312.1%Hispanic
- 7811.0%Two or more races
- 980.1%Other race alone
- 920.1%American Indian alone
- 180.02%Native Hawaiian and Other
Pacific Islander alone
2000
2022
-
- 567,97372.5%White alone
- 148,43518.9%Black alone
- 37,2774.8%Hispanic
- 16,1102.1%Asian alone
- 10,2221.3%Two or more races
- 2,3240.3%American Indian alone
- 1,0250.1%Other race alone
- 2340.03%Native Hawaiian and Other
Pacific Islander alone

-
- 599,34758.9%White alone
- 220,01021.6%Black alone
- 105,30010.3%Hispanic
- 46,0164.5%Two or more races
- 41,3504.1%Asian alone
- 5,0970.5%Other race alone
- 1,2760.1%American Indian alone

Income and house value in Brandywine
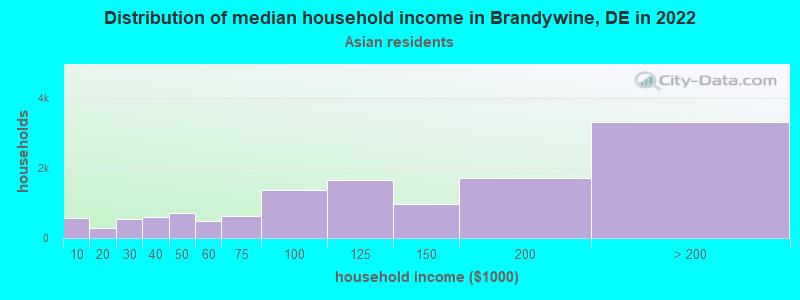
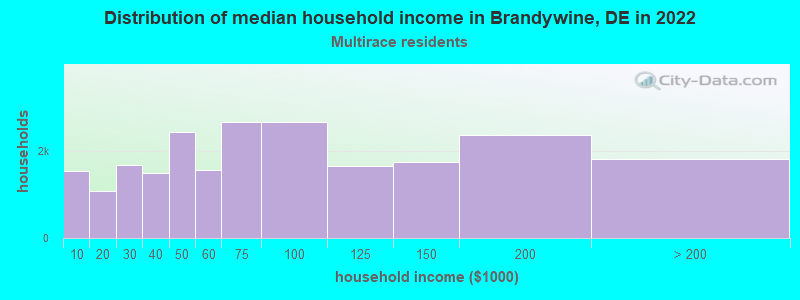
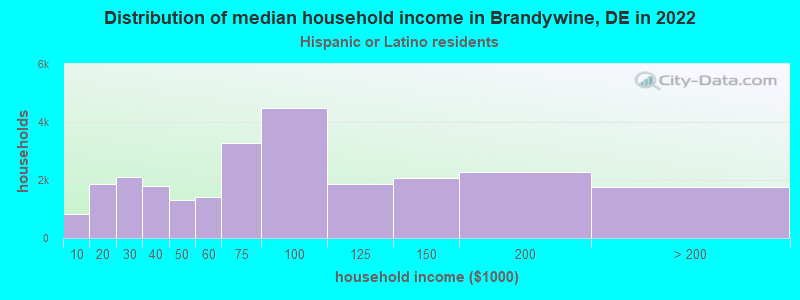
- Median household income in 2022
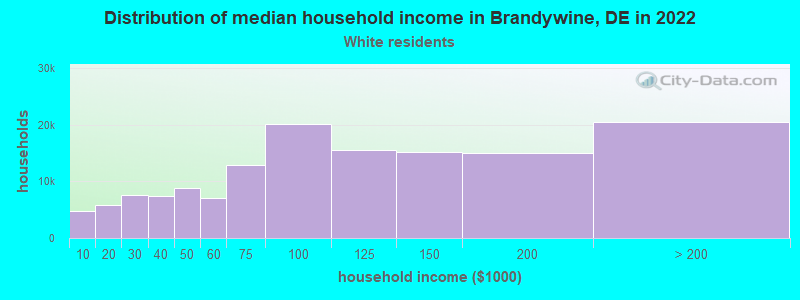
- $99,955White non-Hispanic householders
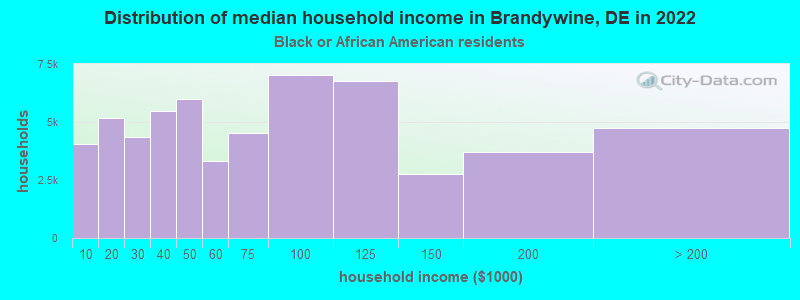
- $65,343Black householders
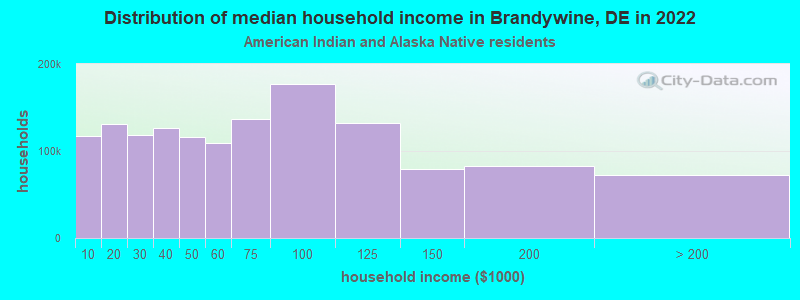
- $72,328American Indian and Alaska Native householders
- $113,792Asian householders
- $83,724Some other race householders
- $100,168Two or more races householders
- $100,144Hispanic or Latino race householders
- Median 2022 house value
- $408,832White Non-Hispanic householders
- $365,010Black or African American householders
- $336,626American Indian or Alaska Native householders
- $449,167Asian householders
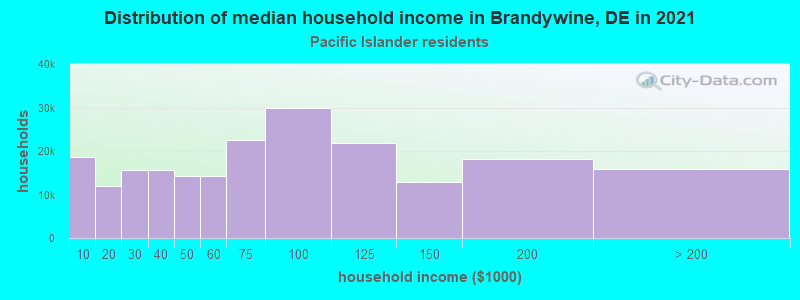
- $466,845Native Hawaiian and other Pacific Islander householders
- $612,003Some other race householders
- $303,262Two or more races householders
- $383,933Hispanic or Latino householders
Household income for White non-Hispanic householders
Household income for Black householders
Household income for American Indian and Alaska Native householders
Household income for Asian householders
Household income for Native Hawaiian and other Pacific Islander householders
Household income for Two or more races householders
Household income for Hispanic or Latino race householders
Zip code: 19803