Races in Bradley, Illinois (IL) Detailed Stats
Data:
Races - White alone (%)
Races - White alone (% change since 2000)
Races - Black alone (%)
Races - Black alone (% change since 2000)
Races - American Indian alone (%)
Races - American Indian alone (% change since 2000)
Races - Asian alone (%)
Races - Asian alone (% change since 2000)
Races - Hispanic (%)
Races - Hispanic (% change since 2000)
Races - Native Hawaiian and Other Pacific Islander alone (%)
Races - Native Hawaiian and Other Pacific Islander alone (% change since 2000)
Races - Two or more races(%)
Races - Two or more races(% change since 2000)
Races - Other race alone (%)
Races - Other race alone (% change since 2000)
Racial diversity
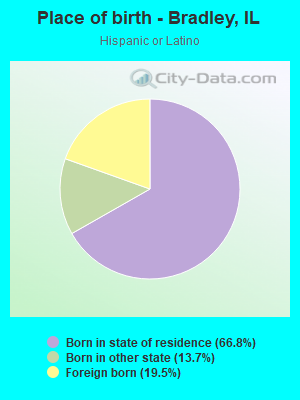
Place of birth - Born in state of residence (%)
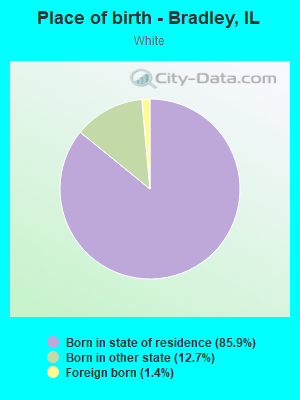
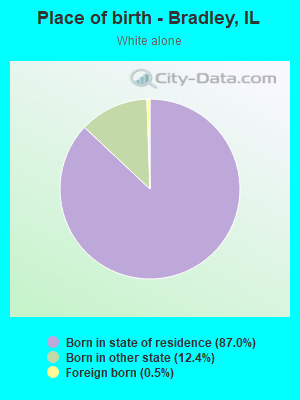
Place of birth - Born in state of residence (%) - White
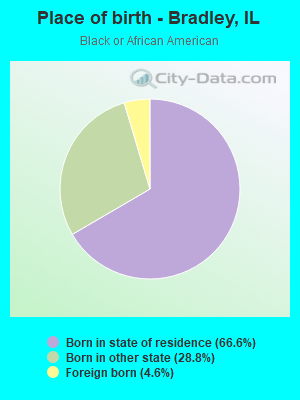
Place of birth - Born in state of residence (%) - Black or African American
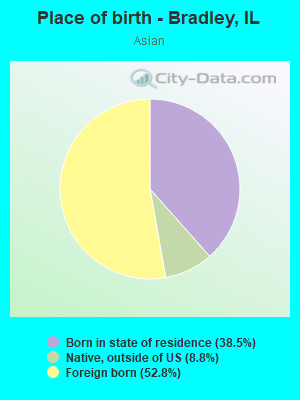
Place of birth - Born in state of residence (%) - Asian
Place of birth - Born in state of residence (%) - Hispanic or Latino
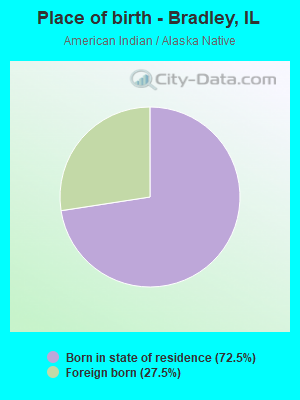
Place of birth - Born in state of residence (%) - American Indian and Alaska Native
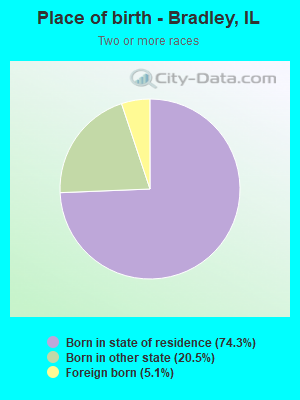
Place of birth - Born in state of residence (%) - Multirace
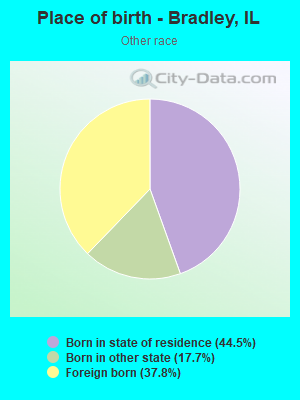
Place of birth - Born in state of residence (%) - Other Race
Place of birth - Born in other state (%)
Place of birth - Born in other state (%) - White
Place of birth - Born in other state (%) - Black or African American
Place of birth - Born in other state (%) - Asian
Place of birth - Born in other state (%) - Hispanic or Latino
Place of birth - Born in other state (%) - American Indian and Alaska Native
Place of birth - Born in other state (%) - Multirace
Place of birth - Born in other state (%) - Other Race
Place of birth - Native, outside of US (%)
Place of birth - Native, outside of US (%) - White
Place of birth - Native, outside of US (%) - Black or African American
Place of birth - Native, outside of US (%) - Asian
Place of birth - Native, outside of US (%) - Hispanic or Latino
Place of birth - Native, outside of US (%) - American Indian and Alaska Native
Place of birth - Native, outside of US (%) - Multirace
Place of birth - Native, outside of US (%) - Other Race
Place of birth - Foreign born (%)
Place of birth - Foreign born (%) - White
Place of birth - Foreign born (%) - Black or African American
Place of birth - Foreign born (%) - Asian
Place of birth - Foreign born (%) - Hispanic or Latino
Place of birth - Foreign born (%) - American Indian and Alaska Native
Place of birth - Foreign born (%) - Multirace
Place of birth - Foreign born (%) - Other Race
Residents speaking English at home (%)
Residents speaking English at home - Born in the United States (%)
Residents speaking English at home - Native, born elsewhere (%)
Residents speaking English at home - Foreign born (%)
Residents speaking Spanish at home (%)
Residents speaking Spanish at home - Born in the United States (%)
Residents speaking Spanish at home - Native, born elsewhere (%)
Residents speaking Spanish at home - Foreign born (%)
Residents speaking other language at home (%)
Residents speaking other language at home - Born in the United States (%)
Residents speaking other language at home - Native, born elsewhere (%)
Residents speaking other language at home - Foreign born (%)
Marital status - Never married (%)
Marital status - Now married (%)
Marital status - Separated (%)
Marital status - Widowed (%)
Marital status - Divorced (%)
Ancestries Reported - Arab (%)
Ancestries Reported - Czech (%)
Ancestries Reported - Danish (%)
Ancestries Reported - Dutch (%)
Ancestries Reported - English (%)
Ancestries Reported - French (%)
Ancestries Reported - French Canadian (%)
Ancestries Reported - German (%)
Ancestries Reported - Greek (%)
Ancestries Reported - Hungarian (%)
Ancestries Reported - Irish (%)
Ancestries Reported - Italian (%)
Ancestries Reported - Lithuanian (%)
Ancestries Reported - Norwegian (%)
Ancestries Reported - Polish (%)
Ancestries Reported - Portuguese (%)
Ancestries Reported - Russian (%)
Ancestries Reported - Scotch-Irish (%)
Ancestries Reported - Scottish (%)
Ancestries Reported - Slovak (%)
Ancestries Reported - Subsaharan African (%)
Ancestries Reported - Swedish (%)
Ancestries Reported - Swiss (%)
Ancestries Reported - Ukrainian (%)
Ancestries Reported - United States (%)
Ancestries Reported - Welsh (%)
Ancestries Reported - West Indian (%)
Ancestries Reported - Other (%)
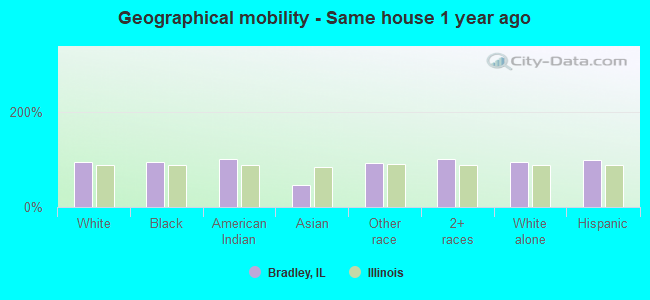
Geographical mobility - Same house 1 year ago (%)
Geographical mobility - Same house 1 year ago (%) - White
Geographical mobility - Same house 1 year ago (%) - Black or African American
Geographical mobility - Same house 1 year ago (%) - Asian
Geographical mobility - Same house 1 year ago (%) - Hispanic or Latino
Geographical mobility - Same house 1 year ago (%) - American Indian and Alaska Native
Geographical mobility - Same house 1 year ago (%) - Multirace
Geographical mobility - Same house 1 year ago (%) - Other Race
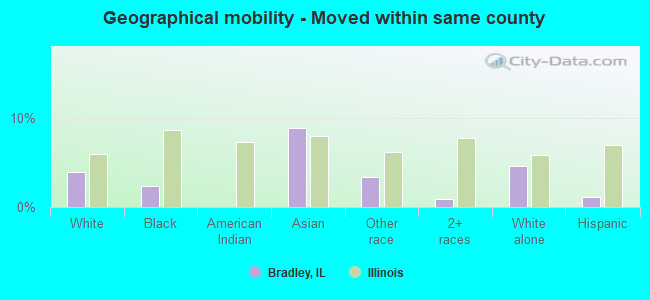
Geographical mobility - Moved within same county (%)
Geographical mobility - Moved within same county (%) - White
Geographical mobility - Moved within same county (%) - Black or African American
Geographical mobility - Moved within same county (%) - Asian
Geographical mobility - Moved within same county (%) - Hispanic or Latino
Geographical mobility - Moved within same county (%) - American Indian and Alaska Native
Geographical mobility - Moved within same county (%) - Multirace
Geographical mobility - Moved within same county (%) - Other Race
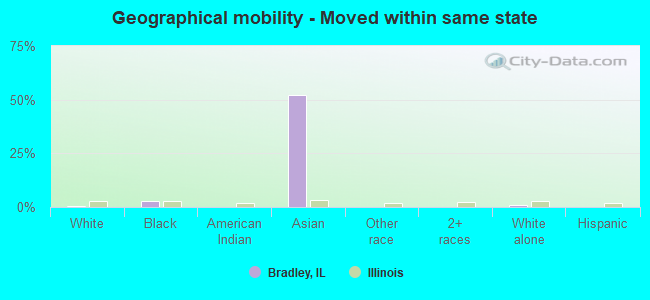
Geographical mobility - Moved from different county within same state (%)
Geographical mobility - Moved from different county within same state (%) - White
Geographical mobility - Moved from different county within same state (%) - Black or African American
Geographical mobility - Moved from different county within same state (%) - Asian
Geographical mobility - Moved from different county within same state (%) - Hispanic or Latino
Geographical mobility - Moved from different county within same state (%) - American Indian and Alaska Native
Geographical mobility - Moved from different county within same state (%) - Multirace
Geographical mobility - Moved from different county within same state (%) - Other Race
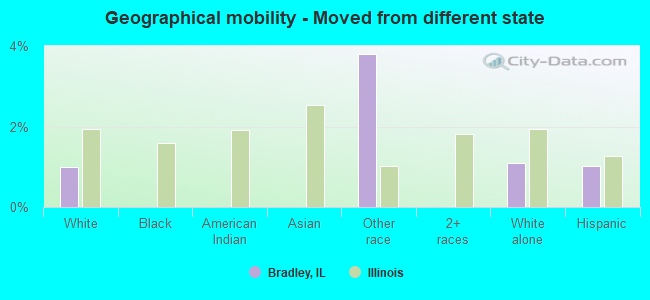
Geographical mobility - Moved from different state (%)
Geographical mobility - Moved from different state (%) - White
Geographical mobility - Moved from different state (%) - Black or African American
Geographical mobility - Moved from different state (%) - Asian
Geographical mobility - Moved from different state (%) - Hispanic or Latino
Geographical mobility - Moved from different state (%) - American Indian and Alaska Native
Geographical mobility - Moved from different state (%) - Multirace
Geographical mobility - Moved from different state (%) - Other Race
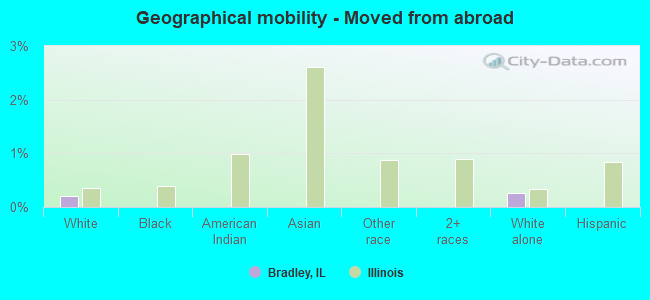
Geographical mobility - Moved from abroad (%)
Geographical mobility - Moved from abroad (%) - White
Geographical mobility - Moved from abroad (%) - Black or African American
Geographical mobility - Moved from abroad (%) - Asian
Geographical mobility - Moved from abroad (%) - Hispanic or Latino
Geographical mobility - Moved from abroad (%) - American Indian and Alaska Native
Geographical mobility - Moved from abroad (%) - Multirace
Geographical mobility - Moved from abroad (%) - Other Race
Place of birth for the foreign-born population - Ireland (%)
Place of birth for the foreign-born population - Denmark (%)
Place of birth for the foreign-born population - Norway (%)
Place of birth for the foreign-born population - Sweden (%)
Place of birth for the foreign-born population - United Kingdom (%)
Place of birth for the foreign-born population - England (%)
Place of birth for the foreign-born population - Scotland (%)
Place of birth for the foreign-born population - Other Northern Europe (%)
Place of birth for the foreign-born population - Austria (%)
Place of birth for the foreign-born population - Belgium (%)
Place of birth for the foreign-born population - France (%)
Place of birth for the foreign-born population - Germany (%)
Place of birth for the foreign-born population - Netherlands (%)
Place of birth for the foreign-born population - Switzerland (%)
Place of birth for the foreign-born population - Other Western Europe (%)
Place of birth for the foreign-born population - Greece (%)
Place of birth for the foreign-born population - Italy (%)
Place of birth for the foreign-born population - Portugal (%)
Place of birth for the foreign-born population - Spain (%)
Place of birth for the foreign-born population - Other Southern Europe (%)
Place of birth for the foreign-born population - Albania (%)
Place of birth for the foreign-born population - Belarus (%)
Place of birth for the foreign-born population - Bosnia and Herzegovina (%)
Place of birth for the foreign-born population - Bulgaria (%)
Place of birth for the foreign-born population - Croatia (%)
Place of birth for the foreign-born population - Czechoslovakia (%)
Place of birth for the foreign-born population - Hungary (%)
Place of birth for the foreign-born population - Latvia (%)
Place of birth for the foreign-born population - Lithuania (%)
Place of birth for the foreign-born population - North Macedonia (Macedonia) (%)
Place of birth for the foreign-born population - Moldova (%)
Place of birth for the foreign-born population - Poland (%)
Place of birth for the foreign-born population - Romania (%)
Place of birth for the foreign-born population - Russia (%)
Place of birth for the foreign-born population - Serbia (%)
Place of birth for the foreign-born population - Ukraine (%)
Place of birth for the foreign-born population - Other Eastern Europe (%)
Place of birth for the foreign-born population - China (%)
Place of birth for the foreign-born population - Hong Kong (%)
Place of birth for the foreign-born population - Taiwan (%)
Place of birth for the foreign-born population - Japan (%)
Place of birth for the foreign-born population - Korea (%)
Place of birth for the foreign-born population - Other Eastern Asia (%)
Place of birth for the foreign-born population - Afghanistan (%)
Place of birth for the foreign-born population - Bangladesh (%)
Place of birth for the foreign-born population - India (%)
Place of birth for the foreign-born population - Iran (%)
Place of birth for the foreign-born population - Kazakhstan (%)
Place of birth for the foreign-born population - Nepal (%)
Place of birth for the foreign-born population - Pakistan (%)
Place of birth for the foreign-born population - Sri Lanka (%)
Place of birth for the foreign-born population - Uzbekistan (%)
Place of birth for the foreign-born population - Other South Central Asia (%)
Place of birth for the foreign-born population - Burma (%)
Place of birth for the foreign-born population - Cambodia (%)
Place of birth for the foreign-born population - Indonesia (%)
Place of birth for the foreign-born population - Laos (%)
Place of birth for the foreign-born population - Malaysia (%)
Place of birth for the foreign-born population - Philippines (%)
Place of birth for the foreign-born population - Singapore (%)
Place of birth for the foreign-born population - Thailand (%)
Place of birth for the foreign-born population - Vietnam (%)
Place of birth for the foreign-born population - Other South Eastern Asia (%)
Place of birth for the foreign-born population - Armenia (%)
Place of birth for the foreign-born population - Iraq (%)
Place of birth for the foreign-born population - Israel (%)
Place of birth for the foreign-born population - Jordan (%)
Place of birth for the foreign-born population - Kuwait (%)
Place of birth for the foreign-born population - Lebanon (%)
Place of birth for the foreign-born population - Saudi Arabia (%)
Place of birth for the foreign-born population - Syria (%)
Place of birth for the foreign-born population - Turkey (%)
Place of birth for the foreign-born population - Yemen (%)
Place of birth for the foreign-born population - Other Western Asia (%)
Place of birth for the foreign-born population - Eritrea (%)
Place of birth for the foreign-born population - Ethiopia (%)
Place of birth for the foreign-born population - Kenya (%)
Place of birth for the foreign-born population - Somalia (%)
Place of birth for the foreign-born population - Uganda (%)
Place of birth for the foreign-born population - Zimbabwe (%)
Place of birth for the foreign-born population - Other Eastern Africa (%)
Place of birth for the foreign-born population - Cameroon (%)
Place of birth for the foreign-born population - Congo (%)
Place of birth for the foreign-born population - Democratic Republic of Congo (Zaire) (%)
Place of birth for the foreign-born population - Other Middle Africa (%)
Place of birth for the foreign-born population - Egypt (%)
Place of birth for the foreign-born population - Morocco (%)
Place of birth for the foreign-born population - Sudan (%)
Place of birth for the foreign-born population - Other Northern Africa (%)
Place of birth for the foreign-born population - South Africa (%)
Place of birth for the foreign-born population - Other Southern Africa (%)
Place of birth for the foreign-born population - Cabo Verde (%)
Place of birth for the foreign-born population - Ghana (%)
Place of birth for the foreign-born population - Liberia (%)
Place of birth for the foreign-born population - Nigeria (%)
Place of birth for the foreign-born population - Senegal (%)
Place of birth for the foreign-born population - Sierra Leone (%)
Place of birth for the foreign-born population - Other Western Africa (%)
Place of birth for the foreign-born population - Australia (%)
Place of birth for the foreign-born population - New Zealand (%)
Place of birth for the foreign-born population - Fiji (%)
Place of birth for the foreign-born population - Micronesia (%)
Place of birth for the foreign-born population - Bahamas (%)
Place of birth for the foreign-born population - Barbados (%)
Place of birth for the foreign-born population - Cuba (%)
Place of birth for the foreign-born population - Dominica (%)
Place of birth for the foreign-born population - Dominican Republic (%)
Place of birth for the foreign-born population - Grenada (%)
Place of birth for the foreign-born population - Haiti (%)
Place of birth for the foreign-born population - Jamaica (%)
Place of birth for the foreign-born population - St. Vincent and the Grenadines (%)
Place of birth for the foreign-born population - Trinidad and Tobago (%)
Place of birth for the foreign-born population - West Indies (%)
Place of birth for the foreign-born population - Other Caribbean (%)
Place of birth for the foreign-born population - Belize (%)
Place of birth for the foreign-born population - Costa Rica (%)
Place of birth for the foreign-born population - El Salvador (%)
Place of birth for the foreign-born population - Guatemala (%)
Place of birth for the foreign-born population - Honduras (%)
Place of birth for the foreign-born population - Mexico (%)
Place of birth for the foreign-born population - Nicaragua (%)
Place of birth for the foreign-born population - Panama (%)
Place of birth for the foreign-born population - Other Central America (%)
Place of birth for the foreign-born population - Argentina (%)
Place of birth for the foreign-born population - Bolivia (%)
Place of birth for the foreign-born population - Brazil (%)
Place of birth for the foreign-born population - Chile (%)
Place of birth for the foreign-born population - Colombia (%)
Place of birth for the foreign-born population - Ecuador (%)
Place of birth for the foreign-born population - Guyana (%)
Place of birth for the foreign-born population - Peru (%)
Place of birth for the foreign-born population - Uruguay (%)
Place of birth for the foreign-born population - Venezuela (%)
Place of birth for the foreign-born population - Other South America (%)
Place of birth for the foreign-born population - Canada (%)
Place of birth for the foreign-born population - Other Northern America (%)
Place of birth for the foreign-born population - Other (%)
Latest news about races in Bradley, IL collected exclusively by city-data.com from local newspapers, TV, and radio stations
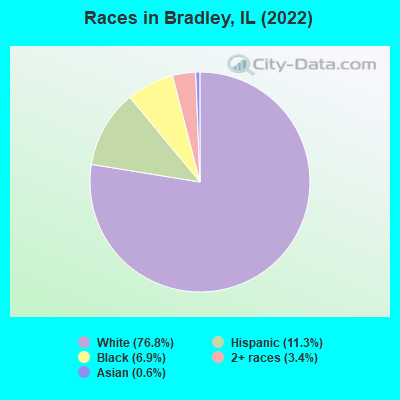
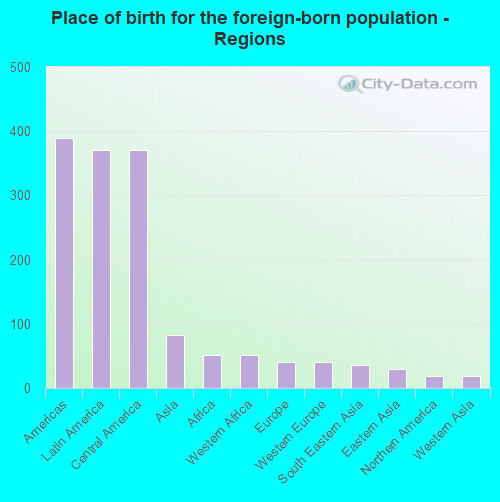
According to 2022 data, the most numerous races in Bradley, IL are White alone (11,670 residents), Hispanic (1,719 residents), and Black alone (1,044 residents). 89.6% of Bradley residents speak English at home. 3.7% of Bradley, IL residents are foreign-born (2.4% born in Latin America, 0.5% born in Asia), which is 275.6% less than the foreign-born rate of 14.0% across the entire state of Illinois.
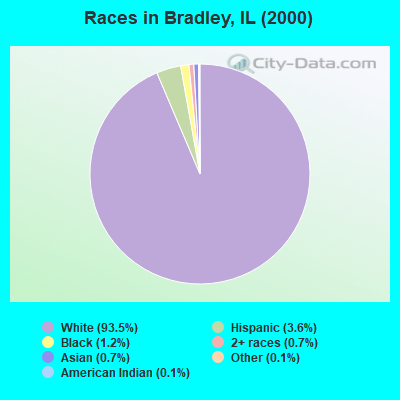
Race distribution in Bradley
2000 2022
8,424,140 67.8% White alone 1,856,152 14.9% Black alone 1,530,262 12.3% Hispanic 419,916 3.4% Asian alone 153,996 1.2% Two or more races 13,479 0.1% Other race alone 18,232 0.1% American Indian alone 3,116 0.03% Native Hawaiian and Other
7,356,301 58.5% White alone 2,299,726 18.3% Hispanic 1,660,423 13.2% Black alone 747,296 5.9% Asian alone 458,599 3.6% Two or more races 45,386 0.4% Other race alone 10,405 0.08% American Indian alone 3,896 0.03% Native Hawaiian and Other
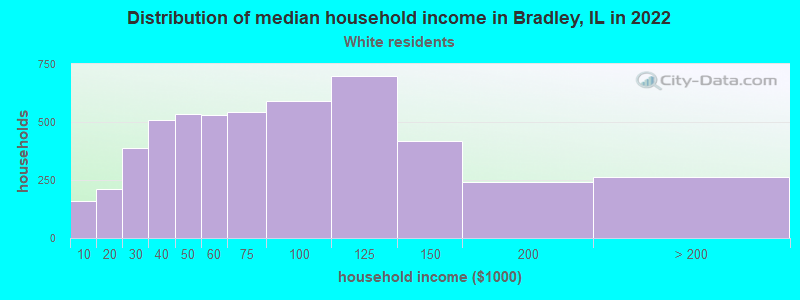
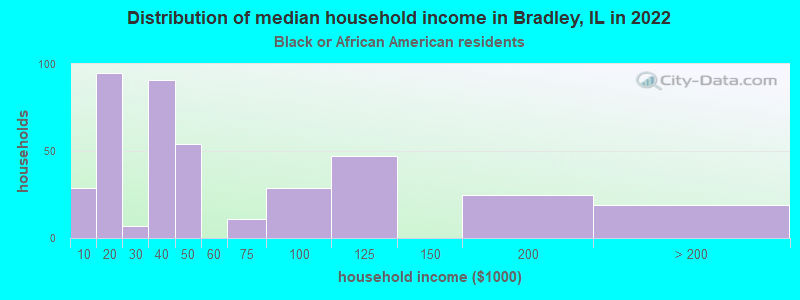
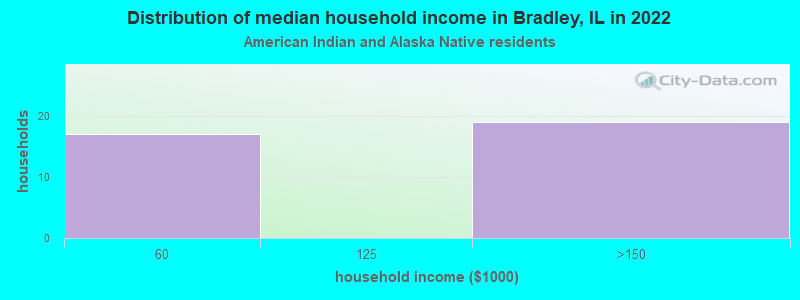
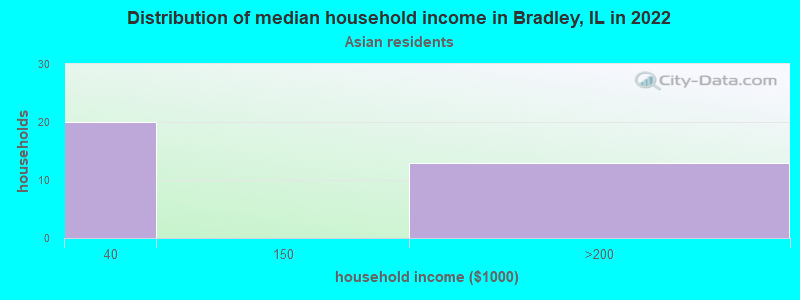
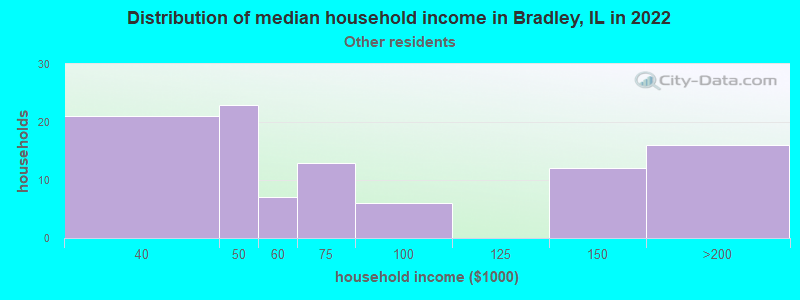
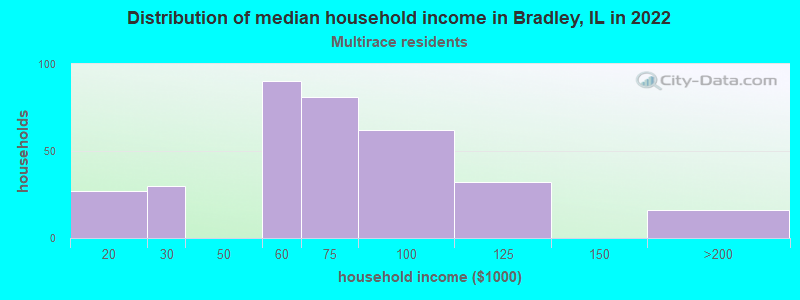
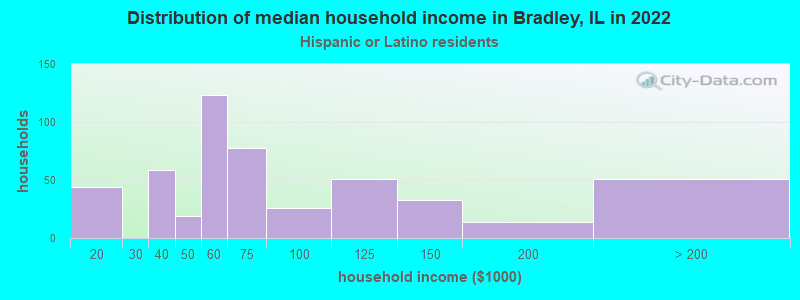
Income and house value in Bradley Median household income in 2022 $66,313 White non-Hispanic householders$28,406 Black householders$142,122 Some other race householders$62,650 Two or more races householders$70,371 Hispanic or Latino race householdersMedian 2022 house value $173,866 White Non-Hispanic householders$213,304 Black or African American householders$131,585 American Indian or Alaska Native householders $334,272 Asian householders$242,882 Some other race householders$146,943 Two or more races householders$145,236 Hispanic or Latino householders
Median age by race in Bradley
38.9 Median age for White residents34.1 41.5 34.3 Median age for Black or African American residents41.7 30.2 16.0 Median age for American Indian / Alaska Native residents-1,149,911,815.4 14.8 14.0 Median age for Asian residents14.8 -656,521,738.5 -666,666,666.0 Median age for Native Hawaiian / Pacific Islander residents-666,666,666.0 -666,666,666.0 37.5 Median age for Other race residents49.5 21.3 23.2 Median age for Two or more races residents21.2 22.7 40.5 Median age for White alone residents36.2 42.8 25.8 Median age for Hispanic or Latino residents28.5 25.5
Owner/renter occupied households by race in Bradley
House owners and renters - White residents 3,609 70.2% Owner occupied1,530 29.8% Renter occupiedHouse owners and renters - Black or African American residents 62 16.1% Owner occupied324 83.9% Renter occupiedHouse owners and renters - American Indian / Alaska Native residents 36 100.0% Owner occupiedHouse owners and renters - Asian residents 26 100.0% Renter occupiedHouse owners and renters - Other race residents 62 85.3% Owner occupied11 14.7% Renter occupiedHouse owners and renters - Two or more races residents 185 62.7% Owner occupied110 37.3% Renter occupiedHouse owners and renters - White alone residents 3,466 70.1% Owner occupied1,477 29.9% Renter occupiedHouse owners and renters - Hispanic or Latino residents 296 69.1% Owner occupied133 30.9% Renter occupied
Language usage in Bradley
English speakers - Total 89.6% of residents of Bradley speak English at home.
9.8% of residents speak Spanish at home 1,283 92.8% Speak English very well100 7.2% Speak English less than very well0.8% of residents speak other language at home 106 91.4% Speak English very well10 8.6% Speak English less than very well
English speakers - Born in the United States 86.8% of residents of Bradley speak English at home.
12.8% of residents speak Spanish at home 263 100.0% Speak English very well1.5% of residents speak other language at home 31 100.0% Speak English very well
All residents speak only English at home
English speakers - Foreign-born 14.7% of residents of Bradley speak English at home.
76.7% of residents speak Spanish at home 296 73.8% Speak English very well105 26.2% Speak English less than very well18.9% of residents speak other language at home 91 91.9% Speak English very well8 8.1% Speak English less than very well
White (Caucasian) - Speak only English Native:
94.4% (10,948)Foreign-born:
11.3% (20)
White (Caucasian) - Speak another language Native:
5.6% (648)Foreign-born:
87.0% (154)
Black or African American - Speak another language Native:
2.8% (21)Foreign-born:
95.1% (62)
American Indian / Alaska Native - Speak only English Native:
86.6% (43)Foreign-born:
71.3% (13)
Asian - Speak only English Native:
68.8% (13)Foreign-born:
98.7% (48)
Other race - Speak another language Native:
77.1% (174)Foreign-born:
98.9% (184)
Two or more races - Speak another language Native:
14.6% (145)Foreign-born:
100.0% (62)
White alone - Speak only English Native:
97.3% (10,861)Foreign-born:
64.0% (37)
White alone - Speak another language Native:
2.7% (299)Foreign-born:
31.6% (18)
Hispanic or Latino - Speak only English Native:
44.4% (544)Foreign-born:
1.5% (5)
Hispanic or Latino - Speak another language Native:
56.1% (688)Foreign-born:
99.6% (351)
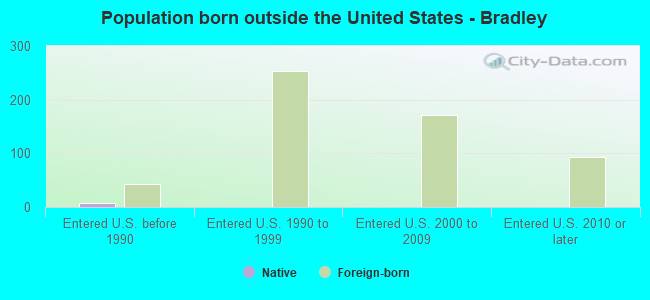
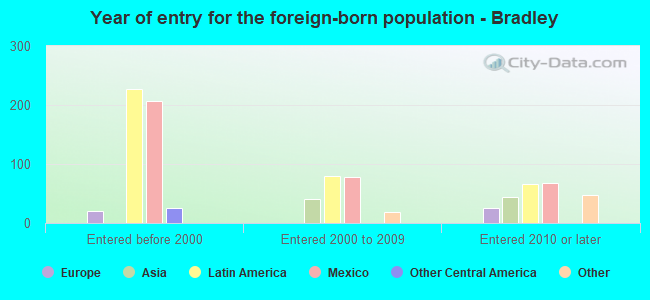
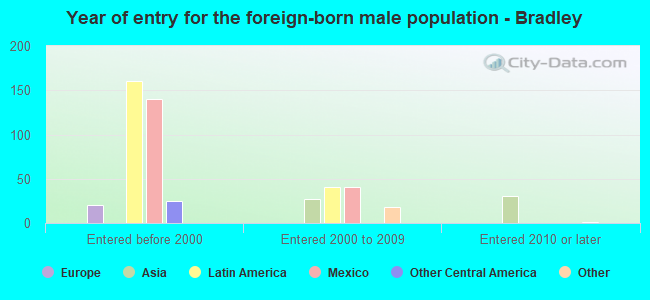
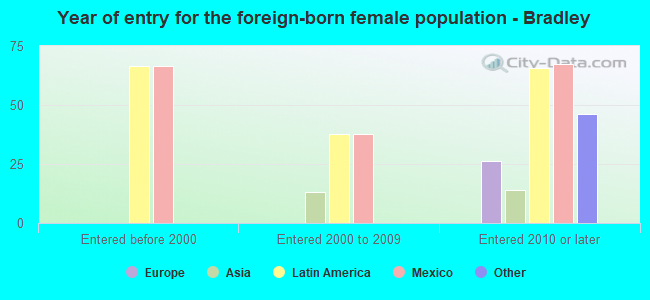
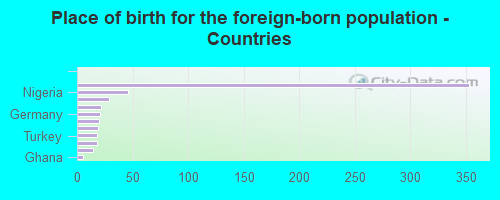
Foreign-born residents in Bradley 566 residents are foreign born (2.4% Latin America , 0.5% Asia ).
This city:
3.7%Illinois:
14.1%
Marital status for residents in Bradley Marital status - White (Caucasian) population 15 years and over
Males 43.8% Never married41.0% Now married0.6% Separated3.8% Widowed10.7% DivorcedFemales 32.6% Never married42.6% Now married0.6% Separated7.9% Widowed16.3% DivorcedWomen who gave birth in the past 12 months Now married:
37.4% (45)Unmarried:
62.6% (76)
Women who did not give birth in the past 12 months Now married:
37.5% (1,138)Unmarried:
62.5% (1,898)
Marital status - Black or African American population 15 years and over
Males 29.6% Never married52.8% Now married0.0% Separated0.0% Widowed17.7% DivorcedFemales 47.1% Never married37.7% Now married0.0% Separated7.5% Widowed7.7% DivorcedWomen who gave birth in the past 12 months Now married:
0.0% (0)Unmarried:
100.0% (54)
Women who did not give birth in the past 12 months Now married:
44.8% (111)Unmarried:
55.2% (136)
Marital status - American Indian / Alaska Native population 15 years and over
Males 0.0% Never married47.6% Now married0.0% Separated0.0% Widowed52.4% DivorcedFemales 100.0% Never married0.0% Now married0.0% Separated0.0% Widowed0.0% DivorcedWomen who did not give birth in the past 12 months Now married:
0.0% (0)Unmarried:
100.0% (22)
Marital status - Asian population 15 years and over
Males 0.0% Never married100.0% Now married0.0% Separated0.0% Widowed0.0% DivorcedFemales 0.0% Never married48.1% Now married0.0% Separated0.0% Widowed51.9% DivorcedWomen who did not give birth in the past 12 months Now married:
48.1% (13)Unmarried:
51.9% (14)
Marital status - Other race population 15 years and over
Males 33.0% Never married54.1% Now married2.9% Separated10.0% Widowed0.0% DivorcedFemales 47.9% Never married52.1% Now married0.0% Separated0.0% Widowed0.0% DivorcedWomen who did not give birth in the past 12 months Now married:
44.6% (43)Unmarried:
55.4% (53)
Marital status - Two or more races population 15 years and over
Males 53.0% Never married36.4% Now married0.0% Separated0.0% Widowed10.7% DivorcedFemales 44.5% Never married43.4% Now married0.0% Separated4.6% Widowed7.5% DivorcedWomen who gave birth in the past 12 months Now married:
0.0% (0)Unmarried:
100.0% (51)
Women who did not give birth in the past 12 months Now married:
53.1% (211)Unmarried:
46.9% (186)
Marital status - White alone, not Hispanic / Latino population 15 years and over
Males 42.6% Never married41.4% Now married0.7% Separated4.0% Widowed11.3% DivorcedFemales 32.2% Never married42.3% Now married0.7% Separated8.2% Widowed16.6% DivorcedWomen who gave birth in the past 12 months Now married:
37.4% (44)Unmarried:
62.6% (74)
Women who did not give birth in the past 12 months Now married:
37.1% (1,031)Unmarried:
62.9% (1,750)
Marital status - Hispanic or Latino population 15 years and over
Males 48.0% Never married46.5% Now married0.9% Separated3.1% Widowed1.6% DivorcedFemales 43.9% Never married52.4% Now married0.0% Separated0.0% Widowed3.7% DivorcedWomen who gave birth in the past 12 months Now married:
0.0% (0)Unmarried:
100.0% (31)
Women who did not give birth in the past 12 months Now married:
52.1% (249)Unmarried:
47.9% (229)
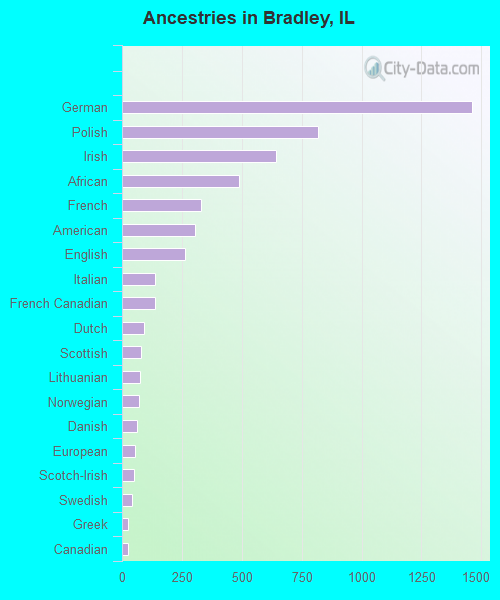
Ancestries in Bradley
1,459 19.2% German818 10.8% Polish641 8.4% Irish490 6.4% African331 4.4% French303 4.0% American265 3.5% English139 1.8% Italian137 1.8% French Canadian93 1.2% Dutch78 1.0% Scottish75 1.0% Lithuanian69 0.9% Norwegian64 0.8% Danish53 0.7% European51 0.7% Scotch-Irish41 0.5% Swedish24 0.3% Greek23 0.3% Canadian7 0.09% Czech6 0.08% Belgian5 0.07% Slovak5 0.07% Ghanaian1 0.01% Kenyan
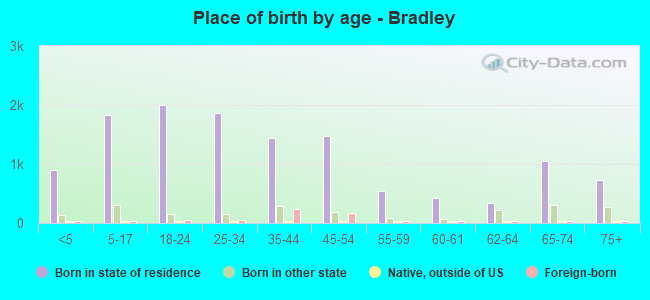
Children Nativity (place of birth) in Bradley
Children under 6 years - Living with two parents Both parents native 484 100.0% NativeBoth parents foreign-born 57 100.0% NativeOne native, one foreign-born parent 24 100.0% NativeChildren under 6 years - Living with one parent Native parent 495 100.0% NativeForeign-born parent 28 100.0% NativeChildren 6 to 17 years - Living with two parents Both parents native 931 96.8% Native30 3.2% Foreign-bornBoth parents foreign-born 60 100.0% NativeOne native, one foreign-born parent 131 100.0% NativeChildren 6 to 17 years - Living with one parent Native parent 667 100.0% NativeForeign-born parent 113 57.4% Native84 42.6% Foreign-born
Grandparents responsible for own grandchildren in Bradley
Grandparents (30 to 59 years) White / Caucasian 32 61.3% Responsible for grandchildren20 38.7% Not responsible for grandchildrenBlack or African American 35 100.0% Not responsible for grandchildrenOther race 39 100.0% Not responsible for grandchildrenWhite alone, not Hispanic / Latino 40 64.1% Responsible for grandchildren22 35.9% Not responsible for grandchildrenHispanic or Latino 34 100.0% Not responsible for grandchildrenGrandparents (60 years and over) White / Caucasian 21 15.5% Responsible for grandchildren116 84.5% Not responsible for grandchildrenWhite alone, not Hispanic / Latino 22 14.8% Responsible for grandchildren128 85.2% Not responsible for grandchildren