Races in Bowleys Quarters, Maryland (MD) Detailed Stats
Data:
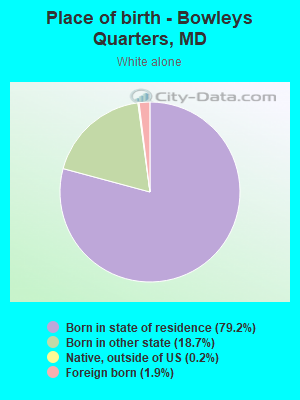
Races - White alone (%)
Races - White alone (% change since 2000)
Races - Black alone (%)
Races - Black alone (% change since 2000)
Races - American Indian alone (%)
Races - American Indian alone (% change since 2000)
Races - Asian alone (%)
Races - Asian alone (% change since 2000)
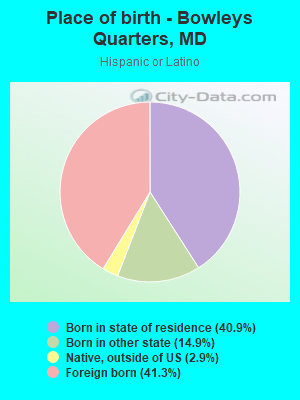
Races - Hispanic (%)
Races - Hispanic (% change since 2000)
Races - Native Hawaiian and Other Pacific Islander alone (%)
Races - Native Hawaiian and Other Pacific Islander alone (% change since 2000)
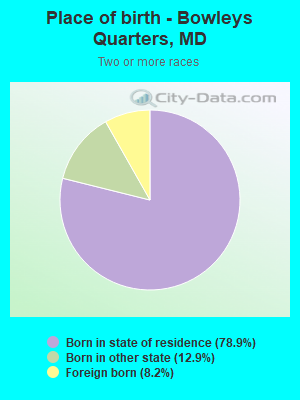
Races - Two or more races(%)
Races - Two or more races(% change since 2000)
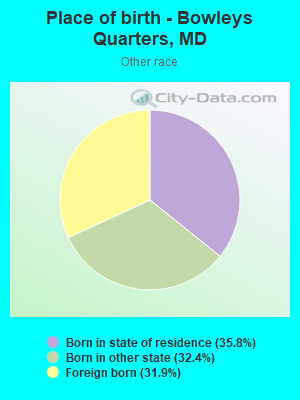
Races - Other race alone (%)
Races - Other race alone (% change since 2000)
Racial diversity
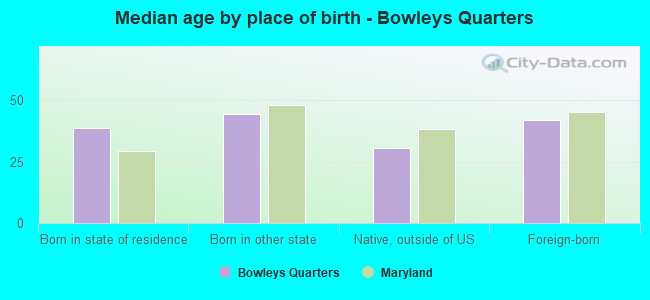
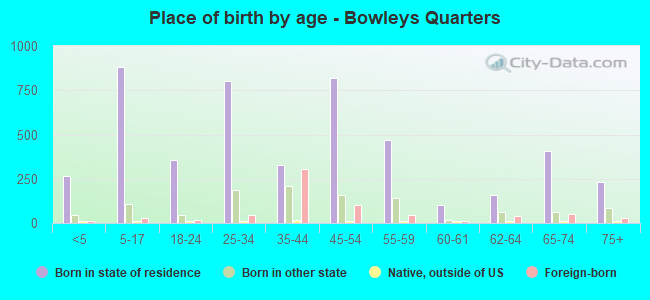
Place of birth - Born in state of residence (%)
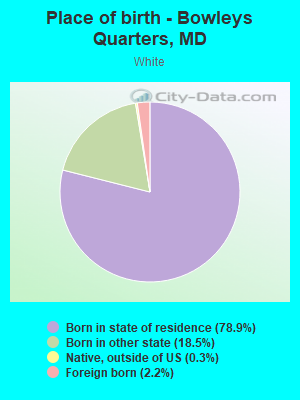
Place of birth - Born in state of residence (%) - White
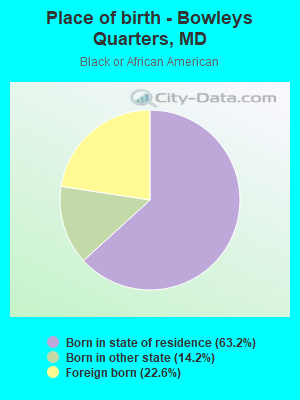
Place of birth - Born in state of residence (%) - Black or African American
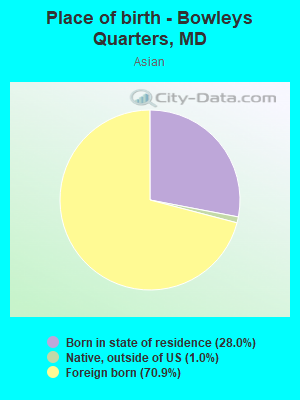
Place of birth - Born in state of residence (%) - Asian
Place of birth - Born in state of residence (%) - Hispanic or Latino
Place of birth - Born in state of residence (%) - American Indian and Alaska Native
Place of birth - Born in state of residence (%) - Multirace
Place of birth - Born in state of residence (%) - Other Race
Place of birth - Born in other state (%)
Place of birth - Born in other state (%) - White
Place of birth - Born in other state (%) - Black or African American
Place of birth - Born in other state (%) - Asian
Place of birth - Born in other state (%) - Hispanic or Latino
Place of birth - Born in other state (%) - American Indian and Alaska Native
Place of birth - Born in other state (%) - Multirace
Place of birth - Born in other state (%) - Other Race
Place of birth - Native, outside of US (%)
Place of birth - Native, outside of US (%) - White
Place of birth - Native, outside of US (%) - Black or African American
Place of birth - Native, outside of US (%) - Asian
Place of birth - Native, outside of US (%) - Hispanic or Latino
Place of birth - Native, outside of US (%) - American Indian and Alaska Native
Place of birth - Native, outside of US (%) - Multirace
Place of birth - Native, outside of US (%) - Other Race
Place of birth - Foreign born (%)
Place of birth - Foreign born (%) - White
Place of birth - Foreign born (%) - Black or African American
Place of birth - Foreign born (%) - Asian
Place of birth - Foreign born (%) - Hispanic or Latino
Place of birth - Foreign born (%) - American Indian and Alaska Native
Place of birth - Foreign born (%) - Multirace
Place of birth - Foreign born (%) - Other Race
Residents speaking English at home (%)
Residents speaking English at home - Born in the United States (%)
Residents speaking English at home - Native, born elsewhere (%)
Residents speaking English at home - Foreign born (%)
Residents speaking Spanish at home (%)
Residents speaking Spanish at home - Born in the United States (%)
Residents speaking Spanish at home - Native, born elsewhere (%)
Residents speaking Spanish at home - Foreign born (%)
Residents speaking other language at home (%)
Residents speaking other language at home - Born in the United States (%)
Residents speaking other language at home - Native, born elsewhere (%)
Residents speaking other language at home - Foreign born (%)
Marital status - Never married (%)
Marital status - Now married (%)
Marital status - Separated (%)
Marital status - Widowed (%)
Marital status - Divorced (%)
Ancestries Reported - Arab (%)
Ancestries Reported - Czech (%)
Ancestries Reported - Danish (%)
Ancestries Reported - Dutch (%)
Ancestries Reported - English (%)
Ancestries Reported - French (%)
Ancestries Reported - French Canadian (%)
Ancestries Reported - German (%)
Ancestries Reported - Greek (%)
Ancestries Reported - Hungarian (%)
Ancestries Reported - Irish (%)
Ancestries Reported - Italian (%)
Ancestries Reported - Lithuanian (%)
Ancestries Reported - Norwegian (%)
Ancestries Reported - Polish (%)
Ancestries Reported - Portuguese (%)
Ancestries Reported - Russian (%)
Ancestries Reported - Scotch-Irish (%)
Ancestries Reported - Scottish (%)
Ancestries Reported - Slovak (%)
Ancestries Reported - Subsaharan African (%)
Ancestries Reported - Swedish (%)
Ancestries Reported - Swiss (%)
Ancestries Reported - Ukrainian (%)
Ancestries Reported - United States (%)
Ancestries Reported - Welsh (%)
Ancestries Reported - West Indian (%)
Ancestries Reported - Other (%)
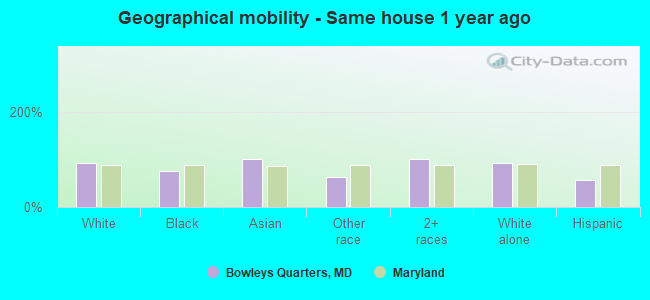
Geographical mobility - Same house 1 year ago (%)
Geographical mobility - Same house 1 year ago (%) - White
Geographical mobility - Same house 1 year ago (%) - Black or African American
Geographical mobility - Same house 1 year ago (%) - Asian
Geographical mobility - Same house 1 year ago (%) - Hispanic or Latino
Geographical mobility - Same house 1 year ago (%) - American Indian and Alaska Native
Geographical mobility - Same house 1 year ago (%) - Multirace
Geographical mobility - Same house 1 year ago (%) - Other Race
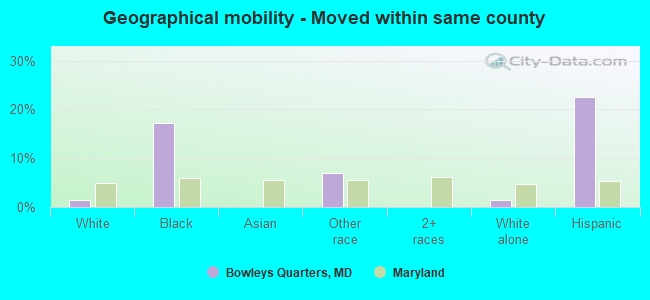
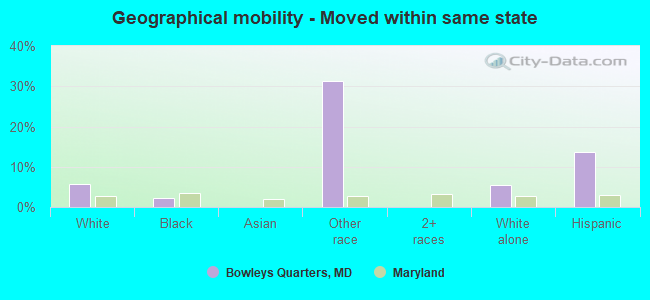
Geographical mobility - Moved within same county (%)
Geographical mobility - Moved within same county (%) - White
Geographical mobility - Moved within same county (%) - Black or African American
Geographical mobility - Moved within same county (%) - Asian
Geographical mobility - Moved within same county (%) - Hispanic or Latino
Geographical mobility - Moved within same county (%) - American Indian and Alaska Native
Geographical mobility - Moved within same county (%) - Multirace
Geographical mobility - Moved within same county (%) - Other Race
Geographical mobility - Moved from different county within same state (%)
Geographical mobility - Moved from different county within same state (%) - White
Geographical mobility - Moved from different county within same state (%) - Black or African American
Geographical mobility - Moved from different county within same state (%) - Asian
Geographical mobility - Moved from different county within same state (%) - Hispanic or Latino
Geographical mobility - Moved from different county within same state (%) - American Indian and Alaska Native
Geographical mobility - Moved from different county within same state (%) - Multirace
Geographical mobility - Moved from different county within same state (%) - Other Race
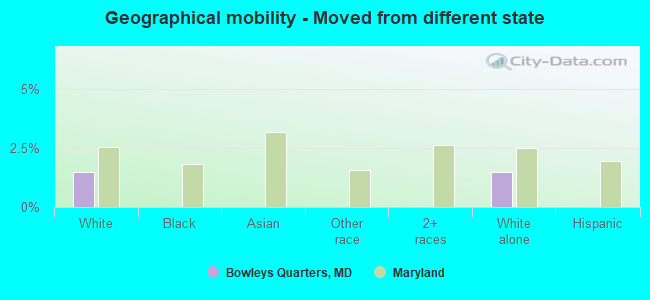
Geographical mobility - Moved from different state (%)
Geographical mobility - Moved from different state (%) - White
Geographical mobility - Moved from different state (%) - Black or African American
Geographical mobility - Moved from different state (%) - Asian
Geographical mobility - Moved from different state (%) - Hispanic or Latino
Geographical mobility - Moved from different state (%) - American Indian and Alaska Native
Geographical mobility - Moved from different state (%) - Multirace
Geographical mobility - Moved from different state (%) - Other Race
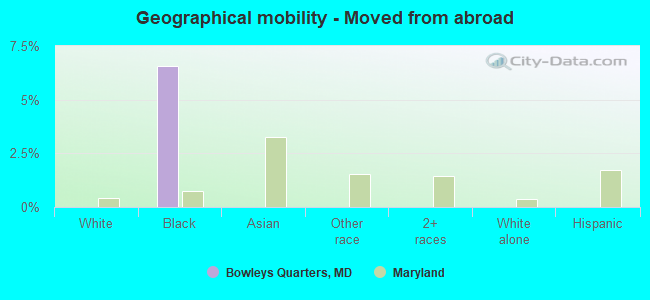
Geographical mobility - Moved from abroad (%)
Geographical mobility - Moved from abroad (%) - White
Geographical mobility - Moved from abroad (%) - Black or African American
Geographical mobility - Moved from abroad (%) - Asian
Geographical mobility - Moved from abroad (%) - Hispanic or Latino
Geographical mobility - Moved from abroad (%) - American Indian and Alaska Native
Geographical mobility - Moved from abroad (%) - Multirace
Geographical mobility - Moved from abroad (%) - Other Race
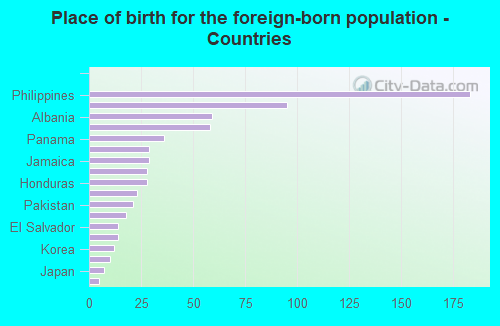
Place of birth for the foreign-born population - Ireland (%)
Place of birth for the foreign-born population - Denmark (%)
Place of birth for the foreign-born population - Norway (%)
Place of birth for the foreign-born population - Sweden (%)
Place of birth for the foreign-born population - United Kingdom (%)
Place of birth for the foreign-born population - England (%)
Place of birth for the foreign-born population - Scotland (%)
Place of birth for the foreign-born population - Other Northern Europe (%)
Place of birth for the foreign-born population - Austria (%)
Place of birth for the foreign-born population - Belgium (%)
Place of birth for the foreign-born population - France (%)
Place of birth for the foreign-born population - Germany (%)
Place of birth for the foreign-born population - Netherlands (%)
Place of birth for the foreign-born population - Switzerland (%)
Place of birth for the foreign-born population - Other Western Europe (%)
Place of birth for the foreign-born population - Greece (%)
Place of birth for the foreign-born population - Italy (%)
Place of birth for the foreign-born population - Portugal (%)
Place of birth for the foreign-born population - Spain (%)
Place of birth for the foreign-born population - Other Southern Europe (%)
Place of birth for the foreign-born population - Albania (%)
Place of birth for the foreign-born population - Belarus (%)
Place of birth for the foreign-born population - Bosnia and Herzegovina (%)
Place of birth for the foreign-born population - Bulgaria (%)
Place of birth for the foreign-born population - Croatia (%)
Place of birth for the foreign-born population - Czechoslovakia (%)
Place of birth for the foreign-born population - Hungary (%)
Place of birth for the foreign-born population - Latvia (%)
Place of birth for the foreign-born population - Lithuania (%)
Place of birth for the foreign-born population - North Macedonia (Macedonia) (%)
Place of birth for the foreign-born population - Moldova (%)
Place of birth for the foreign-born population - Poland (%)
Place of birth for the foreign-born population - Romania (%)
Place of birth for the foreign-born population - Russia (%)
Place of birth for the foreign-born population - Serbia (%)
Place of birth for the foreign-born population - Ukraine (%)
Place of birth for the foreign-born population - Other Eastern Europe (%)
Place of birth for the foreign-born population - China (%)
Place of birth for the foreign-born population - Hong Kong (%)
Place of birth for the foreign-born population - Taiwan (%)
Place of birth for the foreign-born population - Japan (%)
Place of birth for the foreign-born population - Korea (%)
Place of birth for the foreign-born population - Other Eastern Asia (%)
Place of birth for the foreign-born population - Afghanistan (%)
Place of birth for the foreign-born population - Bangladesh (%)
Place of birth for the foreign-born population - India (%)
Place of birth for the foreign-born population - Iran (%)
Place of birth for the foreign-born population - Kazakhstan (%)
Place of birth for the foreign-born population - Nepal (%)
Place of birth for the foreign-born population - Pakistan (%)
Place of birth for the foreign-born population - Sri Lanka (%)
Place of birth for the foreign-born population - Uzbekistan (%)
Place of birth for the foreign-born population - Other South Central Asia (%)
Place of birth for the foreign-born population - Burma (%)
Place of birth for the foreign-born population - Cambodia (%)
Place of birth for the foreign-born population - Indonesia (%)
Place of birth for the foreign-born population - Laos (%)
Place of birth for the foreign-born population - Malaysia (%)
Place of birth for the foreign-born population - Philippines (%)
Place of birth for the foreign-born population - Singapore (%)
Place of birth for the foreign-born population - Thailand (%)
Place of birth for the foreign-born population - Vietnam (%)
Place of birth for the foreign-born population - Other South Eastern Asia (%)
Place of birth for the foreign-born population - Armenia (%)
Place of birth for the foreign-born population - Iraq (%)
Place of birth for the foreign-born population - Israel (%)
Place of birth for the foreign-born population - Jordan (%)
Place of birth for the foreign-born population - Kuwait (%)
Place of birth for the foreign-born population - Lebanon (%)
Place of birth for the foreign-born population - Saudi Arabia (%)
Place of birth for the foreign-born population - Syria (%)
Place of birth for the foreign-born population - Turkey (%)
Place of birth for the foreign-born population - Yemen (%)
Place of birth for the foreign-born population - Other Western Asia (%)
Place of birth for the foreign-born population - Eritrea (%)
Place of birth for the foreign-born population - Ethiopia (%)
Place of birth for the foreign-born population - Kenya (%)
Place of birth for the foreign-born population - Somalia (%)
Place of birth for the foreign-born population - Uganda (%)
Place of birth for the foreign-born population - Zimbabwe (%)
Place of birth for the foreign-born population - Other Eastern Africa (%)
Place of birth for the foreign-born population - Cameroon (%)
Place of birth for the foreign-born population - Congo (%)
Place of birth for the foreign-born population - Democratic Republic of Congo (Zaire) (%)
Place of birth for the foreign-born population - Other Middle Africa (%)
Place of birth for the foreign-born population - Egypt (%)
Place of birth for the foreign-born population - Morocco (%)
Place of birth for the foreign-born population - Sudan (%)
Place of birth for the foreign-born population - Other Northern Africa (%)
Place of birth for the foreign-born population - South Africa (%)
Place of birth for the foreign-born population - Other Southern Africa (%)
Place of birth for the foreign-born population - Cabo Verde (%)
Place of birth for the foreign-born population - Ghana (%)
Place of birth for the foreign-born population - Liberia (%)
Place of birth for the foreign-born population - Nigeria (%)
Place of birth for the foreign-born population - Senegal (%)
Place of birth for the foreign-born population - Sierra Leone (%)
Place of birth for the foreign-born population - Other Western Africa (%)
Place of birth for the foreign-born population - Australia (%)
Place of birth for the foreign-born population - New Zealand (%)
Place of birth for the foreign-born population - Fiji (%)
Place of birth for the foreign-born population - Micronesia (%)
Place of birth for the foreign-born population - Bahamas (%)
Place of birth for the foreign-born population - Barbados (%)
Place of birth for the foreign-born population - Cuba (%)
Place of birth for the foreign-born population - Dominica (%)
Place of birth for the foreign-born population - Dominican Republic (%)
Place of birth for the foreign-born population - Grenada (%)
Place of birth for the foreign-born population - Haiti (%)
Place of birth for the foreign-born population - Jamaica (%)
Place of birth for the foreign-born population - St. Vincent and the Grenadines (%)
Place of birth for the foreign-born population - Trinidad and Tobago (%)
Place of birth for the foreign-born population - West Indies (%)
Place of birth for the foreign-born population - Other Caribbean (%)
Place of birth for the foreign-born population - Belize (%)
Place of birth for the foreign-born population - Costa Rica (%)
Place of birth for the foreign-born population - El Salvador (%)
Place of birth for the foreign-born population - Guatemala (%)
Place of birth for the foreign-born population - Honduras (%)
Place of birth for the foreign-born population - Mexico (%)
Place of birth for the foreign-born population - Nicaragua (%)
Place of birth for the foreign-born population - Panama (%)
Place of birth for the foreign-born population - Other Central America (%)
Place of birth for the foreign-born population - Argentina (%)
Place of birth for the foreign-born population - Bolivia (%)
Place of birth for the foreign-born population - Brazil (%)
Place of birth for the foreign-born population - Chile (%)
Place of birth for the foreign-born population - Colombia (%)
Place of birth for the foreign-born population - Ecuador (%)
Place of birth for the foreign-born population - Guyana (%)
Place of birth for the foreign-born population - Peru (%)
Place of birth for the foreign-born population - Uruguay (%)
Place of birth for the foreign-born population - Venezuela (%)
Place of birth for the foreign-born population - Other South America (%)
Place of birth for the foreign-born population - Canada (%)
Place of birth for the foreign-born population - Other Northern America (%)
Place of birth for the foreign-born population - Other (%)
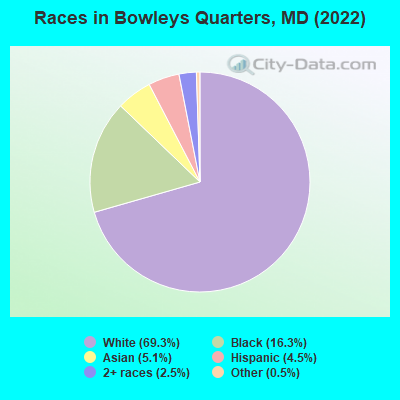
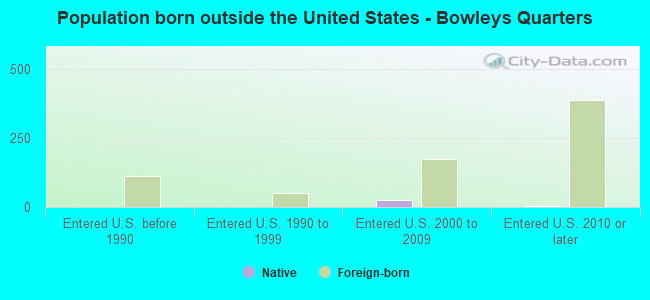
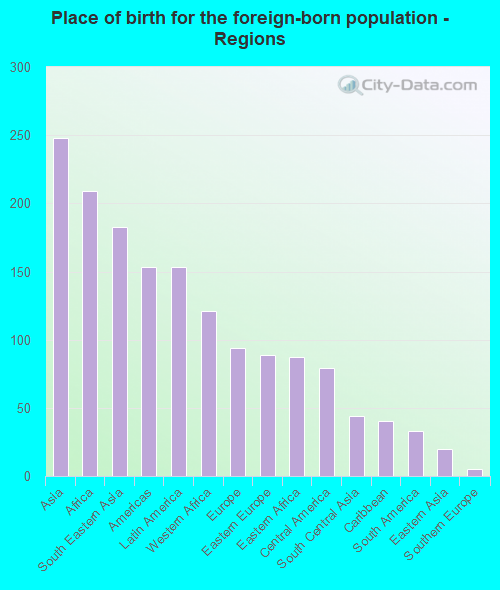
According to 2022 data, the most numerous races in Bowleys Quarters, MD are White alone (4,650 residents), Black alone (1,096 residents), and Hispanic (299 residents). 92.4% of Bowleys Quarters residents speak English at home. 10.5% of Bowleys Quarters, MD residents are foreign-born (3.4% born in Asia, 2.9% born in Africa, 2.1% born in Latin America, 1.3% born in Europe), which is 52.3% less than the foreign-born rate of 16.0% across the entire state of Maryland.
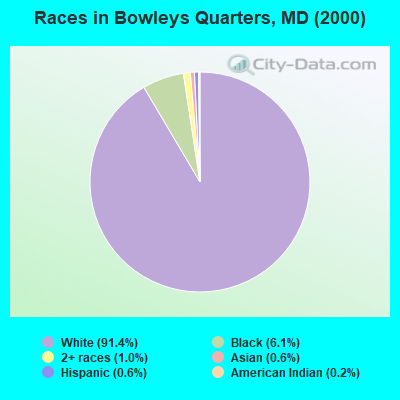
Race distribution in Bowleys Quarters
2000 2022
3,286,547 62.1% White alone 1,464,735 27.7% Black alone 227,916 4.3% Hispanic 209,738 4.0% Asian alone 82,946 1.6% Two or more races 13,312 0.3% American Indian alone 9,379 0.2% Other race alone 1,913 0.04% Native Hawaiian and Other
2,906,492 47.1% White alone 1,800,914 29.2% Black alone 705,842 11.4% Hispanic 401,818 6.5% Asian alone 291,317 4.7% Two or more races 46,930 0.8% Other race alone 8,930 0.1% American Indian alone 2,417 0.04% Native Hawaiian and Other
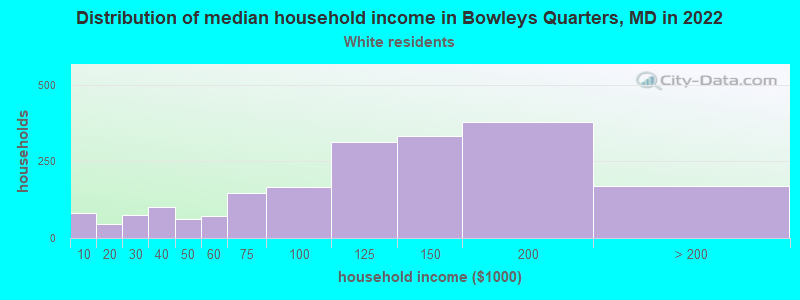
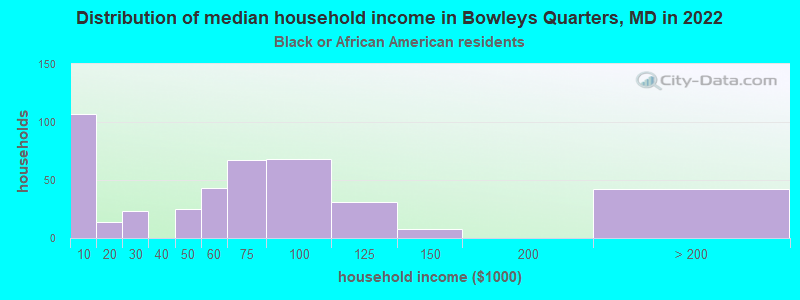
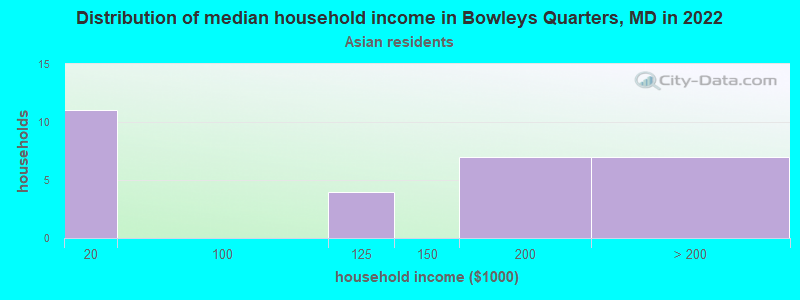
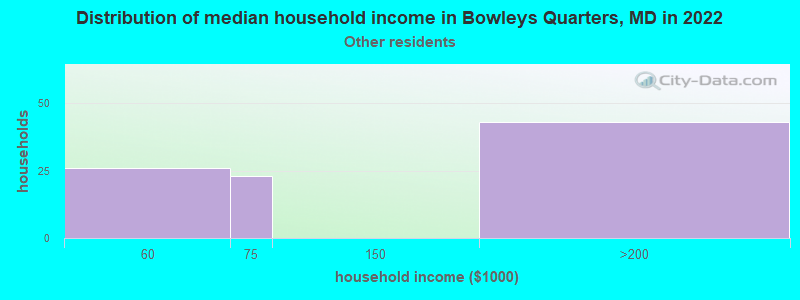
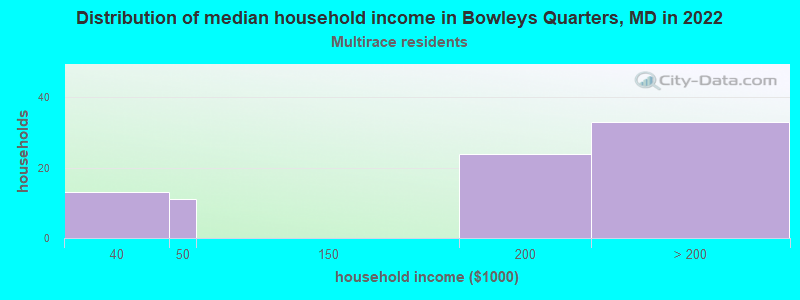
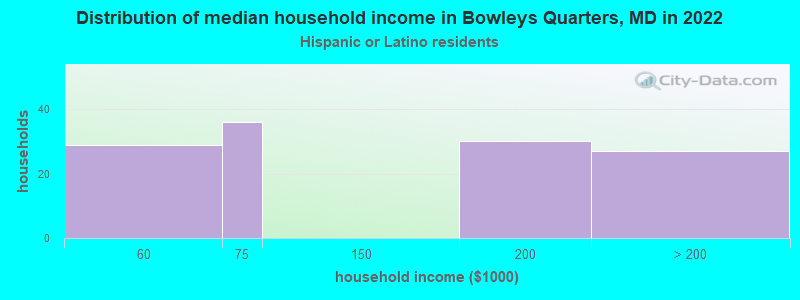
Income and house value in Bowleys Quarters Median household income in 2022 $110,699 White non-Hispanic householders$66,579 Black householdersover $200,000 Two or more races householdersMedian 2022 house value $349,268 White Non-Hispanic householders$281,069 Black or African American householders $444,546 Asian householders$300,877 Two or more races householders
Median age by race in Bowleys Quarters
48.7 Median age for White residents50.1 47.6 26.4 Median age for Black or African American residents21.1 32.0 -768,041,236.3 Median age for American Indian / Alaska Native residents-867,632,849.4 -677,419,354.2 40.5 Median age for Asian residents39.4 45.8 -1,541,125,539.6 Median age for Native Hawaiian / Pacific Islander residents-790,901,136.6 -760,942,760.2 38.7 Median age for Other race residents44.3 13.6 16.6 Median age for Two or more races residents15.6 15.0 48.4 Median age for White alone residents49.7 47.6 32.2 Median age for Hispanic or Latino residents38.9 23.7
Owner/renter occupied households by race in Bowleys Quarters
House owners and renters - White residents 1,645 84.4% Owner occupied304 15.6% Renter occupiedHouse owners and renters - Black or African American residents 244 58.2% Owner occupied175 41.8% Renter occupiedHouse owners and renters - Asian residents 38 100.0% Owner occupiedHouse owners and renters - Other race residents 93 82.3% Owner occupied20 17.7% Renter occupiedHouse owners and renters - Two or more races residents 47 64.5% Owner occupied26 35.5% Renter occupiedHouse owners and renters - White alone residents 1,641 84.2% Owner occupied307 15.8% Renter occupiedHouse owners and renters - Hispanic or Latino residents 80 57.6% Owner occupied59 42.4% Renter occupied
Language usage in Bowleys Quarters
English speakers - Total 92.4% of residents of Bowleys Quarters speak English at home.
2.5% of residents speak Spanish at home 105 65.6% Speak English very well55 34.4% Speak English less than very well5.4% of residents speak other language at home 237 68.9% Speak English very well107 31.1% Speak English less than very well
English speakers - Born in the United States 99.5% of residents of Bowleys Quarters speak English at home.
1.8% of residents speak Spanish at home 12 63.2% Speak English very well7 36.8% Speak English less than very well
All residents speak only English at home
English speakers - Foreign-born 57.7% of residents of Bowleys Quarters speak English at home.
12.3% of residents speak Spanish at home 53 61.6% Speak English very well33 38.4% Speak English less than very well34.0% of residents speak other language at home 173 72.7% Speak English very well65 27.3% Speak English less than very well
White (Caucasian) - Speak only English Native:
98.4% (4,333)Foreign-born:
29.7% (31)
White (Caucasian) - Speak another language Native:
1.9% (82)Foreign-born:
70.5% (74)
Black or African American - Speak only English Native:
98.9% (790)Foreign-born:
55.1% (147)
Black or African American - Speak another language Native:
1.4% (11)Foreign-born:
47.8% (128)
Asian - Speak only English Native:
23.6% (18)Foreign-born:
84.9% (205)
Asian - Speak another language Native:
76.0% (57)Foreign-born:
24.9% (60)
Other race - Speak only English Native:
97.7% (130)Foreign-born:
20.0% (13)
Other race - Speak another language Native:
3.7% (5)Foreign-born:
75.9% (48)
White alone - Speak only English Native:
98.0% (4,321)Foreign-born:
16.2% (14)
White alone - Speak another language Native:
2.0% (90)Foreign-born:
84.6% (75)
Hispanic or Latino - Speak only English Native:
100.0% (174)Foreign-born:
24.0% (30)
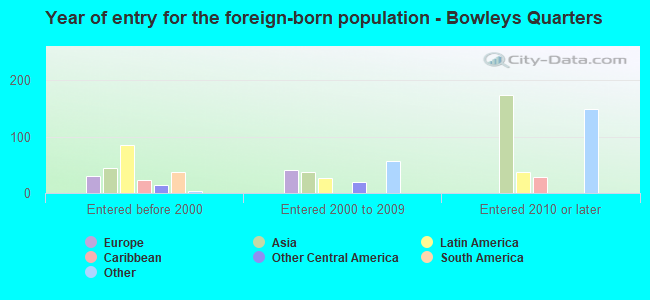
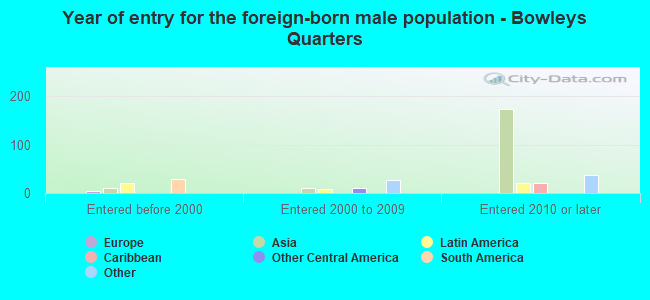
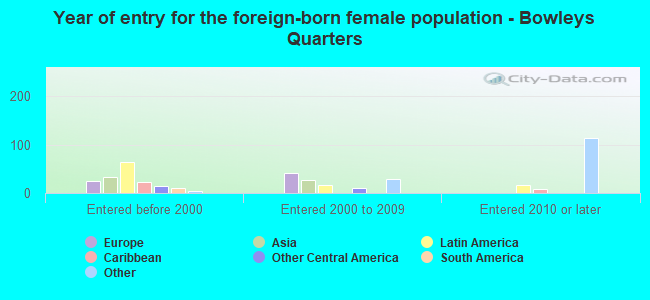
Foreign-born residents in Bowleys Quarters 705 residents are foreign born (3.4% Asia , 2.9% Africa , 2.1% Latin America , 1.3% Europe ).
This city:
10.5%Maryland:
15.7%
Marital status for residents in Bowleys Quarters Marital status - White (Caucasian) population 15 years and over
Males 28.8% Never married63.2% Now married0.0% Separated1.9% Widowed6.1% DivorcedFemales 23.8% Never married62.5% Now married0.8% Separated3.9% Widowed8.9% DivorcedWomen who gave birth in the past 12 months Now married:
100.0% (106)Unmarried:
0.0% (0)
Women who did not give birth in the past 12 months Now married:
53.2% (537)Unmarried:
46.8% (472)
Marital status - Black or African American population 15 years and over
Males 43.0% Never married50.6% Now married0.0% Separated0.0% Widowed6.4% DivorcedFemales 63.8% Never married30.8% Now married1.6% Separated1.0% Widowed2.8% DivorcedWomen who did not give birth in the past 12 months Now married:
23.2% (88)Unmarried:
76.8% (293)
Marital status - Asian population 15 years and over
Males 84.1% Never married13.6% Now married2.3% Separated0.0% Widowed0.0% DivorcedFemales 0.0% Never married63.5% Now married31.7% Separated0.0% Widowed4.8% DivorcedWomen who did not give birth in the past 12 months Now married:
100.0% (35)Unmarried:
0.0% (0)
Marital status - Other race population 15 years and over
Males 34.9% Never married65.1% Now married0.0% Separated0.0% Widowed0.0% DivorcedFemales 56.0% Never married44.0% Now married0.0% Separated0.0% Widowed0.0% DivorcedWomen who did not give birth in the past 12 months Now married:
44.0% (16)Unmarried:
56.0% (21)
Marital status - Two or more races population 15 years and over
Males 100.0% Never married0.0% Now married0.0% Separated0.0% Widowed0.0% DivorcedFemales 31.9% Never married52.2% Now married0.0% Separated7.2% Widowed8.7% DivorcedWomen who did not give birth in the past 12 months Now married:
43.6% (22)Unmarried:
56.4% (28)
Marital status - White alone, not Hispanic / Latino population 15 years and over
Males 28.6% Never married63.2% Now married0.0% Separated1.9% Widowed6.2% DivorcedFemales 23.5% Never married62.6% Now married0.9% Separated4.0% Widowed9.0% DivorcedWomen who gave birth in the past 12 months Now married:
100.0% (107)Unmarried:
0.0% (0)
Women who did not give birth in the past 12 months Now married:
53.8% (541)Unmarried:
46.2% (465)
Marital status - Hispanic or Latino population 15 years and over
Males 21.1% Never married78.9% Now married0.0% Separated0.0% Widowed0.0% DivorcedFemales 67.6% Never married32.4% Now married0.0% Separated0.0% Widowed0.0% DivorcedWomen who did not give birth in the past 12 months Now married:
13.1% (12)Unmarried:
86.9% (78)
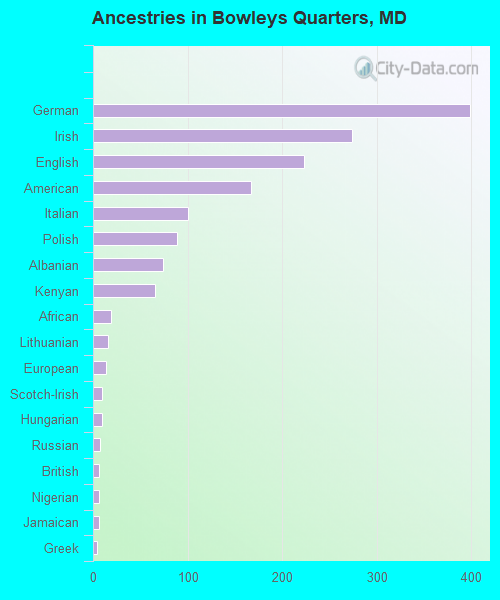
Ancestries in Bowleys Quarters
399 13.2% German274 9.1% Irish223 7.4% English167 5.5% American101 3.3% Italian89 2.9% Polish74 2.4% Albanian66 2.2% Kenyan19 0.6% African16 0.5% Lithuanian14 0.5% European10 0.3% Scotch-Irish9 0.3% Hungarian7 0.2% Russian6 0.2% British6 0.2% Nigerian6 0.2% Jamaican4 0.1% Greek3 0.10% Czechoslovakian
Children Nativity (place of birth) in Bowleys Quarters
Children under 6 years - Living with two parents Both parents native 206 100.0% NativeBoth parents foreign-born 25 100.0% NativeChildren under 6 years - Living with one parent Native parent 138 100.0% NativeForeign-born parent 34 100.0% NativeChildren 6 to 17 years - Living with two parents Both parents native 444 100.0% NativeBoth parents foreign-born 8 100.0% Foreign-bornOne native, one foreign-born parent 88 100.0% NativeChildren 6 to 17 years - Living with one parent Native parent 219 100.0% NativeForeign-born parent 118 50.5% Native115 49.5% Foreign-born
Grandparents responsible for own grandchildren in Bowleys Quarters
Grandparents (30 to 59 years) White / Caucasian 42 100.0% Not responsible for grandchildrenBlack or African American 3 100.0% Responsible for grandchildrenWhite alone, not Hispanic / Latino 41 100.0% Not responsible for grandchildrenGrandparents (60 years and over) White / Caucasian 34 64.0% Responsible for grandchildren19 36.0% Not responsible for grandchildrenBlack or African American 38 100.0% Not responsible for grandchildrenWhite alone, not Hispanic / Latino 35 63.3% Responsible for grandchildren20 36.7% Not responsible for grandchildren