Races in Bowdoinham, Maine (ME) Detailed Stats
Ancestries, Foreign-born residents, place of birth

Data:
1.1% of Bowdoinham, ME residents are foreign-born , which is 170.2% less than the foreign-born rate of 3.0% across the entire state of Maine.
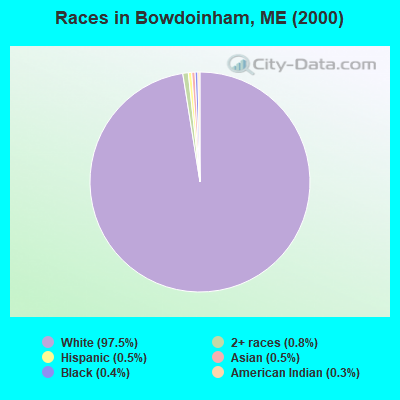
Race distribution in Bowdoinham

- 2,54697.5%White alone
- 220.8%Two or more races
- 130.5%Hispanic
- 120.5%Asian alone
- 100.4%Black alone
- 80.3%American Indian alone
- 10.04%Native Hawaiian and Other
Pacific Islander alone
2000
2022
-
- 1,230,29796.5%White alone
- 11,7310.9%Two or more races
- 9,3600.7%Hispanic
- 9,0140.7%Asian alone
- 6,4400.5%Black alone
- 6,9110.5%American Indian alone
- 8360.07%Other race alone
- 3340.03%Native Hawaiian and Other
Pacific Islander alone
-
- 1,249,23390.2%White alone
- 58,3574.2%Two or more races
- 28,7172.1%Hispanic
- 21,5831.6%Black alone
- 16,1511.2%Asian alone
- 5,8730.4%Other race alone
- 5,2050.4%American Indian alone
- 2210.02%Native Hawaiian and Other
Pacific Islander alone
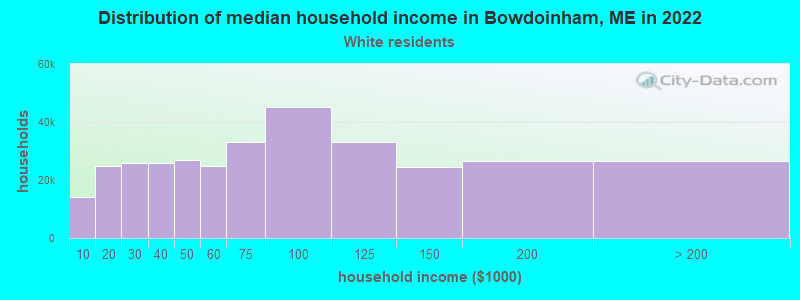
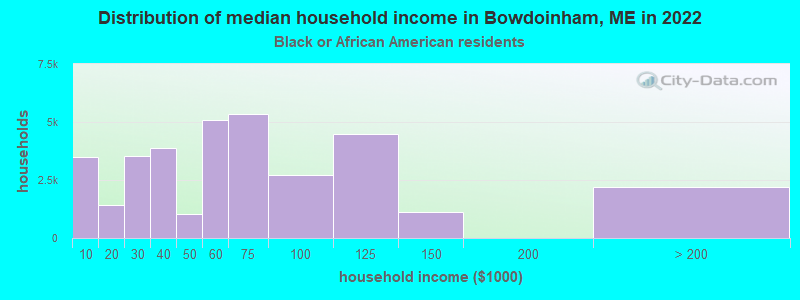
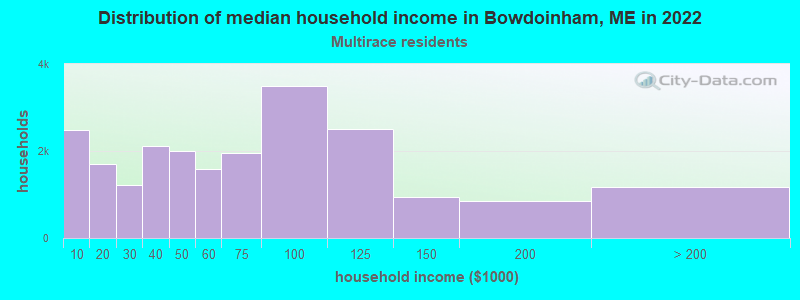
Income and house value in Bowdoinham
- Median household income in 2022
- $82,868White non-Hispanic householders
- over $200,000Black householders
- $97,678Two or more races householders
- Median 2022 house value
- $333,532White Non-Hispanic householders
- $403,704Black or African American householders
Foreign-born residents in Bowdoinham
29 residents are foreign born
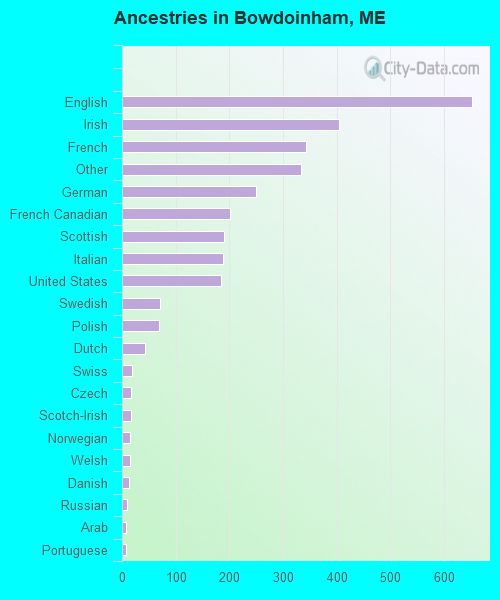
Ancestries in Bowdoinham

- 65121.3%English
- 40513.3%Irish
- 34311.2%French
- 33310.9%Other
- 2498.2%German
- 2016.6%French Canadian
- 1906.2%Scottish
- 1886.2%Italian
- 1846.0%United States
- 712.3%Swedish
- 682.2%Polish
- 431.4%Dutch
- 180.6%Swiss
- 170.6%Czech
- 160.5%Scotch-Irish
- 150.5%Norwegian
- 140.5%Welsh
- 130.4%Danish
- 90.3%Russian
- 80.3%Arab
- 80.3%Portuguese
- 50.2%Ukrainian
- 40.1%Hungarian