Races in Boston, Massachusetts (MA) Detailed Stats
Data:
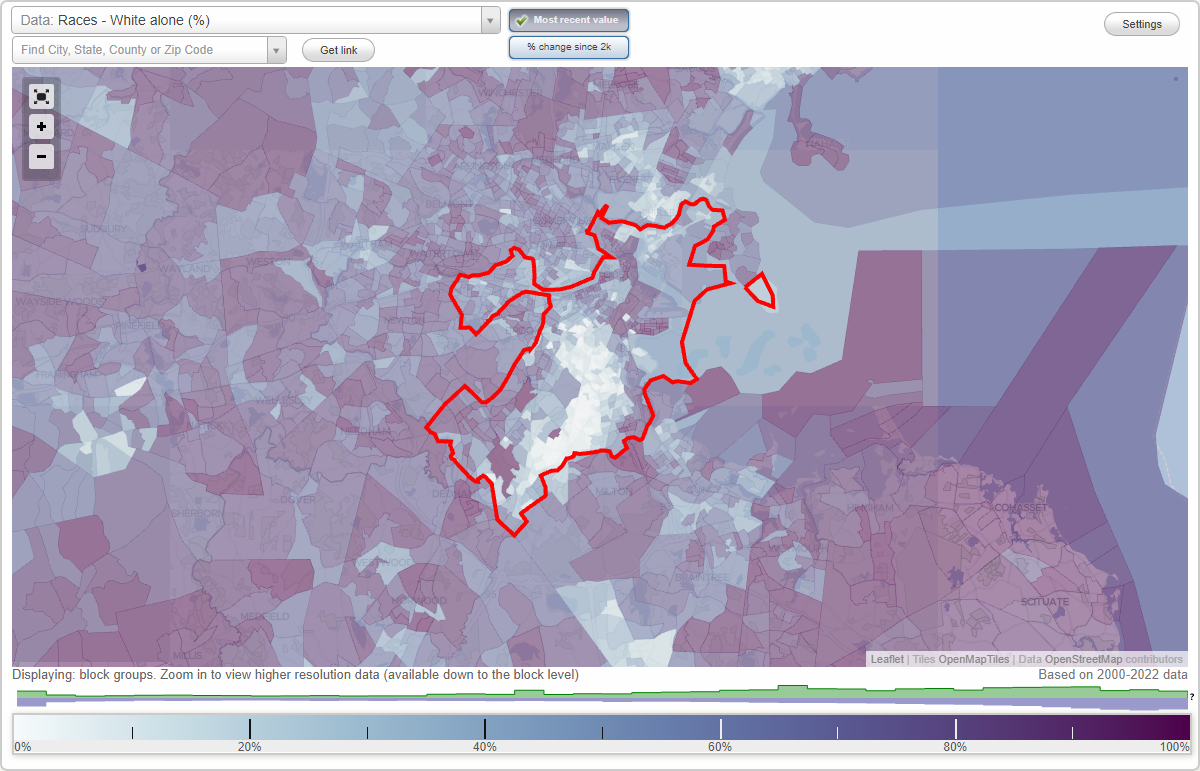
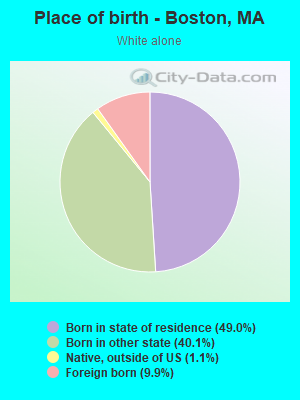
Races - White alone (%)
Races - White alone (% change since 2000)
Races - Black alone (%)
Races - Black alone (% change since 2000)
Races - American Indian alone (%)
Races - American Indian alone (% change since 2000)
Races - Asian alone (%)
Races - Asian alone (% change since 2000)
Races - Hispanic (%)
Races - Hispanic (% change since 2000)
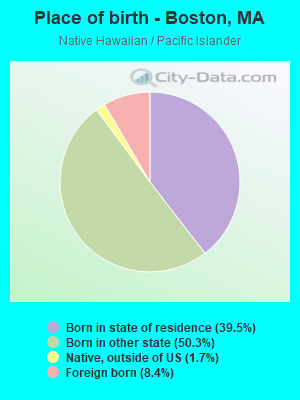
Races - Native Hawaiian and Other Pacific Islander alone (%)
Races - Native Hawaiian and Other Pacific Islander alone (% change since 2000)
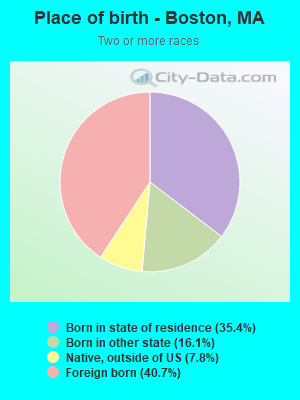
Races - Two or more races(%)
Races - Two or more races(% change since 2000)
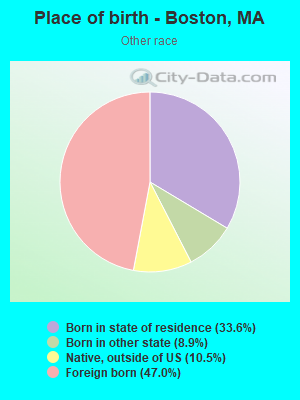
Races - Other race alone (%)
Races - Other race alone (% change since 2000)
Racial diversity
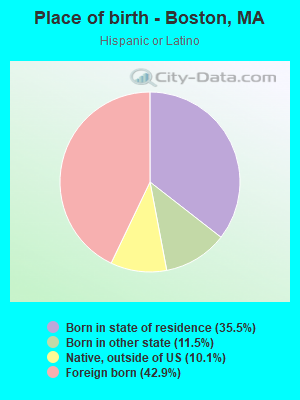
Place of birth - Born in state of residence (%)
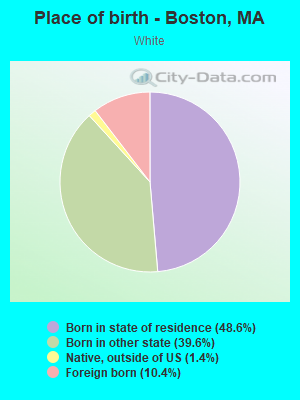
Place of birth - Born in state of residence (%) - White
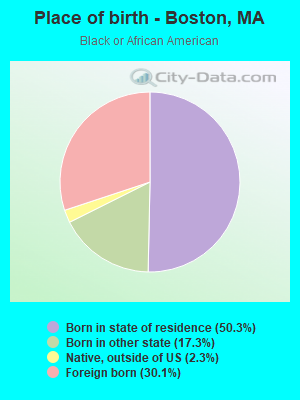
Place of birth - Born in state of residence (%) - Black or African American
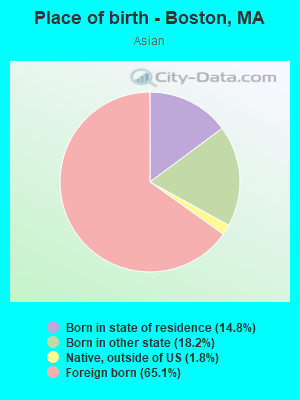
Place of birth - Born in state of residence (%) - Asian
Place of birth - Born in state of residence (%) - Hispanic or Latino
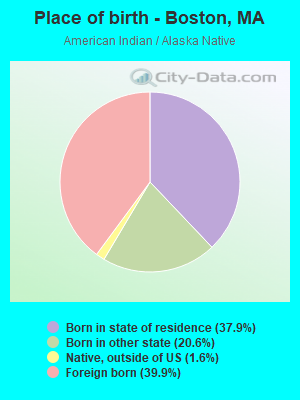
Place of birth - Born in state of residence (%) - American Indian and Alaska Native
Place of birth - Born in state of residence (%) - Multirace
Place of birth - Born in state of residence (%) - Other Race
Place of birth - Born in other state (%)
Place of birth - Born in other state (%) - White
Place of birth - Born in other state (%) - Black or African American
Place of birth - Born in other state (%) - Asian
Place of birth - Born in other state (%) - Hispanic or Latino
Place of birth - Born in other state (%) - American Indian and Alaska Native
Place of birth - Born in other state (%) - Multirace
Place of birth - Born in other state (%) - Other Race
Place of birth - Native, outside of US (%)
Place of birth - Native, outside of US (%) - White
Place of birth - Native, outside of US (%) - Black or African American
Place of birth - Native, outside of US (%) - Asian
Place of birth - Native, outside of US (%) - Hispanic or Latino
Place of birth - Native, outside of US (%) - American Indian and Alaska Native
Place of birth - Native, outside of US (%) - Multirace
Place of birth - Native, outside of US (%) - Other Race
Place of birth - Foreign born (%)
Place of birth - Foreign born (%) - White
Place of birth - Foreign born (%) - Black or African American
Place of birth - Foreign born (%) - Asian
Place of birth - Foreign born (%) - Hispanic or Latino
Place of birth - Foreign born (%) - American Indian and Alaska Native
Place of birth - Foreign born (%) - Multirace
Place of birth - Foreign born (%) - Other Race
Residents speaking English at home (%)
Residents speaking English at home - Born in the United States (%)
Residents speaking English at home - Native, born elsewhere (%)
Residents speaking English at home - Foreign born (%)
Residents speaking Spanish at home (%)
Residents speaking Spanish at home - Born in the United States (%)
Residents speaking Spanish at home - Native, born elsewhere (%)
Residents speaking Spanish at home - Foreign born (%)
Residents speaking other language at home (%)
Residents speaking other language at home - Born in the United States (%)
Residents speaking other language at home - Native, born elsewhere (%)
Residents speaking other language at home - Foreign born (%)
Marital status - Never married (%)
Marital status - Now married (%)
Marital status - Separated (%)
Marital status - Widowed (%)
Marital status - Divorced (%)
Ancestries Reported - Arab (%)
Ancestries Reported - Czech (%)
Ancestries Reported - Danish (%)
Ancestries Reported - Dutch (%)
Ancestries Reported - English (%)
Ancestries Reported - French (%)
Ancestries Reported - French Canadian (%)
Ancestries Reported - German (%)
Ancestries Reported - Greek (%)
Ancestries Reported - Hungarian (%)
Ancestries Reported - Irish (%)
Ancestries Reported - Italian (%)
Ancestries Reported - Lithuanian (%)
Ancestries Reported - Norwegian (%)
Ancestries Reported - Polish (%)
Ancestries Reported - Portuguese (%)
Ancestries Reported - Russian (%)
Ancestries Reported - Scotch-Irish (%)
Ancestries Reported - Scottish (%)
Ancestries Reported - Slovak (%)
Ancestries Reported - Subsaharan African (%)
Ancestries Reported - Swedish (%)
Ancestries Reported - Swiss (%)
Ancestries Reported - Ukrainian (%)
Ancestries Reported - United States (%)
Ancestries Reported - Welsh (%)
Ancestries Reported - West Indian (%)
Ancestries Reported - Other (%)
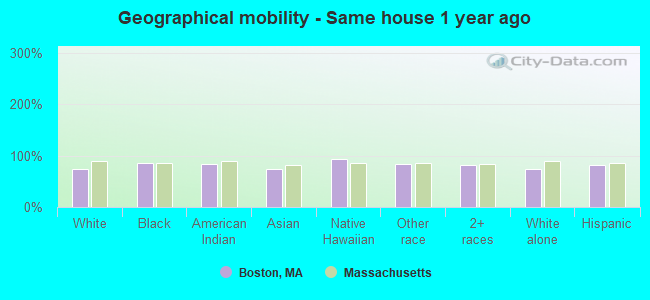
Geographical mobility - Same house 1 year ago (%)
Geographical mobility - Same house 1 year ago (%) - White
Geographical mobility - Same house 1 year ago (%) - Black or African American
Geographical mobility - Same house 1 year ago (%) - Asian
Geographical mobility - Same house 1 year ago (%) - Hispanic or Latino
Geographical mobility - Same house 1 year ago (%) - American Indian and Alaska Native
Geographical mobility - Same house 1 year ago (%) - Multirace
Geographical mobility - Same house 1 year ago (%) - Other Race
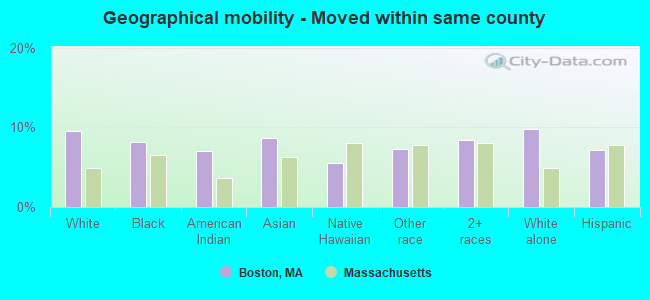
Geographical mobility - Moved within same county (%)
Geographical mobility - Moved within same county (%) - White
Geographical mobility - Moved within same county (%) - Black or African American
Geographical mobility - Moved within same county (%) - Asian
Geographical mobility - Moved within same county (%) - Hispanic or Latino
Geographical mobility - Moved within same county (%) - American Indian and Alaska Native
Geographical mobility - Moved within same county (%) - Multirace
Geographical mobility - Moved within same county (%) - Other Race
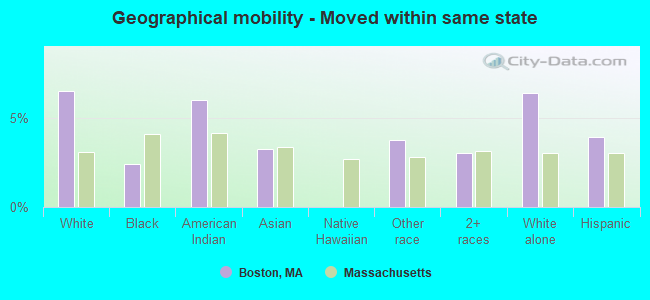
Geographical mobility - Moved from different county within same state (%)
Geographical mobility - Moved from different county within same state (%) - White
Geographical mobility - Moved from different county within same state (%) - Black or African American
Geographical mobility - Moved from different county within same state (%) - Asian
Geographical mobility - Moved from different county within same state (%) - Hispanic or Latino
Geographical mobility - Moved from different county within same state (%) - American Indian and Alaska Native
Geographical mobility - Moved from different county within same state (%) - Multirace
Geographical mobility - Moved from different county within same state (%) - Other Race
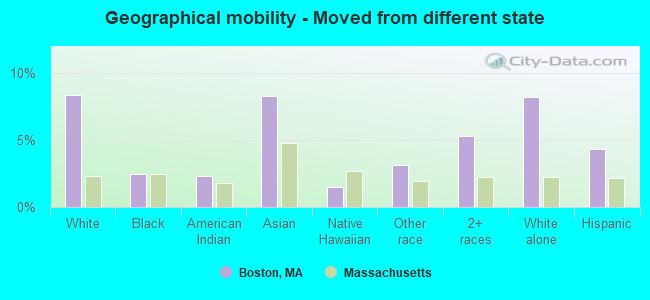
Geographical mobility - Moved from different state (%)
Geographical mobility - Moved from different state (%) - White
Geographical mobility - Moved from different state (%) - Black or African American
Geographical mobility - Moved from different state (%) - Asian
Geographical mobility - Moved from different state (%) - Hispanic or Latino
Geographical mobility - Moved from different state (%) - American Indian and Alaska Native
Geographical mobility - Moved from different state (%) - Multirace
Geographical mobility - Moved from different state (%) - Other Race
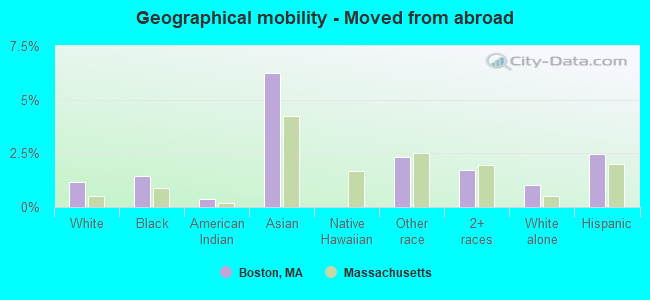
Geographical mobility - Moved from abroad (%)
Geographical mobility - Moved from abroad (%) - White
Geographical mobility - Moved from abroad (%) - Black or African American
Geographical mobility - Moved from abroad (%) - Asian
Geographical mobility - Moved from abroad (%) - Hispanic or Latino
Geographical mobility - Moved from abroad (%) - American Indian and Alaska Native
Geographical mobility - Moved from abroad (%) - Multirace
Geographical mobility - Moved from abroad (%) - Other Race
Place of birth for the foreign-born population - Ireland (%)
Place of birth for the foreign-born population - Denmark (%)
Place of birth for the foreign-born population - Norway (%)
Place of birth for the foreign-born population - Sweden (%)
Place of birth for the foreign-born population - United Kingdom (%)
Place of birth for the foreign-born population - England (%)
Place of birth for the foreign-born population - Scotland (%)
Place of birth for the foreign-born population - Other Northern Europe (%)
Place of birth for the foreign-born population - Austria (%)
Place of birth for the foreign-born population - Belgium (%)
Place of birth for the foreign-born population - France (%)
Place of birth for the foreign-born population - Germany (%)
Place of birth for the foreign-born population - Netherlands (%)
Place of birth for the foreign-born population - Switzerland (%)
Place of birth for the foreign-born population - Other Western Europe (%)
Place of birth for the foreign-born population - Greece (%)
Place of birth for the foreign-born population - Italy (%)
Place of birth for the foreign-born population - Portugal (%)
Place of birth for the foreign-born population - Spain (%)
Place of birth for the foreign-born population - Other Southern Europe (%)
Place of birth for the foreign-born population - Albania (%)
Place of birth for the foreign-born population - Belarus (%)
Place of birth for the foreign-born population - Bosnia and Herzegovina (%)
Place of birth for the foreign-born population - Bulgaria (%)
Place of birth for the foreign-born population - Croatia (%)
Place of birth for the foreign-born population - Czechoslovakia (%)
Place of birth for the foreign-born population - Hungary (%)
Place of birth for the foreign-born population - Latvia (%)
Place of birth for the foreign-born population - Lithuania (%)
Place of birth for the foreign-born population - North Macedonia (Macedonia) (%)
Place of birth for the foreign-born population - Moldova (%)
Place of birth for the foreign-born population - Poland (%)
Place of birth for the foreign-born population - Romania (%)
Place of birth for the foreign-born population - Russia (%)
Place of birth for the foreign-born population - Serbia (%)
Place of birth for the foreign-born population - Ukraine (%)
Place of birth for the foreign-born population - Other Eastern Europe (%)
Place of birth for the foreign-born population - China (%)
Place of birth for the foreign-born population - Hong Kong (%)
Place of birth for the foreign-born population - Taiwan (%)
Place of birth for the foreign-born population - Japan (%)
Place of birth for the foreign-born population - Korea (%)
Place of birth for the foreign-born population - Other Eastern Asia (%)
Place of birth for the foreign-born population - Afghanistan (%)
Place of birth for the foreign-born population - Bangladesh (%)
Place of birth for the foreign-born population - India (%)
Place of birth for the foreign-born population - Iran (%)
Place of birth for the foreign-born population - Kazakhstan (%)
Place of birth for the foreign-born population - Nepal (%)
Place of birth for the foreign-born population - Pakistan (%)
Place of birth for the foreign-born population - Sri Lanka (%)
Place of birth for the foreign-born population - Uzbekistan (%)
Place of birth for the foreign-born population - Other South Central Asia (%)
Place of birth for the foreign-born population - Burma (%)
Place of birth for the foreign-born population - Cambodia (%)
Place of birth for the foreign-born population - Indonesia (%)
Place of birth for the foreign-born population - Laos (%)
Place of birth for the foreign-born population - Malaysia (%)
Place of birth for the foreign-born population - Philippines (%)
Place of birth for the foreign-born population - Singapore (%)
Place of birth for the foreign-born population - Thailand (%)
Place of birth for the foreign-born population - Vietnam (%)
Place of birth for the foreign-born population - Other South Eastern Asia (%)
Place of birth for the foreign-born population - Armenia (%)
Place of birth for the foreign-born population - Iraq (%)
Place of birth for the foreign-born population - Israel (%)
Place of birth for the foreign-born population - Jordan (%)
Place of birth for the foreign-born population - Kuwait (%)
Place of birth for the foreign-born population - Lebanon (%)
Place of birth for the foreign-born population - Saudi Arabia (%)
Place of birth for the foreign-born population - Syria (%)
Place of birth for the foreign-born population - Turkey (%)
Place of birth for the foreign-born population - Yemen (%)
Place of birth for the foreign-born population - Other Western Asia (%)
Place of birth for the foreign-born population - Eritrea (%)
Place of birth for the foreign-born population - Ethiopia (%)
Place of birth for the foreign-born population - Kenya (%)
Place of birth for the foreign-born population - Somalia (%)
Place of birth for the foreign-born population - Uganda (%)
Place of birth for the foreign-born population - Zimbabwe (%)
Place of birth for the foreign-born population - Other Eastern Africa (%)
Place of birth for the foreign-born population - Cameroon (%)
Place of birth for the foreign-born population - Congo (%)
Place of birth for the foreign-born population - Democratic Republic of Congo (Zaire) (%)
Place of birth for the foreign-born population - Other Middle Africa (%)
Place of birth for the foreign-born population - Egypt (%)
Place of birth for the foreign-born population - Morocco (%)
Place of birth for the foreign-born population - Sudan (%)
Place of birth for the foreign-born population - Other Northern Africa (%)
Place of birth for the foreign-born population - South Africa (%)
Place of birth for the foreign-born population - Other Southern Africa (%)
Place of birth for the foreign-born population - Cabo Verde (%)
Place of birth for the foreign-born population - Ghana (%)
Place of birth for the foreign-born population - Liberia (%)
Place of birth for the foreign-born population - Nigeria (%)
Place of birth for the foreign-born population - Senegal (%)
Place of birth for the foreign-born population - Sierra Leone (%)
Place of birth for the foreign-born population - Other Western Africa (%)
Place of birth for the foreign-born population - Australia (%)
Place of birth for the foreign-born population - New Zealand (%)
Place of birth for the foreign-born population - Fiji (%)
Place of birth for the foreign-born population - Micronesia (%)
Place of birth for the foreign-born population - Bahamas (%)
Place of birth for the foreign-born population - Barbados (%)
Place of birth for the foreign-born population - Cuba (%)
Place of birth for the foreign-born population - Dominica (%)
Place of birth for the foreign-born population - Dominican Republic (%)
Place of birth for the foreign-born population - Grenada (%)
Place of birth for the foreign-born population - Haiti (%)
Place of birth for the foreign-born population - Jamaica (%)
Place of birth for the foreign-born population - St. Vincent and the Grenadines (%)
Place of birth for the foreign-born population - Trinidad and Tobago (%)
Place of birth for the foreign-born population - West Indies (%)
Place of birth for the foreign-born population - Other Caribbean (%)
Place of birth for the foreign-born population - Belize (%)
Place of birth for the foreign-born population - Costa Rica (%)
Place of birth for the foreign-born population - El Salvador (%)
Place of birth for the foreign-born population - Guatemala (%)
Place of birth for the foreign-born population - Honduras (%)
Place of birth for the foreign-born population - Mexico (%)
Place of birth for the foreign-born population - Nicaragua (%)
Place of birth for the foreign-born population - Panama (%)
Place of birth for the foreign-born population - Other Central America (%)
Place of birth for the foreign-born population - Argentina (%)
Place of birth for the foreign-born population - Bolivia (%)
Place of birth for the foreign-born population - Brazil (%)
Place of birth for the foreign-born population - Chile (%)
Place of birth for the foreign-born population - Colombia (%)
Place of birth for the foreign-born population - Ecuador (%)
Place of birth for the foreign-born population - Guyana (%)
Place of birth for the foreign-born population - Peru (%)
Place of birth for the foreign-born population - Uruguay (%)
Place of birth for the foreign-born population - Venezuela (%)
Place of birth for the foreign-born population - Other South America (%)
Place of birth for the foreign-born population - Canada (%)
Place of birth for the foreign-born population - Other Northern America (%)
Place of birth for the foreign-born population - Other (%)
Latest news about races in Boston, MA collected exclusively by city-data.com from local newspapers, TV, and radio stations
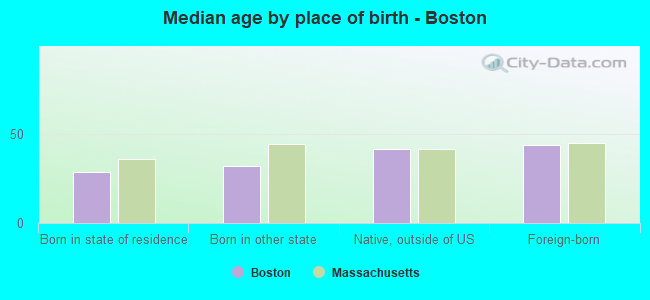
According to 2022 data, the most numerous races in Boston, MA are White alone (282,033 residents), Hispanic (130,250 residents), and Asian alone (63,381 residents). 65.2% of Boston residents speak English at home. 29.5% of Boston, MA residents are foreign-born (13.9% born in Latin America, 7.5% born in Asia, 3.1% born in Europe, 3.1% born in Africa), which is 39.0% greater than the foreign-born rate of 18.0% across the entire state of Massachusetts.
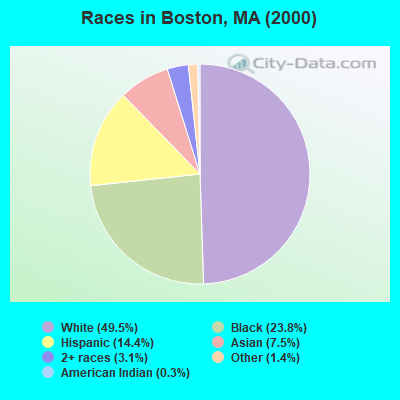
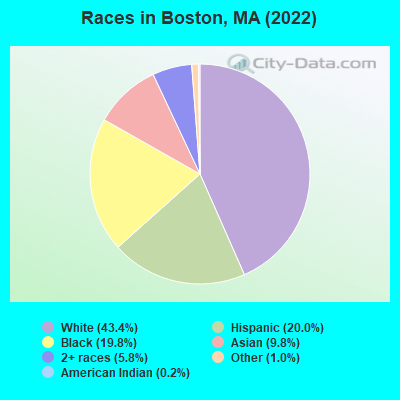
Race distribution in Boston
2000 2022
291,561 49.5% White alone 140,305 23.8% Black alone 85,089 14.4% Hispanic 44,009 7.5% Asian alone 18,174 3.1% Two or more races 8,215 1.4% Other race alone 1,517 0.3% American Indian alone 271 0.05% Native Hawaiian and Other
282,033 43.4% White alone 130,250 20.0% Hispanic 128,656 19.8% Black alone 63,381 9.8% Asian alone 37,786 5.8% Two or more races 6,524 1.0% Other race alone 1,068 0.2% American Indian alone 70 0.01% Native Hawaiian and Other
2000 2022
5,198,359 81.9% White alone 428,729 6.8% Hispanic 318,329 5.0% Black alone 236,786 3.7% Asian alone 110,338 1.7% Two or more races 43,586 0.7% Other race alone 11,264 0.2% American Indian alone 1,706 0.03% Native Hawaiian and Other
4,676,627 67.0% White alone 911,038 13.0% Hispanic 501,463 7.2% Asian alone 459,740 6.6% Black alone 341,889 4.9% Two or more races 84,403 1.2% Other race alone 5,838 0.08% American Indian alone 976 0.01% Native Hawaiian and Other
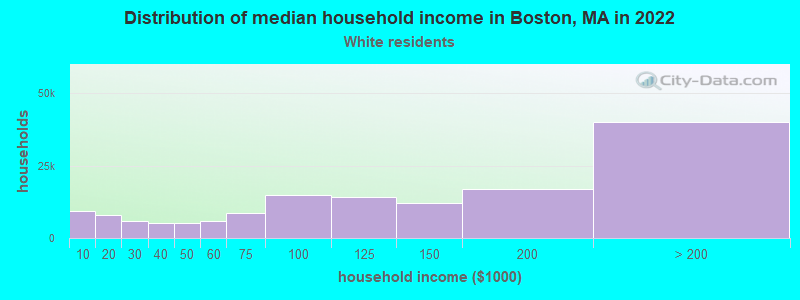
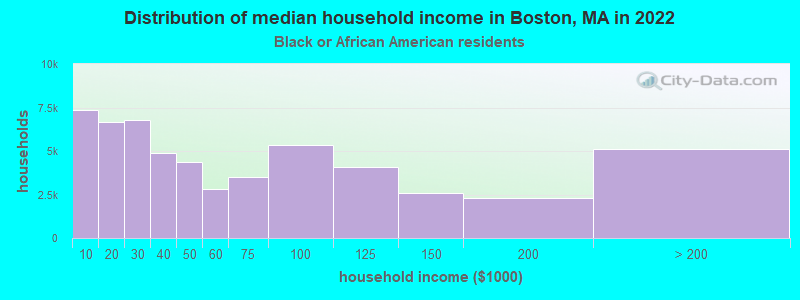
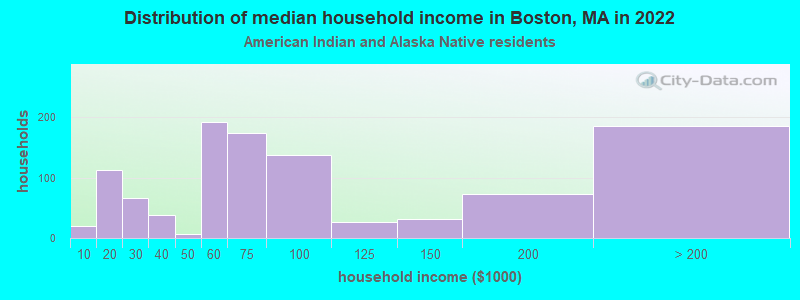
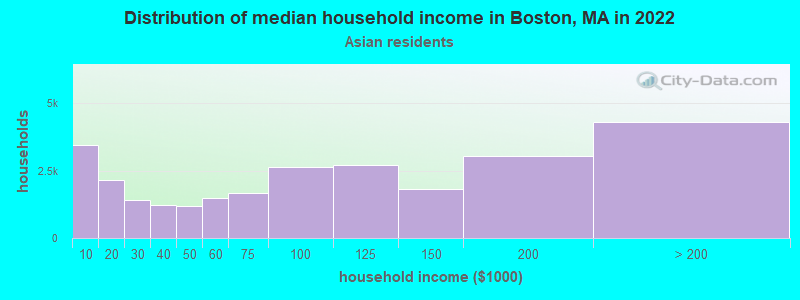
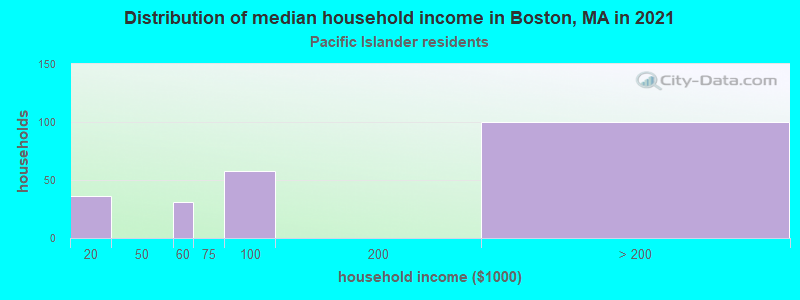
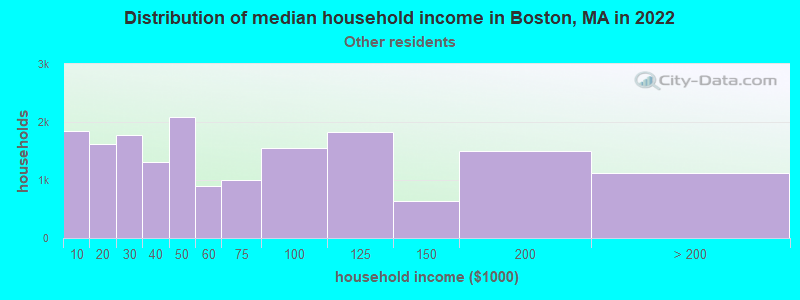
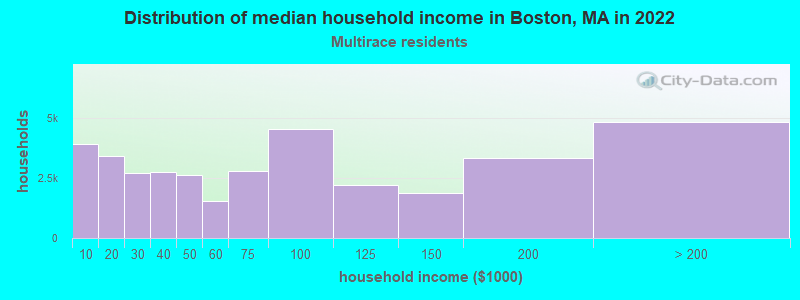
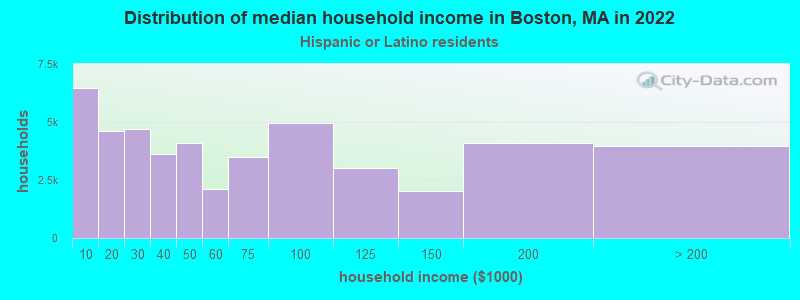
Income and house value in Boston Median household income in 2022 $118,708 White non-Hispanic householders$44,345 Black householders$82,632 American Indian and Alaska Native householders$84,202 Asian householders$49,683 Some other race householders$63,310 Two or more races householders$50,269 Hispanic or Latino race householdersMedian 2022 house value $693,721 White Non-Hispanic householders$519,456 Black or African American householders$525,131 American Indian or Alaska Native householders $637,970 Asian householders$571,869 Some other race householders$580,883 Two or more races householders$612,932 Hispanic or Latino householders
Median age by race in Boston
33.3 Median age for White residents33.5 33.0 35.9 Median age for Black or African American residents35.5 36.0 44.8 Median age for American Indian / Alaska Native residents47.3 44.5 33.6 Median age for Asian residents32.3 34.8 -666,666,666.0 Median age for Native Hawaiian / Pacific Islander residents-666,666,666.0 -666,666,666.0 32.2 Median age for Other race residents30.6 33.9 30.5 Median age for Two or more races residents28.5 32.9 33.5 Median age for White alone residents33.7 33.2 30.4 Median age for Hispanic or Latino residents28.4 32.1
Owner/renter occupied households by race in Boston
House owners and renters - White residents 59,897 41.0% Owner occupied86,228 59.0% Renter occupiedHouse owners and renters - Black or African American residents 16,860 30.2% Owner occupied39,027 69.8% Renter occupiedHouse owners and renters - American Indian / Alaska Native residents 678 46.8% Owner occupied771 53.2% Renter occupiedHouse owners and renters - Asian residents 9,175 33.9% Owner occupied17,886 66.1% Renter occupiedHouse owners and renters - Native Hawaiian / Pacific Islander residents 78 25.3% Owner occupied230 74.7% Renter occupiedHouse owners and renters - Other race residents 3,333 19.4% Owner occupied13,813 80.6% Renter occupiedHouse owners and renters - Two or more races residents 9,083 25.0% Owner occupied27,310 75.0% Renter occupiedHouse owners and renters - White alone residents 59,241 41.9% Owner occupied82,198 58.1% Renter occupiedHouse owners and renters - Hispanic or Latino residents 9,044 19.2% Owner occupied38,082 80.8% Renter occupied
Language usage in Boston
English speakers - Total 65.2% of residents of Boston speak English at home.
16.1% of residents speak Spanish at home 53,549 53.7% Speak English very well46,106 46.3% Speak English less than very well18.7% of residents speak other language at home 69,906 60.4% Speak English very well45,761 39.6% Speak English less than very well
English speakers - Born in the United States 86.5% of residents of Boston speak English at home.
5.6% of residents speak Spanish at home 8,613 89.0% Speak English very well1,066 11.0% Speak English less than very well7.9% of residents speak other language at home 13,135 96.1% Speak English very well531 3.9% Speak English less than very well
English speakers - Native, born elsewhere 31.3% of residents of Boston speak English at home.
56.5% of residents speak Spanish at home 5,494 47.2% Speak English very well6,138 52.8% Speak English less than very well12.2% of residents speak other language at home 2,032 80.9% Speak English very well481 19.1% Speak English less than very well
English speakers - Foreign-born 22.0% of residents of Boston speak English at home.
29.8% of residents speak Spanish at home 17,110 32.2% Speak English very well36,107 67.8% Speak English less than very well48.2% of residents speak other language at home 43,461 50.4% Speak English very well42,783 49.6% Speak English less than very well
White (Caucasian) - Speak only English Native:
95.1% (240,054)Foreign-born:
28.6% (8,739)
White (Caucasian) - Speak another language Native:
4.9% (12,253)Foreign-born:
71.4% (21,867)
Black or African American - Speak only English Native:
88.0% (78,605)Foreign-born:
45.7% (18,846)
Black or African American - Speak another language Native:
12.0% (10,760)Foreign-born:
54.3% (22,408)
American Indian / Alaska Native - Speak only English Native:
41.4% (962)Foreign-born:
3.6% (57)
American Indian / Alaska Native - Speak another language Native:
58.6% (1,364)Foreign-born:
96.4% (1,527)
Asian - Speak only English Native:
43.3% (8,975)Foreign-born:
17.2% (7,140)
Asian - Speak another language Native:
56.7% (11,771)Foreign-born:
82.8% (34,444)
Native Hawaiian / Pacific Islander - Speak another language Native:
19.1% (99)Foreign-born:
100.0% (69)
Other race - Speak only English Native:
33.5% (7,508)Foreign-born:
8.2% (1,892)
Other race - Speak another language Native:
66.5% (14,917)Foreign-born:
91.8% (21,200)
Two or more races - Speak only English Native:
52.7% (27,584)Foreign-born:
6.7% (2,740)
Two or more races - Speak another language Native:
47.3% (24,742)Foreign-born:
93.3% (38,015)
White alone - Speak only English Native:
96.6% (236,138)Foreign-born:
29.9% (8,302)
White alone - Speak another language Native:
3.4% (8,243)Foreign-born:
70.1% (19,485)
Hispanic or Latino - Speak only English Native:
32.2% (20,819)Foreign-born:
6.4% (3,524)
Hispanic or Latino - Speak another language Native:
67.8% (43,935)Foreign-born:
93.6% (51,718)
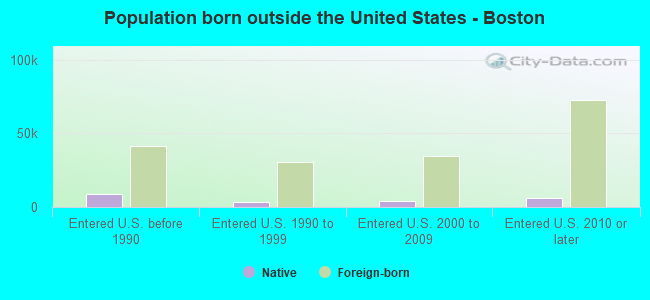
Foreign-born residents in Boston 191,711 residents are foreign born (13.9% Latin America , 7.5% Asia , 3.1% Europe , 3.1% Africa ).
This city:
29.5%Massachusetts:
17.6%
Marital status for residents in Boston Marital status - White (Caucasian) population 15 years and over
Males 57.0% Never married34.4% Now married0.9% Separated1.6% Widowed6.2% DivorcedFemales 57.7% Never married27.0% Now married1.2% Separated6.3% Widowed7.8% DivorcedWomen who gave birth in the past 12 months Now married:
86.1% (2,080)Unmarried:
13.9% (336)
Women who did not give birth in the past 12 months Now married:
21.6% (20,417)Unmarried:
78.4% (74,086)
Marital status - Black or African American population 15 years and over
Males 57.3% Never married32.9% Now married1.5% Separated1.9% Widowed6.4% DivorcedFemales 57.1% Never married20.7% Now married5.9% Separated6.4% Widowed9.9% DivorcedWomen who gave birth in the past 12 months Now married:
55.6% (987)Unmarried:
44.4% (787)
Women who did not give birth in the past 12 months Now married:
17.8% (6,371)Unmarried:
82.2% (29,468)
Marital status - American Indian / Alaska Native population 15 years and over
Males 48.9% Never married37.6% Now married4.9% Separated0.0% Widowed8.6% DivorcedFemales 48.8% Never married33.4% Now married5.0% Separated0.8% Widowed12.1% DivorcedWomen who did not give birth in the past 12 months Now married:
30.8% (212)Unmarried:
69.2% (477)
Marital status - Asian population 15 years and over
Males 56.3% Never married35.9% Now married0.4% Separated3.5% Widowed3.9% DivorcedFemales 48.7% Never married39.7% Now married0.4% Separated6.5% Widowed4.7% DivorcedWomen who gave birth in the past 12 months Now married:
85.7% (456)Unmarried:
14.3% (76)
Women who did not give birth in the past 12 months Now married:
30.5% (6,539)Unmarried:
69.5% (14,888)
Marital status - Native Hawaiian / Pacific Islander population 15 years and over
Males 43.4% Never married0.0% Now married0.0% Separated0.0% Widowed56.6% DivorcedFemales 57.6% Never married20.8% Now married8.6% Separated13.1% Widowed0.0% DivorcedWomen who gave birth in the past 12 months Now married:
0.0% (0)Unmarried:
100.0% (24)
Women who did not give birth in the past 12 months Now married:
32.2% (59)Unmarried:
67.8% (124)
Marital status - Other race population 15 years and over
Males 53.6% Never married36.0% Now married1.8% Separated0.6% Widowed8.1% DivorcedFemales 45.5% Never married33.4% Now married6.4% Separated3.5% Widowed11.3% DivorcedWomen who gave birth in the past 12 months Now married:
60.3% (830)Unmarried:
39.7% (547)
Women who did not give birth in the past 12 months Now married:
31.0% (3,676)Unmarried:
69.0% (8,189)
Marital status - Two or more races population 15 years and over
Males 53.4% Never married36.6% Now married3.5% Separated1.3% Widowed5.3% DivorcedFemales 47.1% Never married32.4% Now married4.7% Separated4.7% Widowed11.1% DivorcedWomen who gave birth in the past 12 months Now married:
68.7% (454)Unmarried:
31.3% (207)
Women who did not give birth in the past 12 months Now married:
29.4% (8,128)Unmarried:
70.6% (19,554)
Marital status - White alone, not Hispanic / Latino population 15 years and over
Males 56.4% Never married35.0% Now married0.8% Separated1.5% Widowed6.3% DivorcedFemales 57.1% Never married27.5% Now married1.0% Separated6.5% Widowed7.8% DivorcedWomen who gave birth in the past 12 months Now married:
93.2% (2,080)Unmarried:
6.8% (151)
Women who did not give birth in the past 12 months Now married:
22.0% (19,864)Unmarried:
78.0% (70,343)
Marital status - Hispanic or Latino population 15 years and over
Males 55.1% Never married34.5% Now married3.4% Separated0.8% Widowed6.3% DivorcedFemales 49.8% Never married29.8% Now married6.2% Separated4.1% Widowed10.1% DivorcedWomen who gave birth in the past 12 months Now married:
55.8% (1,180)Unmarried:
44.2% (935)
Women who did not give birth in the past 12 months Now married:
27.0% (9,383)Unmarried:
73.0% (25,412)
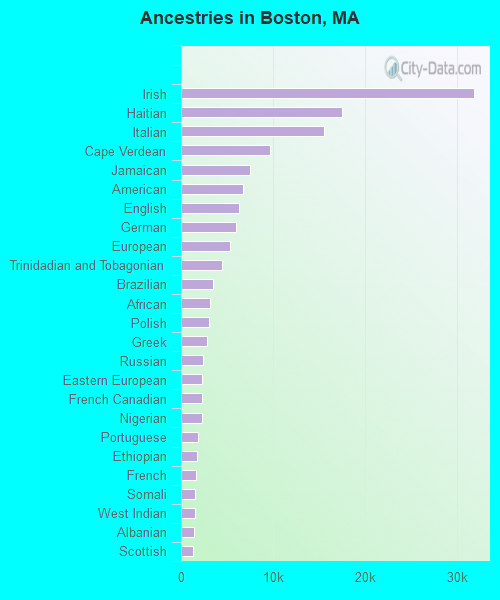
Ancestries in Boston
31,827 8.6% Irish17,465 4.7% Haitian15,525 4.2% Italian9,604 2.6% Cape Verdean7,448 2.0% Jamaican6,776 1.8% American6,332 1.7% English5,923 1.6% German5,350 1.4% European4,489 1.2% Trinidadian and Tobagonian3,449 0.9% Brazilian3,098 0.8% African3,038 0.8% Polish2,787 0.8% Greek2,385 0.6% Russian2,288 0.6% Eastern European2,258 0.6% French Canadian2,230 0.6% Nigerian1,878 0.5% Portuguese1,699 0.5% Ethiopian1,664 0.4% French1,569 0.4% Somali1,485 0.4% West Indian1,439 0.4% Albanian1,278 0.3% Scottish1,268 0.3% Moroccan1,143 0.3% British West Indian1,069 0.3% Barbadian1,060 0.3% Iranian993 0.3% Turkish957 0.3% Ukrainian746 0.2% Kenyan708 0.2% Swedish685 0.2% Norwegian679 0.2% Romanian660 0.2% British657 0.2% Scotch-Irish641 0.2% Lebanese600 0.2% Armenian561 0.2% Ghanaian533 0.1% Sierra Leonean523 0.1% Canadian497 0.1% Hungarian459 0.1% Northern European428 0.1% Lithuanian418 0.1% Dutch392 0.1% Swiss381 0.1% Serbian374 0.1% Danish363 0.10% Israeli341 0.09% Egyptian332 0.09% Guyanese317 0.09% Syrian267 0.07% Afghan253 0.07% Palestinian247 0.07% Bulgarian220 0.06% South African211 0.06% Latvian210 0.06% Czech205 0.06% Belgian190 0.05% Arab177 0.05% Scandinavian173 0.05% Slovak170 0.05% Finnish166 0.04% Belizean166 0.04% Welsh115 0.03% Liberian99 0.03% Jordanian97 0.03% Zimbabwean94 0.03% Ugandan87 0.02% Yugoslavian74 0.02% Austrian73 0.02% Sudanese68 0.02% Croatian63 0.02% Cypriot60 0.02% German Russian56 0.02% U.S. Virgin Islander55 0.01% Australian52 0.01% Slavic48 0.01% Iraqi47 0.01% Bermudan35 0.01% Estonian30 0.01% Slovene28 0.01% Maltese22 0.01% Assyrian
Geographical mobility in Boston Same house 1 year ago 216,845 74.4% White (Caucasian)117,144 85.6% Black or African American3,643 83.9% American Indian / Alaska Native46,791 73.5% Asian542 93.6% Native Hawaiian / Pacific Islander40,523 83.5% Other race80,783 81.6% Two or more races209,068 74.7% White alone, not Hispanic / Latino105,089 82.1% Hispanic or LatinoMoved within same county 27,951 9.6% White / Caucasian11,121 8.1% Black or African American305 7.0% American Indian / Alaska Native5,547 8.7% Asian32 5.6% Native Hawaiian / Pacific Islander3,519 7.3% Other race8,325 8.4% Two or more races27,222 9.7% White alone, not Hispanic / Latino9,178 7.2% Hispanic or LatinoMoved within same state 18,974 6.5% White / Caucasian3,255 2.4% Black or African American260 6.0% American Indian / Alaska Native2,049 3.2% Asian1,818 3.7% Other race2,987 3.0% Two or more races17,799 6.4% White alone, not Hispanic / Latino5,026 3.9% Hispanic or LatinoMoved from different state 24,246 8.3% White / Caucasian3,315 2.4% Black or African American99 2.3% American Indian / Alaska Native5,269 8.3% Asian8 1.5% Native Hawaiian / Pacific Islander1,536 3.2% Other race5,226 5.3% Two or more races22,842 8.2% White alone, not Hispanic / Latino5,525 4.3% Hispanic or LatinoMoved from abroad 3,367 1.2% White1,993 1.5% Black or African American16 0.4% American Indian / Alaska Native3,980 6.3% Asian1,141 2.4% Other race1,707 1.7% Two or more races2,932 1.0% White alone, not Hispanic / Latino3,175 2.5% Hispanic or Latino
Children Nativity (place of birth) in Boston
Children under 6 years - Living with two parents Both parents native 11,717 100.0% NativeBoth parents foreign-born 6,678 88.3% Native886 11.7% Foreign-bornOne native, one foreign-born parent 4,310 97.2% Native126 2.8% Foreign-bornChildren under 6 years - Living with one parent Native parent 7,092 100.0% NativeForeign-born parent 4,236 96.3% Native163 3.7% Foreign-bornChildren 6 to 17 years - Living with two parents Both parents native 10,467 99.6% Native45 0.4% Foreign-bornBoth parents foreign-born 8,668 69.2% Native3,856 30.8% Foreign-bornOne native, one foreign-born parent 4,476 97.7% Native107 2.3% Foreign-bornChildren 6 to 17 years - Living with one parent Native parent 16,513 100.0% NativeForeign-born parent 14,060 55.7% Native11,203 44.3% Foreign-born
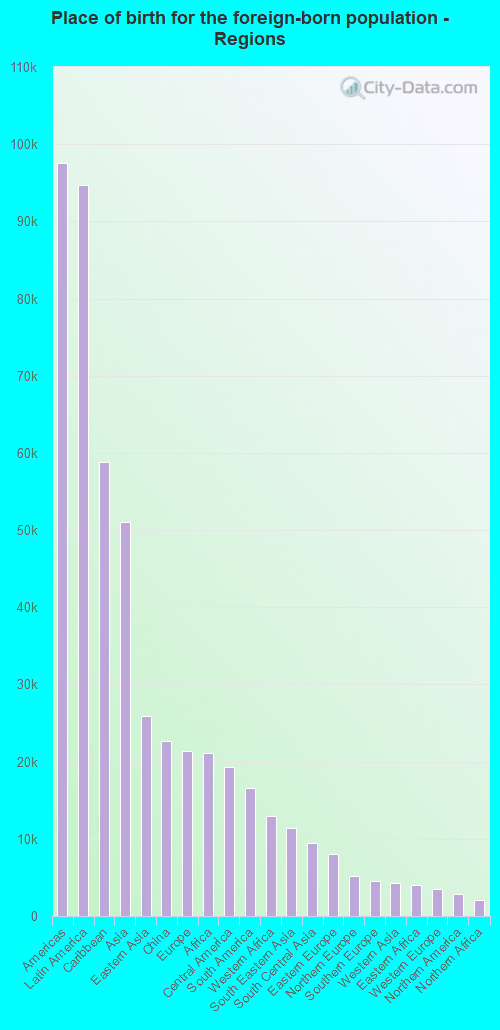
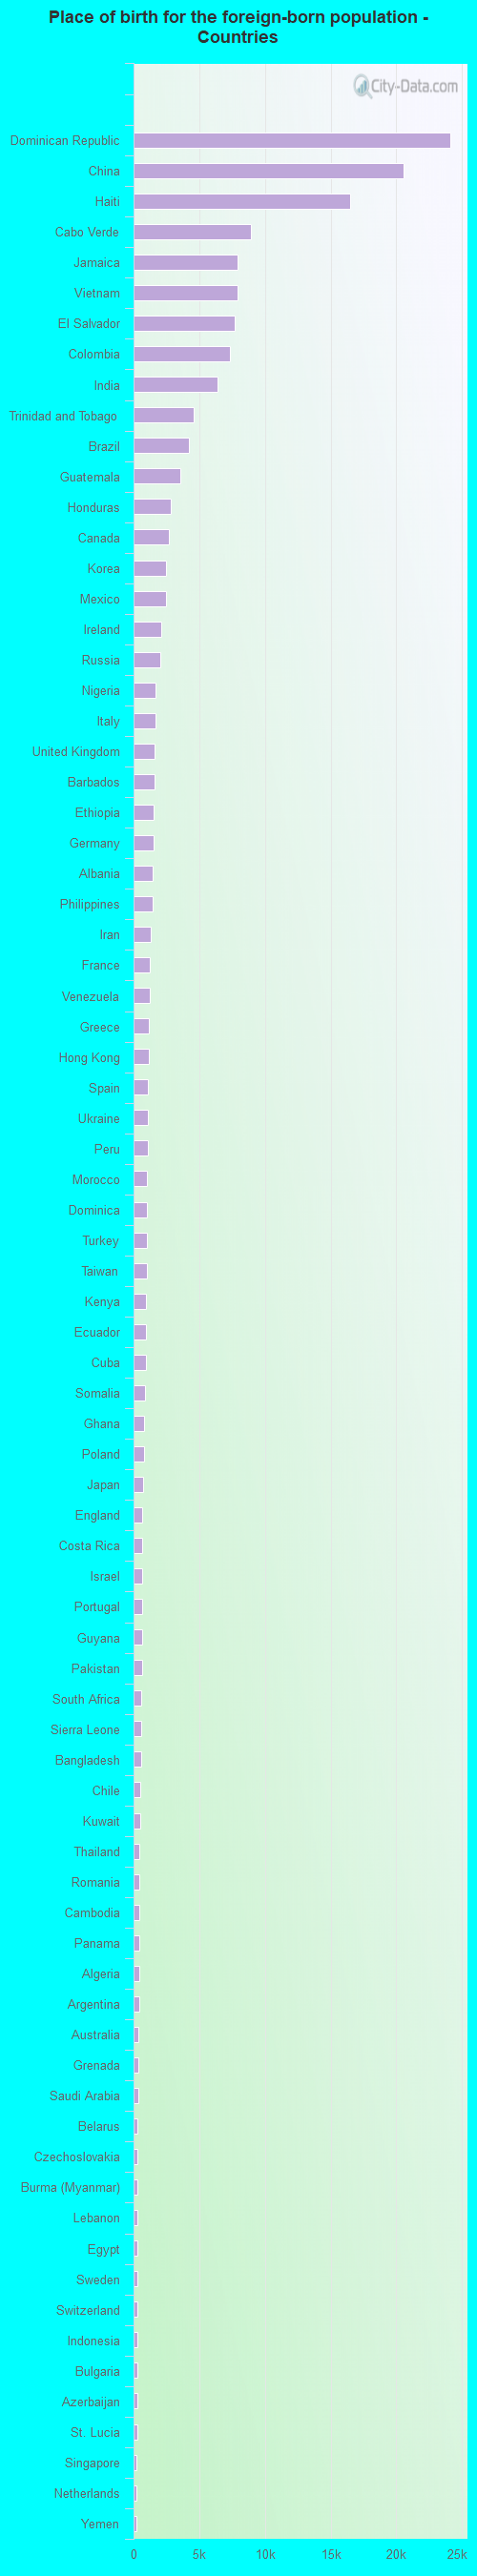
Place of birth for residents in Boston 97,577 Americas94,740 Latin America58,882 Caribbean51,098 Asia25,900 Eastern Asia22,709 China21,331 Europe21,115 Africa19,250 Central America16,607 South America12,911 Western Africa11,338 South Eastern Asia9,514 South Central Asia7,994 Eastern Europe5,178 Northern Europe4,538 Southern Europe4,216 Western Asia4,053 Eastern Africa3,521 Western Europe2,837 Northern America2,012 Northern Africa821 Middle Africa607 Southern Africa587 Oceania587 Australia and New Zealand Subregion24,135 Dominican Republic20,576 China16,519 Haiti8,966 Cabo Verde7,895 Jamaica7,894 Vietnam7,668 El Salvador7,303 Colombia6,360 India4,575 Trinidad and Tobago4,199 Brazil3,528 Guatemala2,848 Honduras2,651 Canada2,468 Korea2,444 Mexico2,141 Ireland2,066 Russia1,704 Nigeria1,636 Italy1,591 United Kingdom1,563 Barbados1,559 Ethiopia1,507 Germany1,435 Albania1,419 Philippines1,284 Iran1,248 France1,224 Venezuela1,154 Greece1,132 Hong Kong1,110 Spain1,104 Ukraine1,069 Peru1,031 Morocco1,027 Dominica1,001 Turkey1,000 Taiwan971 Kenya951 Ecuador939 Cuba886 Somalia784 Ghana779 Poland703 Japan687 England665 Costa Rica659 Israel637 Portugal632 Guyana625 Pakistan596 South Africa565 Sierra Leone562 Bangladesh522 Chile519 Kuwait467 Thailand464 Romania459 Cambodia447 Panama423 Algeria403 Argentina396 Australia346 Grenada335 Saudi Arabia325 Belarus321 Czechoslovakia317 Burma (Myanmar)316 Lebanon300 Egypt293 Sweden285 Switzerland277 Indonesia262 Bulgaria262 Azerbaijan261 St. Lucia246 Singapore240 Netherlands228 Yemen214 West Indies212 Malaysia198 Nepal191 New Zealand190 Scotland187 Hungary187 Bolivia178 St. Vincent and the Grenadines177 Cameroon174 Nicaragua173 Denmark160 Uganda160 Syria158 Belgium155 Serbia137 Sri Lanka135 Kazakhstan134 Latvia131 United Arab Emirates124 Liberia121 Democratic Republic of Congo (Zaire)119 Jordan114 Eritrea110 Togo104 Bosnia and Herzegovina100 Afghanistan96 Sudan91 Croatia90 Ivory Coast83 Georgia82 Austria82 Iraq67 Bahamas66 Moldova61 Armenia61 Lithuania55 Uzbekistan49 Zimbabwe47 Azores Islands44 Laos43 Norway42 Belize34 Tanzania32 Senegal21 North Macedonia (Macedonia)12 Congo3 Uruguay
Grandparents responsible for own grandchildren in Boston
Grandparents (30 to 59 years) White / Caucasian 263 53.5% Responsible for grandchildren228 46.5% Not responsible for grandchildrenBlack or African American 311 31.3% Responsible for grandchildren684 68.7% Not responsible for grandchildrenAmerican Indian / Alaska Native 39 100.0% Not responsible for grandchildrenAsian 37 14.9% Responsible for grandchildren214 85.1% Not responsible for grandchildrenOther race 167 25.2% Responsible for grandchildren497 74.8% Not responsible for grandchildrenTwo or more races 232 38.9% Responsible for grandchildren364 61.1% Not responsible for grandchildrenWhite alone, not Hispanic / Latino 225 57.8% Responsible for grandchildren164 42.2% Not responsible for grandchildrenHispanic or Latino 317 21.0% Responsible for grandchildren1,196 79.0% Not responsible for grandchildrenGrandparents (60 years and over) White / Caucasian 216 14.9% Responsible for grandchildren1,231 85.1% Not responsible for grandchildrenBlack or African American 1,128 45.4% Responsible for grandchildren1,355 54.6% Not responsible for grandchildrenAsian 55 5.2% Responsible for grandchildren1,004 94.8% Not responsible for grandchildrenOther race 98 18.8% Responsible for grandchildren423 81.2% Not responsible for grandchildrenTwo or more races 463 27.1% Responsible for grandchildren1,244 72.9% Not responsible for grandchildrenWhite alone, not Hispanic / Latino 198 29.7% Responsible for grandchildren468 70.3% Not responsible for grandchildrenHispanic or Latino 286 15.1% Responsible for grandchildren1,603 84.9% Not responsible for grandchildren
Zip codes: 02108 , 02109 , 02110 , 02111 , 02113 , 02114 , 02115 , 02116 , 02118 , 02119 , 02120 , 02121 , 02122 , 02124 , 02125 , 02126 , 02127 , 02128 , 02129 , 02130 , 02131 , 02132 , 02134 , 02135 , 02136 , 02151 , 02152 , 02163 , 02199 , 02203, 02210 , 02215 , 02467 .