Races in Bonneville, Washington (WA) Detailed Stats
Ancestries, Foreign-born residents, place of birth
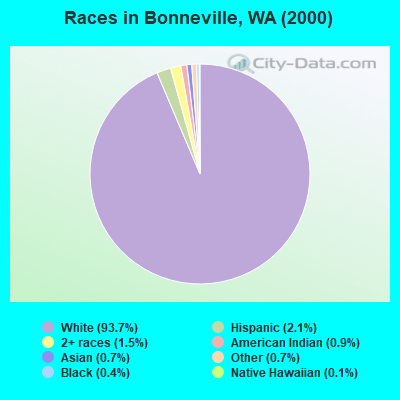
Race distribution in Bonneville

- 3,26593.7%White alone
- 722.1%Hispanic
- 511.5%Two or more races
- 310.9%American Indian alone
- 250.7%Asian alone
- 250.7%Other race alone
- 130.4%Black alone
- 40.1%Native Hawaiian and Other
Pacific Islander alone
2000
2022
-
- 4,652,49078.9%White alone
- 441,5097.5%Hispanic
- 319,4015.4%Asian alone
- 184,6313.1%Black alone
- 175,9263.0%Two or more races
- 85,3961.4%American Indian alone
- 22,7790.4%Native Hawaiian and Other
Pacific Islander alone - 11,9890.2%Other race alone

-
- 4,941,45663.5%White alone
- 1,093,31314.0%Hispanic
- 755,8329.7%Asian alone
- 523,4486.7%Two or more races
- 299,5373.8%Black alone
- 69,0240.9%American Indian alone
- 52,2310.7%Native Hawaiian and Other
Pacific Islander alone - 50,9450.7%Other race alone

Income and house value in Bonneville
- Median household income in 2022
- $89,264White non-Hispanic householders
- $94,669Black householders
- $87,721American Indian and Alaska Native householders
- $57,863Asian householders
- $55,022Some other race householders
- $101,165Two or more races householders
- $80,630Hispanic or Latino race householders
- Median 2022 house value
- $641,802White Non-Hispanic householders
- $507,463Black or African American householders
- $304,478American Indian or Alaska Native householders
- $830,394Some other race householders
- $784,261Two or more races householders
- $830,394Hispanic or Latino householders
Household income for White non-Hispanic householders

Household income for Black householders

Household income for American Indian and Alaska Native householders

Household income for Asian householders

Household income for Two or more races householders

Household income for Hispanic or Latino race householders

Zip code: 98648