Races in Bluffdale, Utah (UT) Detailed Stats
Data:
Races - White alone (%)
Races - White alone (% change since 2000)
Races - Black alone (%)
Races - Black alone (% change since 2000)
Races - American Indian alone (%)
Races - American Indian alone (% change since 2000)
Races - Asian alone (%)
Races - Asian alone (% change since 2000)
Races - Hispanic (%)
Races - Hispanic (% change since 2000)
Races - Native Hawaiian and Other Pacific Islander alone (%)
Races - Native Hawaiian and Other Pacific Islander alone (% change since 2000)
Races - Two or more races(%)
Races - Two or more races(% change since 2000)
Races - Other race alone (%)
Races - Other race alone (% change since 2000)
Racial diversity
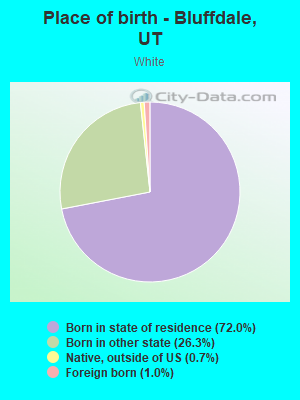
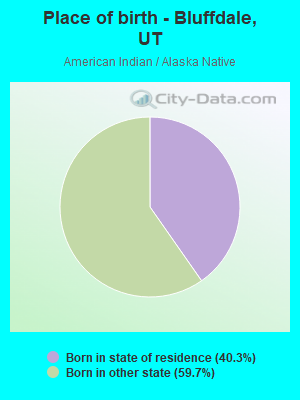
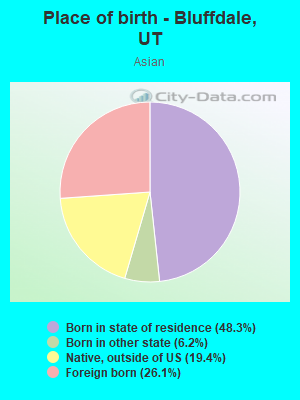
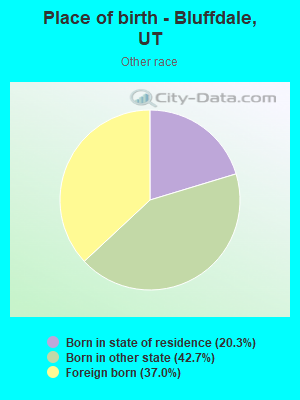
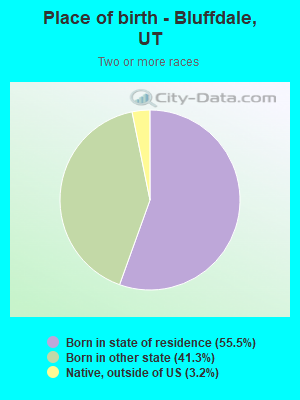
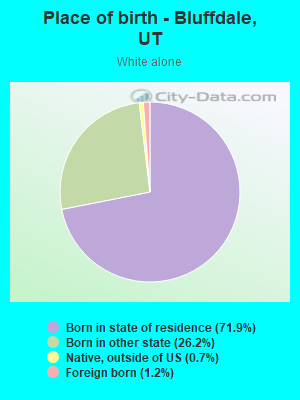
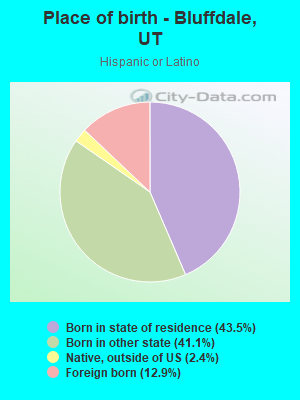
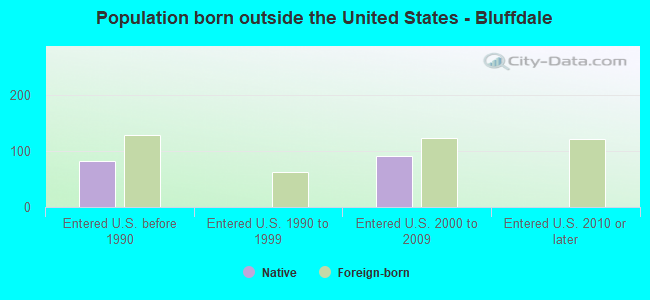
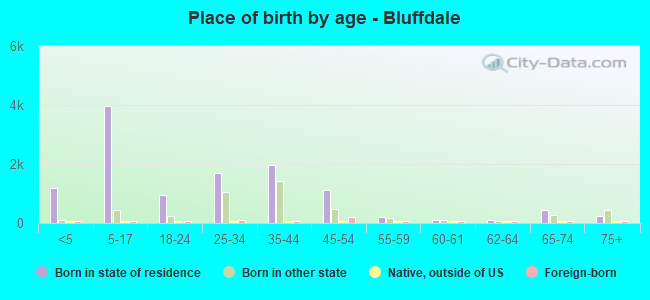
Place of birth - Born in state of residence (%)
Place of birth - Born in state of residence (%) - White
Place of birth - Born in state of residence (%) - Black or African American
Place of birth - Born in state of residence (%) - Asian
Place of birth - Born in state of residence (%) - Hispanic or Latino
Place of birth - Born in state of residence (%) - American Indian and Alaska Native
Place of birth - Born in state of residence (%) - Multirace
Place of birth - Born in state of residence (%) - Other Race
Place of birth - Born in other state (%)
Place of birth - Born in other state (%) - White
Place of birth - Born in other state (%) - Black or African American
Place of birth - Born in other state (%) - Asian
Place of birth - Born in other state (%) - Hispanic or Latino
Place of birth - Born in other state (%) - American Indian and Alaska Native
Place of birth - Born in other state (%) - Multirace
Place of birth - Born in other state (%) - Other Race
Place of birth - Native, outside of US (%)
Place of birth - Native, outside of US (%) - White
Place of birth - Native, outside of US (%) - Black or African American
Place of birth - Native, outside of US (%) - Asian
Place of birth - Native, outside of US (%) - Hispanic or Latino
Place of birth - Native, outside of US (%) - American Indian and Alaska Native
Place of birth - Native, outside of US (%) - Multirace
Place of birth - Native, outside of US (%) - Other Race
Place of birth - Foreign born (%)
Place of birth - Foreign born (%) - White
Place of birth - Foreign born (%) - Black or African American
Place of birth - Foreign born (%) - Asian
Place of birth - Foreign born (%) - Hispanic or Latino
Place of birth - Foreign born (%) - American Indian and Alaska Native
Place of birth - Foreign born (%) - Multirace
Place of birth - Foreign born (%) - Other Race
Residents speaking English at home (%)
Residents speaking English at home - Born in the United States (%)
Residents speaking English at home - Native, born elsewhere (%)
Residents speaking English at home - Foreign born (%)
Residents speaking Spanish at home (%)
Residents speaking Spanish at home - Born in the United States (%)
Residents speaking Spanish at home - Native, born elsewhere (%)
Residents speaking Spanish at home - Foreign born (%)
Residents speaking other language at home (%)
Residents speaking other language at home - Born in the United States (%)
Residents speaking other language at home - Native, born elsewhere (%)
Residents speaking other language at home - Foreign born (%)
Marital status - Never married (%)
Marital status - Now married (%)
Marital status - Separated (%)
Marital status - Widowed (%)
Marital status - Divorced (%)
Ancestries Reported - Arab (%)
Ancestries Reported - Czech (%)
Ancestries Reported - Danish (%)
Ancestries Reported - Dutch (%)
Ancestries Reported - English (%)
Ancestries Reported - French (%)
Ancestries Reported - French Canadian (%)
Ancestries Reported - German (%)
Ancestries Reported - Greek (%)
Ancestries Reported - Hungarian (%)
Ancestries Reported - Irish (%)
Ancestries Reported - Italian (%)
Ancestries Reported - Lithuanian (%)
Ancestries Reported - Norwegian (%)
Ancestries Reported - Polish (%)
Ancestries Reported - Portuguese (%)
Ancestries Reported - Russian (%)
Ancestries Reported - Scotch-Irish (%)
Ancestries Reported - Scottish (%)
Ancestries Reported - Slovak (%)
Ancestries Reported - Subsaharan African (%)
Ancestries Reported - Swedish (%)
Ancestries Reported - Swiss (%)
Ancestries Reported - Ukrainian (%)
Ancestries Reported - United States (%)
Ancestries Reported - Welsh (%)
Ancestries Reported - West Indian (%)
Ancestries Reported - Other (%)
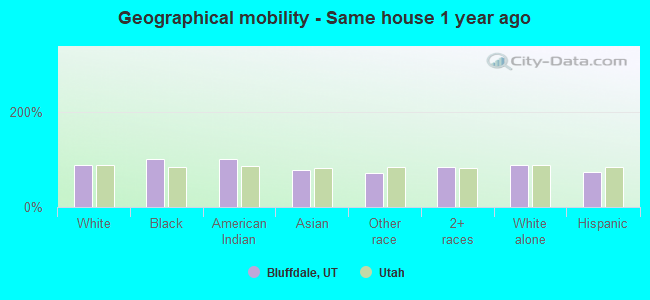
Geographical mobility - Same house 1 year ago (%)
Geographical mobility - Same house 1 year ago (%) - White
Geographical mobility - Same house 1 year ago (%) - Black or African American
Geographical mobility - Same house 1 year ago (%) - Asian
Geographical mobility - Same house 1 year ago (%) - Hispanic or Latino
Geographical mobility - Same house 1 year ago (%) - American Indian and Alaska Native
Geographical mobility - Same house 1 year ago (%) - Multirace
Geographical mobility - Same house 1 year ago (%) - Other Race
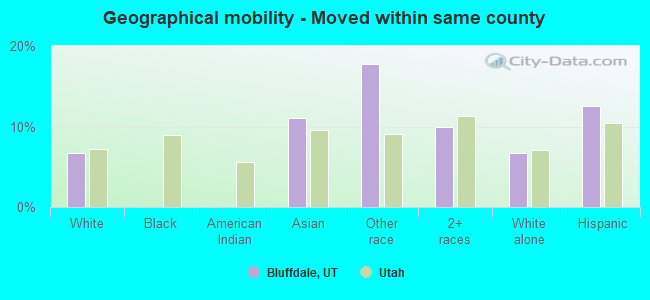
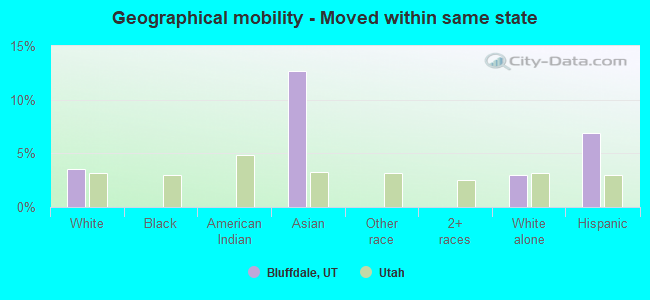
Geographical mobility - Moved within same county (%)
Geographical mobility - Moved within same county (%) - White
Geographical mobility - Moved within same county (%) - Black or African American
Geographical mobility - Moved within same county (%) - Asian
Geographical mobility - Moved within same county (%) - Hispanic or Latino
Geographical mobility - Moved within same county (%) - American Indian and Alaska Native
Geographical mobility - Moved within same county (%) - Multirace
Geographical mobility - Moved within same county (%) - Other Race
Geographical mobility - Moved from different county within same state (%)
Geographical mobility - Moved from different county within same state (%) - White
Geographical mobility - Moved from different county within same state (%) - Black or African American
Geographical mobility - Moved from different county within same state (%) - Asian
Geographical mobility - Moved from different county within same state (%) - Hispanic or Latino
Geographical mobility - Moved from different county within same state (%) - American Indian and Alaska Native
Geographical mobility - Moved from different county within same state (%) - Multirace
Geographical mobility - Moved from different county within same state (%) - Other Race
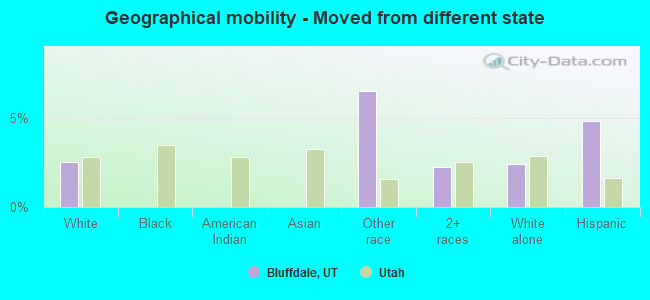
Geographical mobility - Moved from different state (%)
Geographical mobility - Moved from different state (%) - White
Geographical mobility - Moved from different state (%) - Black or African American
Geographical mobility - Moved from different state (%) - Asian
Geographical mobility - Moved from different state (%) - Hispanic or Latino
Geographical mobility - Moved from different state (%) - American Indian and Alaska Native
Geographical mobility - Moved from different state (%) - Multirace
Geographical mobility - Moved from different state (%) - Other Race
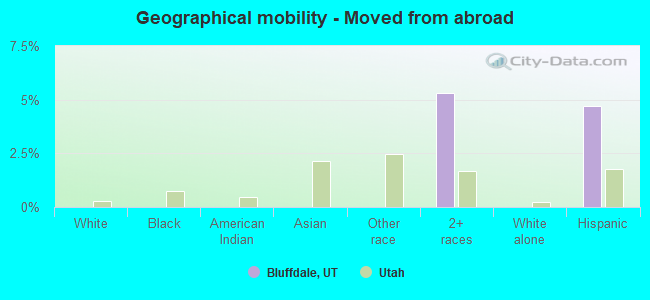
Geographical mobility - Moved from abroad (%)
Geographical mobility - Moved from abroad (%) - White
Geographical mobility - Moved from abroad (%) - Black or African American
Geographical mobility - Moved from abroad (%) - Asian
Geographical mobility - Moved from abroad (%) - Hispanic or Latino
Geographical mobility - Moved from abroad (%) - American Indian and Alaska Native
Geographical mobility - Moved from abroad (%) - Multirace
Geographical mobility - Moved from abroad (%) - Other Race
Place of birth for the foreign-born population - Ireland (%)
Place of birth for the foreign-born population - Denmark (%)
Place of birth for the foreign-born population - Norway (%)
Place of birth for the foreign-born population - Sweden (%)
Place of birth for the foreign-born population - United Kingdom (%)
Place of birth for the foreign-born population - England (%)
Place of birth for the foreign-born population - Scotland (%)
Place of birth for the foreign-born population - Other Northern Europe (%)
Place of birth for the foreign-born population - Austria (%)
Place of birth for the foreign-born population - Belgium (%)
Place of birth for the foreign-born population - France (%)
Place of birth for the foreign-born population - Germany (%)
Place of birth for the foreign-born population - Netherlands (%)
Place of birth for the foreign-born population - Switzerland (%)
Place of birth for the foreign-born population - Other Western Europe (%)
Place of birth for the foreign-born population - Greece (%)
Place of birth for the foreign-born population - Italy (%)
Place of birth for the foreign-born population - Portugal (%)
Place of birth for the foreign-born population - Spain (%)
Place of birth for the foreign-born population - Other Southern Europe (%)
Place of birth for the foreign-born population - Albania (%)
Place of birth for the foreign-born population - Belarus (%)
Place of birth for the foreign-born population - Bosnia and Herzegovina (%)
Place of birth for the foreign-born population - Bulgaria (%)
Place of birth for the foreign-born population - Croatia (%)
Place of birth for the foreign-born population - Czechoslovakia (%)
Place of birth for the foreign-born population - Hungary (%)
Place of birth for the foreign-born population - Latvia (%)
Place of birth for the foreign-born population - Lithuania (%)
Place of birth for the foreign-born population - North Macedonia (Macedonia) (%)
Place of birth for the foreign-born population - Moldova (%)
Place of birth for the foreign-born population - Poland (%)
Place of birth for the foreign-born population - Romania (%)
Place of birth for the foreign-born population - Russia (%)
Place of birth for the foreign-born population - Serbia (%)
Place of birth for the foreign-born population - Ukraine (%)
Place of birth for the foreign-born population - Other Eastern Europe (%)
Place of birth for the foreign-born population - China (%)
Place of birth for the foreign-born population - Hong Kong (%)
Place of birth for the foreign-born population - Taiwan (%)
Place of birth for the foreign-born population - Japan (%)
Place of birth for the foreign-born population - Korea (%)
Place of birth for the foreign-born population - Other Eastern Asia (%)
Place of birth for the foreign-born population - Afghanistan (%)
Place of birth for the foreign-born population - Bangladesh (%)
Place of birth for the foreign-born population - India (%)
Place of birth for the foreign-born population - Iran (%)
Place of birth for the foreign-born population - Kazakhstan (%)
Place of birth for the foreign-born population - Nepal (%)
Place of birth for the foreign-born population - Pakistan (%)
Place of birth for the foreign-born population - Sri Lanka (%)
Place of birth for the foreign-born population - Uzbekistan (%)
Place of birth for the foreign-born population - Other South Central Asia (%)
Place of birth for the foreign-born population - Burma (%)
Place of birth for the foreign-born population - Cambodia (%)
Place of birth for the foreign-born population - Indonesia (%)
Place of birth for the foreign-born population - Laos (%)
Place of birth for the foreign-born population - Malaysia (%)
Place of birth for the foreign-born population - Philippines (%)
Place of birth for the foreign-born population - Singapore (%)
Place of birth for the foreign-born population - Thailand (%)
Place of birth for the foreign-born population - Vietnam (%)
Place of birth for the foreign-born population - Other South Eastern Asia (%)
Place of birth for the foreign-born population - Armenia (%)
Place of birth for the foreign-born population - Iraq (%)
Place of birth for the foreign-born population - Israel (%)
Place of birth for the foreign-born population - Jordan (%)
Place of birth for the foreign-born population - Kuwait (%)
Place of birth for the foreign-born population - Lebanon (%)
Place of birth for the foreign-born population - Saudi Arabia (%)
Place of birth for the foreign-born population - Syria (%)
Place of birth for the foreign-born population - Turkey (%)
Place of birth for the foreign-born population - Yemen (%)
Place of birth for the foreign-born population - Other Western Asia (%)
Place of birth for the foreign-born population - Eritrea (%)
Place of birth for the foreign-born population - Ethiopia (%)
Place of birth for the foreign-born population - Kenya (%)
Place of birth for the foreign-born population - Somalia (%)
Place of birth for the foreign-born population - Uganda (%)
Place of birth for the foreign-born population - Zimbabwe (%)
Place of birth for the foreign-born population - Other Eastern Africa (%)
Place of birth for the foreign-born population - Cameroon (%)
Place of birth for the foreign-born population - Congo (%)
Place of birth for the foreign-born population - Democratic Republic of Congo (Zaire) (%)
Place of birth for the foreign-born population - Other Middle Africa (%)
Place of birth for the foreign-born population - Egypt (%)
Place of birth for the foreign-born population - Morocco (%)
Place of birth for the foreign-born population - Sudan (%)
Place of birth for the foreign-born population - Other Northern Africa (%)
Place of birth for the foreign-born population - South Africa (%)
Place of birth for the foreign-born population - Other Southern Africa (%)
Place of birth for the foreign-born population - Cabo Verde (%)
Place of birth for the foreign-born population - Ghana (%)
Place of birth for the foreign-born population - Liberia (%)
Place of birth for the foreign-born population - Nigeria (%)
Place of birth for the foreign-born population - Senegal (%)
Place of birth for the foreign-born population - Sierra Leone (%)
Place of birth for the foreign-born population - Other Western Africa (%)
Place of birth for the foreign-born population - Australia (%)
Place of birth for the foreign-born population - New Zealand (%)
Place of birth for the foreign-born population - Fiji (%)
Place of birth for the foreign-born population - Micronesia (%)
Place of birth for the foreign-born population - Bahamas (%)
Place of birth for the foreign-born population - Barbados (%)
Place of birth for the foreign-born population - Cuba (%)
Place of birth for the foreign-born population - Dominica (%)
Place of birth for the foreign-born population - Dominican Republic (%)
Place of birth for the foreign-born population - Grenada (%)
Place of birth for the foreign-born population - Haiti (%)
Place of birth for the foreign-born population - Jamaica (%)
Place of birth for the foreign-born population - St. Vincent and the Grenadines (%)
Place of birth for the foreign-born population - Trinidad and Tobago (%)
Place of birth for the foreign-born population - West Indies (%)
Place of birth for the foreign-born population - Other Caribbean (%)
Place of birth for the foreign-born population - Belize (%)
Place of birth for the foreign-born population - Costa Rica (%)
Place of birth for the foreign-born population - El Salvador (%)
Place of birth for the foreign-born population - Guatemala (%)
Place of birth for the foreign-born population - Honduras (%)
Place of birth for the foreign-born population - Mexico (%)
Place of birth for the foreign-born population - Nicaragua (%)
Place of birth for the foreign-born population - Panama (%)
Place of birth for the foreign-born population - Other Central America (%)
Place of birth for the foreign-born population - Argentina (%)
Place of birth for the foreign-born population - Bolivia (%)
Place of birth for the foreign-born population - Brazil (%)
Place of birth for the foreign-born population - Chile (%)
Place of birth for the foreign-born population - Colombia (%)
Place of birth for the foreign-born population - Ecuador (%)
Place of birth for the foreign-born population - Guyana (%)
Place of birth for the foreign-born population - Peru (%)
Place of birth for the foreign-born population - Uruguay (%)
Place of birth for the foreign-born population - Venezuela (%)
Place of birth for the foreign-born population - Other South America (%)
Place of birth for the foreign-born population - Canada (%)
Place of birth for the foreign-born population - Other Northern America (%)
Place of birth for the foreign-born population - Other (%)
Latest news about races in Bluffdale, UT collected exclusively by city-data.com from local newspapers, TV, and radio stations
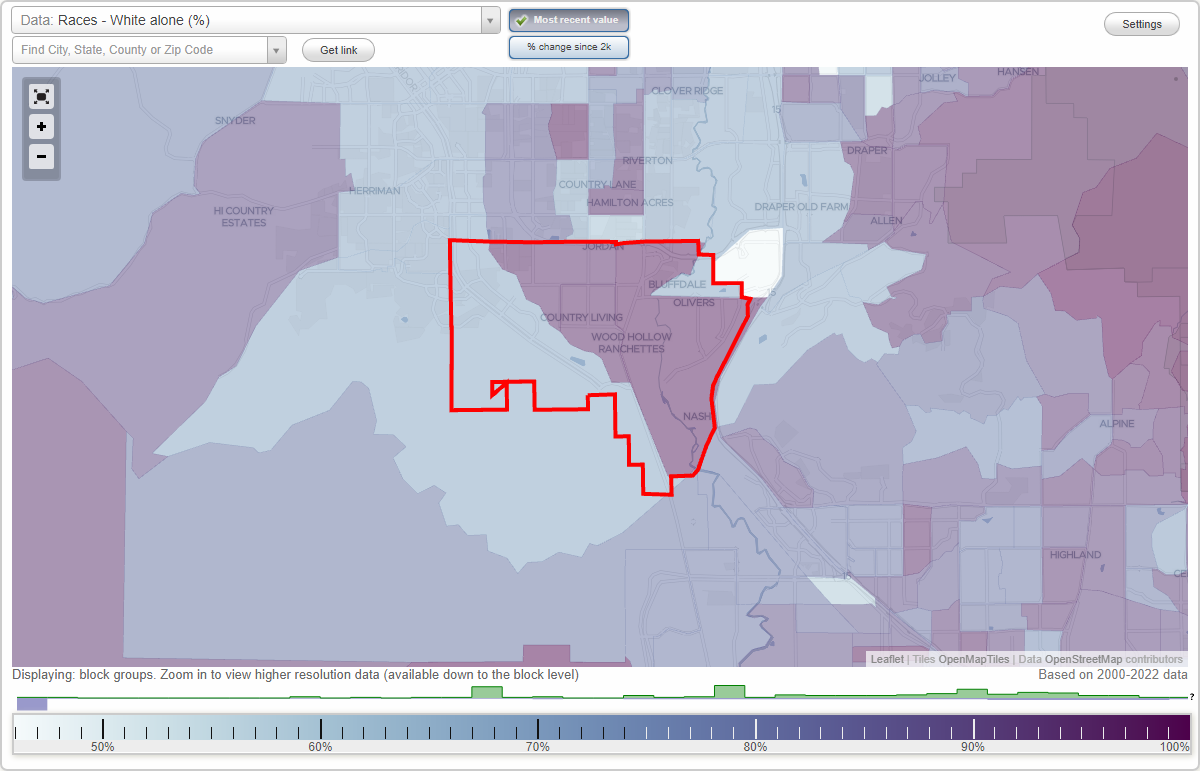
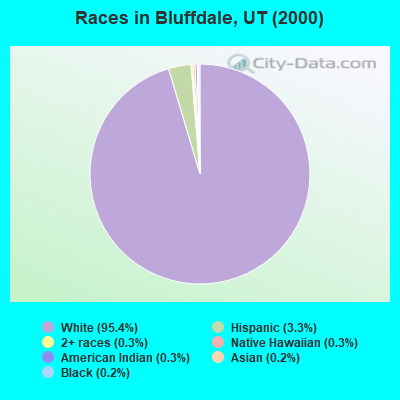
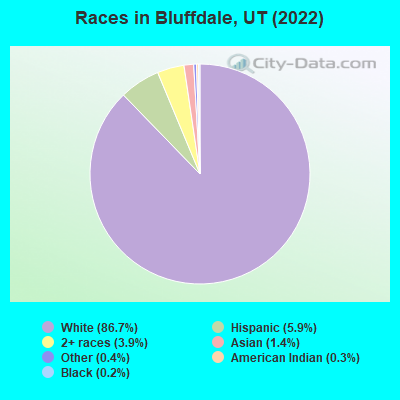
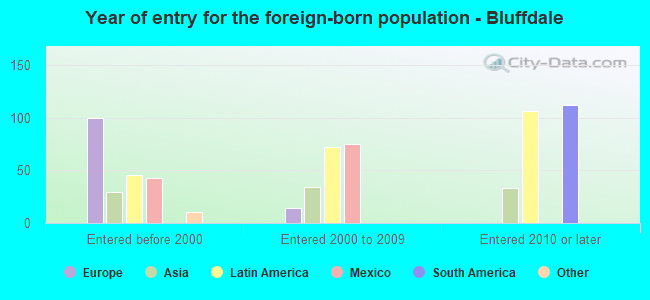
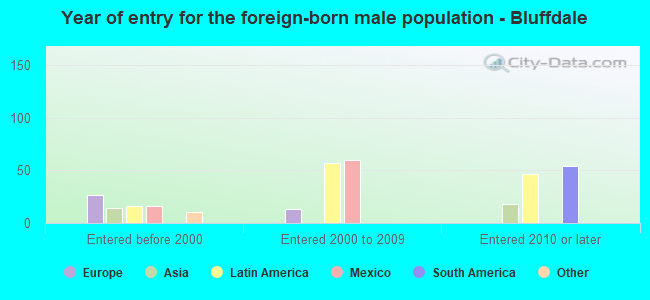
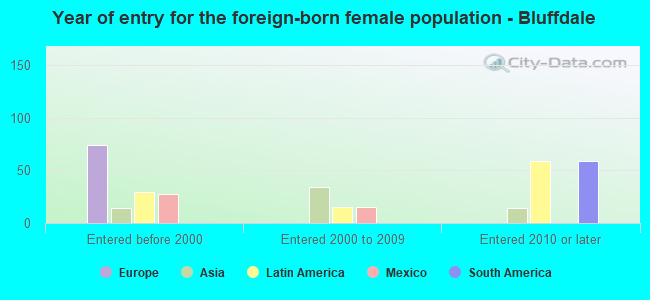
According to 2022 data, the most numerous races in Bluffdale, UT are White alone (15,207 residents), Hispanic (1,030 residents), and Two or more races (688 residents). 93.4% of Bluffdale residents speak English at home. 2.6% of Bluffdale, UT residents are foreign-born (1.1% born in Latin America, 0.7% born in Europe, 0.5% born in Asia), which is 209.1% less than the foreign-born rate of 8.0% across the entire state of Utah.
Race distribution in Bluffdale
2000 2022
1,904,265 85.3% White alone 201,559 9.0% Hispanic 36,483 1.6% Asian alone 31,308 1.4% Two or more races 26,663 1.2% American Indian alone 14,806 0.7% Native Hawaiian and Other 16,137 0.7% Black alone 1,948 0.09% Other race alone
2,557,466 75.6% White alone 512,086 15.1% Hispanic 119,308 3.5% Two or more races 82,388 2.4% Asian alone 36,978 1.1% Native Hawaiian and Other 34,873 1.0% Black alone 22,803 0.7% American Indian alone 14,898 0.4% Other race alone
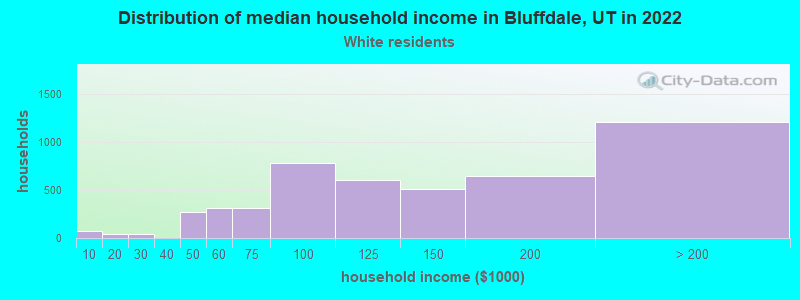
Income and house value in Bluffdale Median household income in 2022 $125,930 White non-Hispanic householders$91,048 Two or more races householders$100,381 Hispanic or Latino race householdersMedian 2022 house value $724,449 White Non-Hispanic householders$516,480 American Indian or Alaska Native householders$619,776 Two or more races householders$696,353 Hispanic or Latino householders
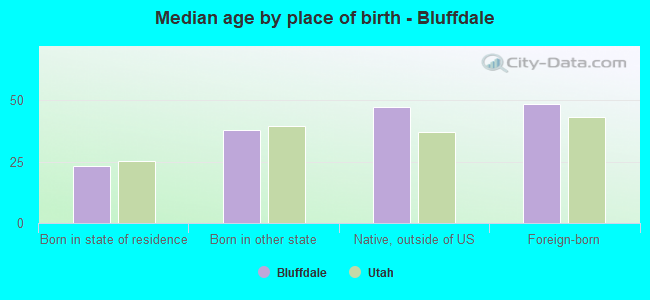
Median age by race in Bluffdale
32.7 Median age for White residents30.7 35.1 -633,713,560.8 Median age for Black or African American residents-541,371,157.9 -728,246,317.9 14.8 Median age for American Indian / Alaska Native residents-719,077,567.4 13.9 29.8 Median age for Asian residents22.9 32.8 -659,498,207.2 Median age for Native Hawaiian / Pacific Islander residents-633,333,332.7 -673,860,910.6 30.0 Median age for Other race residents21.9 29.9 19.8 Median age for Two or more races residents17.2 23.0 32.6 Median age for White alone residents30.5 35.2 29.2 Median age for Hispanic or Latino residents34.5 20.5
Owner/renter occupied households by race in Bluffdale
House owners and renters - White residents 3,872 80.9% Owner occupied912 19.1% Renter occupiedHouse owners and renters - American Indian / Alaska Native residents 31 100.0% Owner occupiedHouse owners and renters - Asian residents 33 63.1% Owner occupied19 36.9% Renter occupiedHouse owners and renters - Other race residents 61 100.0% Renter occupiedHouse owners and renters - Two or more races residents 341 89.3% Owner occupied41 10.7% Renter occupiedHouse owners and renters - White alone residents 3,847 80.3% Owner occupied944 19.7% Renter occupiedHouse owners and renters - Hispanic or Latino residents 233 91.1% Owner occupied23 8.9% Renter occupied
Language usage in Bluffdale
English speakers - Total 93.4% of residents of Bluffdale speak English at home.
3.1% of residents speak Spanish at home 474 94.4% Speak English very well28 5.6% Speak English less than very well2.6% of residents speak other language at home 360 85.3% Speak English very well62 14.7% Speak English less than very well
English speakers - Born in the United States 95.0% of residents of Bluffdale speak English at home.
3.8% of residents speak Spanish at home 149 84.2% Speak English very well28 15.8% Speak English less than very well1.0% of residents speak other language at home 46 100.0% Speak English very well
English speakers - Native, born elsewhere 78.7% of residents of Bluffdale speak English at home.
13.2% of residents speak Spanish at home 26 100.0% Speak English very well
English speakers - Foreign-born 27.9% of residents of Bluffdale speak English at home.
17.9% of residents speak Spanish at home 80 100.0% Speak English very well50.7% of residents speak other language at home 187 82.4% Speak English very well40 17.6% Speak English less than very well
White (Caucasian) - Speak only English Native:
98.4% (13,754)Foreign-born:
49.3% (77)
White (Caucasian) - Speak another language Native:
2.1% (290)Foreign-born:
54.5% (85)
Asian - Speak only English Native:
90.3% (135)Foreign-born:
61.6% (39)
Other race - Speak another language Native:
63.1% (148)Foreign-born:
96.1% (170)
White alone - Speak only English Native:
97.5% (13,682)Foreign-born:
27.3% (49)
White alone - Speak another language Native:
2.4% (343)Foreign-born:
74.2% (133)
Hispanic or Latino - Speak only English Native:
71.1% (554)Foreign-born:
34.5% (46)
Hispanic or Latino - Speak another language Native:
30.2% (235)Foreign-born:
71.6% (95)
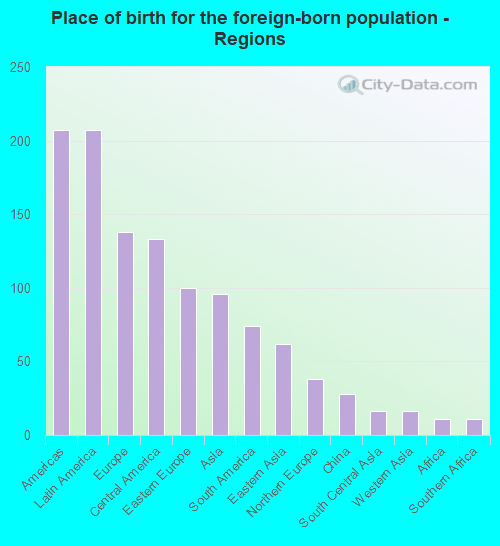
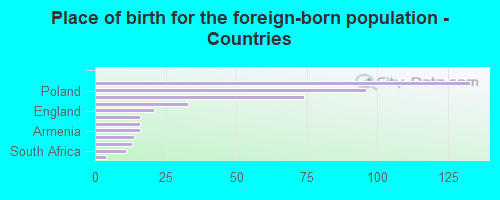
Foreign-born residents in Bluffdale 454 residents are foreign born (1.1% Latin America , 0.7% Europe , 0.5% Asia ).
Marital status for residents in Bluffdale Marital status - White (Caucasian) population 15 years and over
Males 28.8% Never married61.3% Now married0.0% Separated1.3% Widowed8.6% DivorcedFemales 23.3% Never married61.6% Now married1.2% Separated4.2% Widowed9.7% DivorcedWomen who gave birth in the past 12 months Now married:
100.0% (231)Unmarried:
0.0% (0)
Women who did not give birth in the past 12 months Now married:
58.0% (2,424)Unmarried:
42.0% (1,756)
Marital status - Asian population 15 years and over
Males 70.1% Never married29.9% Now married0.0% Separated0.0% Widowed0.0% DivorcedFemales 0.0% Never married76.4% Now married0.0% Separated0.0% Widowed23.6% DivorcedWomen who did not give birth in the past 12 months Now married:
73.4% (49)Unmarried:
26.6% (18)
Marital status - Other race population 15 years and over
Males 17.6% Never married82.4% Now married0.0% Separated0.0% Widowed0.0% DivorcedFemales 39.3% Never married60.7% Now married0.0% Separated0.0% Widowed0.0% DivorcedWomen who did not give birth in the past 12 months Now married:
51.9% (83)Unmarried:
48.1% (77)
Marital status - Two or more races population 15 years and over
Males 33.9% Never married66.1% Now married0.0% Separated0.0% Widowed0.0% DivorcedFemales 30.3% Never married39.1% Now married0.0% Separated21.8% Widowed8.8% DivorcedWomen who did not give birth in the past 12 months Now married:
50.0% (169)Unmarried:
50.0% (169)
Marital status - White alone, not Hispanic / Latino population 15 years and over
Males 29.2% Never married60.7% Now married0.0% Separated1.3% Widowed8.8% DivorcedFemales 23.4% Never married61.3% Now married1.2% Separated4.2% Widowed9.8% DivorcedWomen who gave birth in the past 12 months Now married:
100.0% (237)Unmarried:
0.0% (0)
Women who did not give birth in the past 12 months Now married:
57.8% (2,455)Unmarried:
42.2% (1,792)
Marital status - Hispanic or Latino population 15 years and over
Males 11.0% Never married89.0% Now married0.0% Separated0.0% Widowed0.0% DivorcedFemales 34.4% Never married55.4% Now married0.0% Separated10.2% Widowed0.0% DivorcedWomen who did not give birth in the past 12 months Now married:
50.9% (114)Unmarried:
49.1% (109)
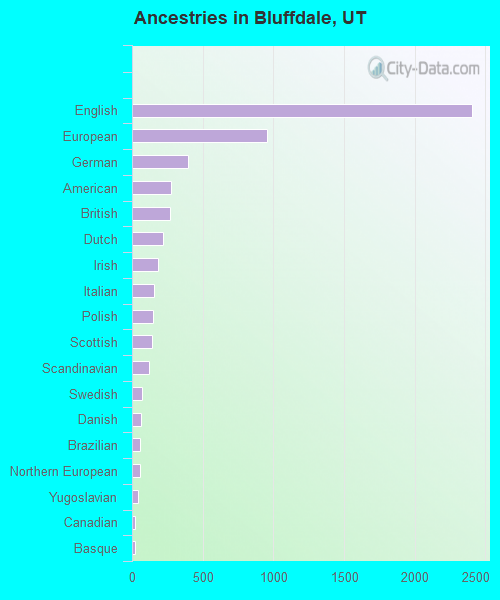
Ancestries in Bluffdale
2,405 31.3% English953 12.4% European399 5.2% German277 3.6% American272 3.5% British216 2.8% Dutch182 2.4% Irish157 2.0% Italian147 1.9% Polish145 1.9% Scottish120 1.6% Scandinavian72 0.9% Swedish64 0.8% Danish58 0.8% Brazilian58 0.8% Northern European43 0.6% Yugoslavian24 0.3% Canadian23 0.3% Basque19 0.2% Armenian18 0.2% Portuguese9 0.1% Eastern European5 0.06% French5 0.06% Greek
Children Nativity (place of birth) in Bluffdale
Children under 6 years - Living with two parents Both parents native 1,273 100.0% NativeOne native, one foreign-born parent 73 100.0% NativeChildren under 6 years - Living with one parent Native parent 305 100.0% NativeChildren 6 to 17 years - Living with two parents Both parents native 3,269 100.0% NativeBoth parents foreign-born 28 100.0% NativeOne native, one foreign-born parent 158 100.0% NativeChildren 6 to 17 years - Living with one parent Native parent 410 100.0% NativeForeign-born parent 99 51.5% Native93 48.5% Foreign-born
Grandparents responsible for own grandchildren in Bluffdale
Grandparents (30 to 59 years) White / Caucasian 8 17.2% Responsible for grandchildren37 82.8% Not responsible for grandchildrenWhite alone, not Hispanic / Latino 9 18.8% Responsible for grandchildren40 81.2% Not responsible for grandchildrenGrandparents (60 years and over) White / Caucasian 23 18.0% Responsible for grandchildren105 82.0% Not responsible for grandchildrenWhite alone, not Hispanic / Latino 23 17.2% Responsible for grandchildren111 82.8% Not responsible for grandchildren