Races in Bingham, Utah (UT) Detailed Stats
Ancestries, Foreign-born residents, place of birth
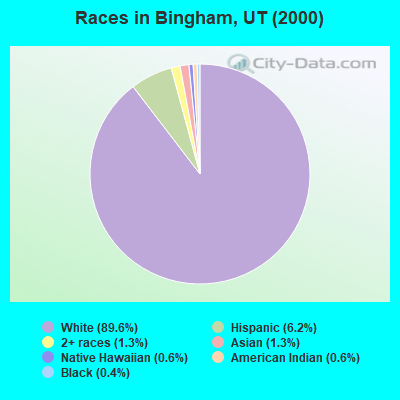
Race distribution in Bingham

- 19,49489.6%White alone
- 1,3486.2%Hispanic
- 2781.3%Two or more races
- 2761.3%Asian alone
- 1290.6%Native Hawaiian and Other
Pacific Islander alone - 1280.6%American Indian alone
- 910.4%Black alone
- 180.08%Other race alone
2000
2022
-
- 1,904,26585.3%White alone
- 201,5599.0%Hispanic
- 36,4831.6%Asian alone
- 31,3081.4%Two or more races
- 26,6631.2%American Indian alone
- 14,8060.7%Native Hawaiian and Other
Pacific Islander alone - 16,1370.7%Black alone
- 1,9480.09%Other race alone

-
- 2,557,46675.6%White alone
- 512,08615.1%Hispanic
- 119,3083.5%Two or more races
- 82,3882.4%Asian alone
- 36,9781.1%Native Hawaiian and Other
Pacific Islander alone - 34,8731.0%Black alone
- 22,8030.7%American Indian alone
- 14,8980.4%Other race alone

Income and house value in Bingham
- Median household income in 2022
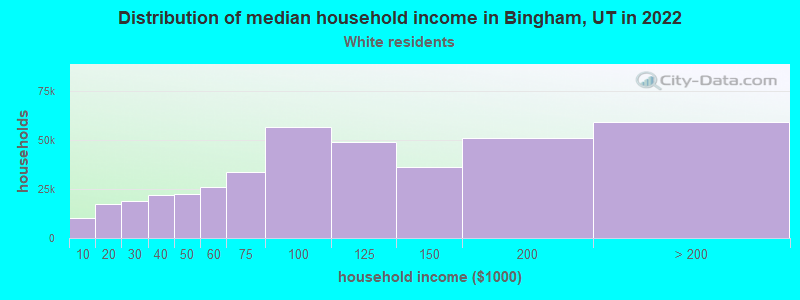
- $118,334White non-Hispanic householders
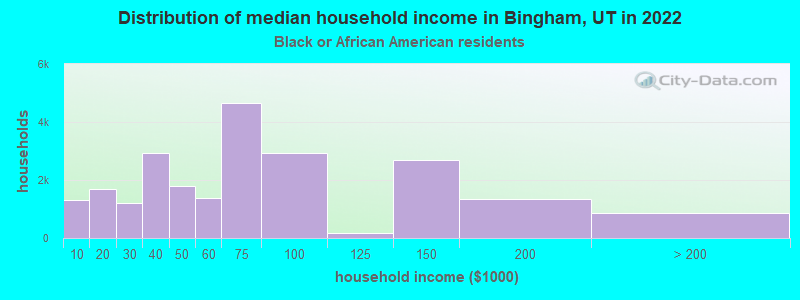
- $141,332Black householders
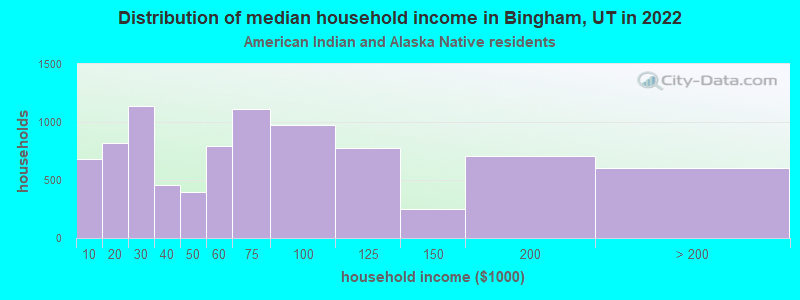
- $48,432American Indian and Alaska Native householders
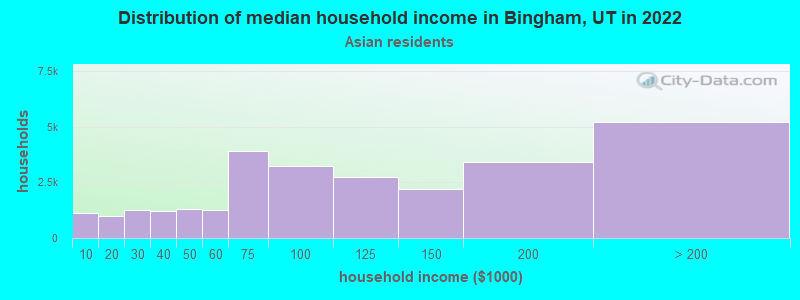
- $151,452Asian householders
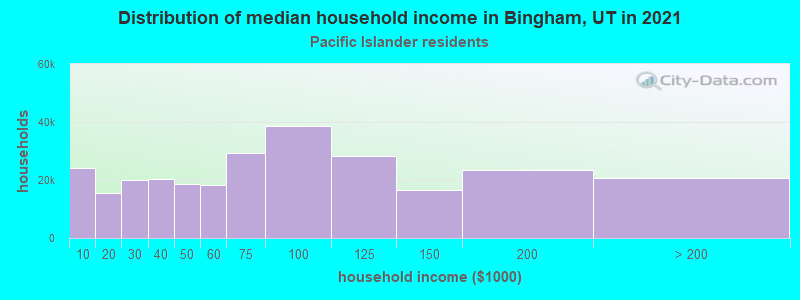
- $108,734Native Hawaiian and other Pacific Islander householders
- $142,738Some other race householders
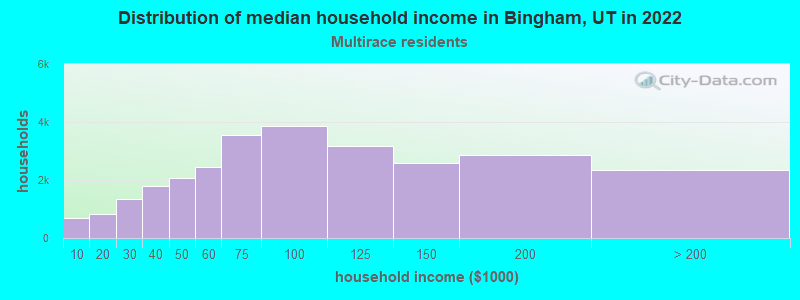
- $66,153Two or more races householders
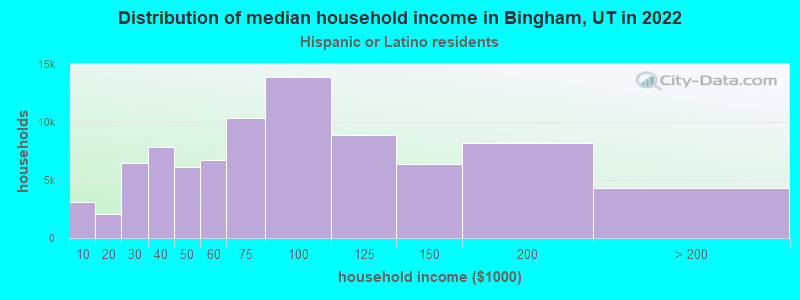
- $97,579Hispanic or Latino race householders
- Median 2022 house value
- $598,280White Non-Hispanic householders
- $534,403Black or African American householders
- $785,374American Indian or Alaska Native householders
- $510,318Asian householders
- $503,337Native Hawaiian and other Pacific Islander householders
- $614,337Some other race householders
- $551,856Two or more races householders
- $575,941Hispanic or Latino householders
Household income for White non-Hispanic householders
Household income for Black householders
Household income for American Indian and Alaska Native householders
Household income for Asian householders
Household income for Native Hawaiian and other Pacific Islander householders
Household income for Two or more races householders
Household income for Hispanic or Latino race householders
Zip code: 84095