Races in Big Spring, Texas (TX) Detailed Stats
Data:
Races - White alone (%)
Races - White alone (% change since 2000)
Races - Black alone (%)
Races - Black alone (% change since 2000)
Races - American Indian alone (%)
Races - American Indian alone (% change since 2000)
Races - Asian alone (%)
Races - Asian alone (% change since 2000)
Races - Hispanic (%)
Races - Hispanic (% change since 2000)
Races - Native Hawaiian and Other Pacific Islander alone (%)
Races - Native Hawaiian and Other Pacific Islander alone (% change since 2000)
Races - Two or more races(%)
Races - Two or more races(% change since 2000)
Races - Other race alone (%)
Races - Other race alone (% change since 2000)
Racial diversity
Place of birth - Born in state of residence (%)
Place of birth - Born in state of residence (%) - White
Place of birth - Born in state of residence (%) - Black or African American
Place of birth - Born in state of residence (%) - Asian
Place of birth - Born in state of residence (%) - Hispanic or Latino
Place of birth - Born in state of residence (%) - American Indian and Alaska Native
Place of birth - Born in state of residence (%) - Multirace
Place of birth - Born in state of residence (%) - Other Race
Place of birth - Born in other state (%)
Place of birth - Born in other state (%) - White
Place of birth - Born in other state (%) - Black or African American
Place of birth - Born in other state (%) - Asian
Place of birth - Born in other state (%) - Hispanic or Latino
Place of birth - Born in other state (%) - American Indian and Alaska Native
Place of birth - Born in other state (%) - Multirace
Place of birth - Born in other state (%) - Other Race
Place of birth - Native, outside of US (%)
Place of birth - Native, outside of US (%) - White
Place of birth - Native, outside of US (%) - Black or African American
Place of birth - Native, outside of US (%) - Asian
Place of birth - Native, outside of US (%) - Hispanic or Latino
Place of birth - Native, outside of US (%) - American Indian and Alaska Native
Place of birth - Native, outside of US (%) - Multirace
Place of birth - Native, outside of US (%) - Other Race
Place of birth - Foreign born (%)
Place of birth - Foreign born (%) - White
Place of birth - Foreign born (%) - Black or African American
Place of birth - Foreign born (%) - Asian
Place of birth - Foreign born (%) - Hispanic or Latino
Place of birth - Foreign born (%) - American Indian and Alaska Native
Place of birth - Foreign born (%) - Multirace
Place of birth - Foreign born (%) - Other Race
Residents speaking English at home (%)
Residents speaking English at home - Born in the United States (%)
Residents speaking English at home - Native, born elsewhere (%)
Residents speaking English at home - Foreign born (%)
Residents speaking Spanish at home (%)
Residents speaking Spanish at home - Born in the United States (%)
Residents speaking Spanish at home - Native, born elsewhere (%)
Residents speaking Spanish at home - Foreign born (%)
Residents speaking other language at home (%)
Residents speaking other language at home - Born in the United States (%)
Residents speaking other language at home - Native, born elsewhere (%)
Residents speaking other language at home - Foreign born (%)
Marital status - Never married (%)
Marital status - Now married (%)
Marital status - Separated (%)
Marital status - Widowed (%)
Marital status - Divorced (%)
Ancestries Reported - Arab (%)
Ancestries Reported - Czech (%)
Ancestries Reported - Danish (%)
Ancestries Reported - Dutch (%)
Ancestries Reported - English (%)
Ancestries Reported - French (%)
Ancestries Reported - French Canadian (%)
Ancestries Reported - German (%)
Ancestries Reported - Greek (%)
Ancestries Reported - Hungarian (%)
Ancestries Reported - Irish (%)
Ancestries Reported - Italian (%)
Ancestries Reported - Lithuanian (%)
Ancestries Reported - Norwegian (%)
Ancestries Reported - Polish (%)
Ancestries Reported - Portuguese (%)
Ancestries Reported - Russian (%)
Ancestries Reported - Scotch-Irish (%)
Ancestries Reported - Scottish (%)
Ancestries Reported - Slovak (%)
Ancestries Reported - Subsaharan African (%)
Ancestries Reported - Swedish (%)
Ancestries Reported - Swiss (%)
Ancestries Reported - Ukrainian (%)
Ancestries Reported - United States (%)
Ancestries Reported - Welsh (%)
Ancestries Reported - West Indian (%)
Ancestries Reported - Other (%)
Geographical mobility - Same house 1 year ago (%)
Geographical mobility - Same house 1 year ago (%) - White
Geographical mobility - Same house 1 year ago (%) - Black or African American
Geographical mobility - Same house 1 year ago (%) - Asian
Geographical mobility - Same house 1 year ago (%) - Hispanic or Latino
Geographical mobility - Same house 1 year ago (%) - American Indian and Alaska Native
Geographical mobility - Same house 1 year ago (%) - Multirace
Geographical mobility - Same house 1 year ago (%) - Other Race
Geographical mobility - Moved within same county (%)
Geographical mobility - Moved within same county (%) - White
Geographical mobility - Moved within same county (%) - Black or African American
Geographical mobility - Moved within same county (%) - Asian
Geographical mobility - Moved within same county (%) - Hispanic or Latino
Geographical mobility - Moved within same county (%) - American Indian and Alaska Native
Geographical mobility - Moved within same county (%) - Multirace
Geographical mobility - Moved within same county (%) - Other Race
Geographical mobility - Moved from different county within same state (%)
Geographical mobility - Moved from different county within same state (%) - White
Geographical mobility - Moved from different county within same state (%) - Black or African American
Geographical mobility - Moved from different county within same state (%) - Asian
Geographical mobility - Moved from different county within same state (%) - Hispanic or Latino
Geographical mobility - Moved from different county within same state (%) - American Indian and Alaska Native
Geographical mobility - Moved from different county within same state (%) - Multirace
Geographical mobility - Moved from different county within same state (%) - Other Race
Geographical mobility - Moved from different state (%)
Geographical mobility - Moved from different state (%) - White
Geographical mobility - Moved from different state (%) - Black or African American
Geographical mobility - Moved from different state (%) - Asian
Geographical mobility - Moved from different state (%) - Hispanic or Latino
Geographical mobility - Moved from different state (%) - American Indian and Alaska Native
Geographical mobility - Moved from different state (%) - Multirace
Geographical mobility - Moved from different state (%) - Other Race
Geographical mobility - Moved from abroad (%)
Geographical mobility - Moved from abroad (%) - White
Geographical mobility - Moved from abroad (%) - Black or African American
Geographical mobility - Moved from abroad (%) - Asian
Geographical mobility - Moved from abroad (%) - Hispanic or Latino
Geographical mobility - Moved from abroad (%) - American Indian and Alaska Native
Geographical mobility - Moved from abroad (%) - Multirace
Geographical mobility - Moved from abroad (%) - Other Race
Place of birth for the foreign-born population - Ireland (%)
Place of birth for the foreign-born population - Denmark (%)
Place of birth for the foreign-born population - Norway (%)
Place of birth for the foreign-born population - Sweden (%)
Place of birth for the foreign-born population - United Kingdom (%)
Place of birth for the foreign-born population - England (%)
Place of birth for the foreign-born population - Scotland (%)
Place of birth for the foreign-born population - Other Northern Europe (%)
Place of birth for the foreign-born population - Austria (%)
Place of birth for the foreign-born population - Belgium (%)
Place of birth for the foreign-born population - France (%)
Place of birth for the foreign-born population - Germany (%)
Place of birth for the foreign-born population - Netherlands (%)
Place of birth for the foreign-born population - Switzerland (%)
Place of birth for the foreign-born population - Other Western Europe (%)
Place of birth for the foreign-born population - Greece (%)
Place of birth for the foreign-born population - Italy (%)
Place of birth for the foreign-born population - Portugal (%)
Place of birth for the foreign-born population - Spain (%)
Place of birth for the foreign-born population - Other Southern Europe (%)
Place of birth for the foreign-born population - Albania (%)
Place of birth for the foreign-born population - Belarus (%)
Place of birth for the foreign-born population - Bosnia and Herzegovina (%)
Place of birth for the foreign-born population - Bulgaria (%)
Place of birth for the foreign-born population - Croatia (%)
Place of birth for the foreign-born population - Czechoslovakia (%)
Place of birth for the foreign-born population - Hungary (%)
Place of birth for the foreign-born population - Latvia (%)
Place of birth for the foreign-born population - Lithuania (%)
Place of birth for the foreign-born population - North Macedonia (Macedonia) (%)
Place of birth for the foreign-born population - Moldova (%)
Place of birth for the foreign-born population - Poland (%)
Place of birth for the foreign-born population - Romania (%)
Place of birth for the foreign-born population - Russia (%)
Place of birth for the foreign-born population - Serbia (%)
Place of birth for the foreign-born population - Ukraine (%)
Place of birth for the foreign-born population - Other Eastern Europe (%)
Place of birth for the foreign-born population - China (%)
Place of birth for the foreign-born population - Hong Kong (%)
Place of birth for the foreign-born population - Taiwan (%)
Place of birth for the foreign-born population - Japan (%)
Place of birth for the foreign-born population - Korea (%)
Place of birth for the foreign-born population - Other Eastern Asia (%)
Place of birth for the foreign-born population - Afghanistan (%)
Place of birth for the foreign-born population - Bangladesh (%)
Place of birth for the foreign-born population - India (%)
Place of birth for the foreign-born population - Iran (%)
Place of birth for the foreign-born population - Kazakhstan (%)
Place of birth for the foreign-born population - Nepal (%)
Place of birth for the foreign-born population - Pakistan (%)
Place of birth for the foreign-born population - Sri Lanka (%)
Place of birth for the foreign-born population - Uzbekistan (%)
Place of birth for the foreign-born population - Other South Central Asia (%)
Place of birth for the foreign-born population - Burma (%)
Place of birth for the foreign-born population - Cambodia (%)
Place of birth for the foreign-born population - Indonesia (%)
Place of birth for the foreign-born population - Laos (%)
Place of birth for the foreign-born population - Malaysia (%)
Place of birth for the foreign-born population - Philippines (%)
Place of birth for the foreign-born population - Singapore (%)
Place of birth for the foreign-born population - Thailand (%)
Place of birth for the foreign-born population - Vietnam (%)
Place of birth for the foreign-born population - Other South Eastern Asia (%)
Place of birth for the foreign-born population - Armenia (%)
Place of birth for the foreign-born population - Iraq (%)
Place of birth for the foreign-born population - Israel (%)
Place of birth for the foreign-born population - Jordan (%)
Place of birth for the foreign-born population - Kuwait (%)
Place of birth for the foreign-born population - Lebanon (%)
Place of birth for the foreign-born population - Saudi Arabia (%)
Place of birth for the foreign-born population - Syria (%)
Place of birth for the foreign-born population - Turkey (%)
Place of birth for the foreign-born population - Yemen (%)
Place of birth for the foreign-born population - Other Western Asia (%)
Place of birth for the foreign-born population - Eritrea (%)
Place of birth for the foreign-born population - Ethiopia (%)
Place of birth for the foreign-born population - Kenya (%)
Place of birth for the foreign-born population - Somalia (%)
Place of birth for the foreign-born population - Uganda (%)
Place of birth for the foreign-born population - Zimbabwe (%)
Place of birth for the foreign-born population - Other Eastern Africa (%)
Place of birth for the foreign-born population - Cameroon (%)
Place of birth for the foreign-born population - Congo (%)
Place of birth for the foreign-born population - Democratic Republic of Congo (Zaire) (%)
Place of birth for the foreign-born population - Other Middle Africa (%)
Place of birth for the foreign-born population - Egypt (%)
Place of birth for the foreign-born population - Morocco (%)
Place of birth for the foreign-born population - Sudan (%)
Place of birth for the foreign-born population - Other Northern Africa (%)
Place of birth for the foreign-born population - South Africa (%)
Place of birth for the foreign-born population - Other Southern Africa (%)
Place of birth for the foreign-born population - Cabo Verde (%)
Place of birth for the foreign-born population - Ghana (%)
Place of birth for the foreign-born population - Liberia (%)
Place of birth for the foreign-born population - Nigeria (%)
Place of birth for the foreign-born population - Senegal (%)
Place of birth for the foreign-born population - Sierra Leone (%)
Place of birth for the foreign-born population - Other Western Africa (%)
Place of birth for the foreign-born population - Australia (%)
Place of birth for the foreign-born population - New Zealand (%)
Place of birth for the foreign-born population - Fiji (%)
Place of birth for the foreign-born population - Micronesia (%)
Place of birth for the foreign-born population - Bahamas (%)
Place of birth for the foreign-born population - Barbados (%)
Place of birth for the foreign-born population - Cuba (%)
Place of birth for the foreign-born population - Dominica (%)
Place of birth for the foreign-born population - Dominican Republic (%)
Place of birth for the foreign-born population - Grenada (%)
Place of birth for the foreign-born population - Haiti (%)
Place of birth for the foreign-born population - Jamaica (%)
Place of birth for the foreign-born population - St. Vincent and the Grenadines (%)
Place of birth for the foreign-born population - Trinidad and Tobago (%)
Place of birth for the foreign-born population - West Indies (%)
Place of birth for the foreign-born population - Other Caribbean (%)
Place of birth for the foreign-born population - Belize (%)
Place of birth for the foreign-born population - Costa Rica (%)
Place of birth for the foreign-born population - El Salvador (%)
Place of birth for the foreign-born population - Guatemala (%)
Place of birth for the foreign-born population - Honduras (%)
Place of birth for the foreign-born population - Mexico (%)
Place of birth for the foreign-born population - Nicaragua (%)
Place of birth for the foreign-born population - Panama (%)
Place of birth for the foreign-born population - Other Central America (%)
Place of birth for the foreign-born population - Argentina (%)
Place of birth for the foreign-born population - Bolivia (%)
Place of birth for the foreign-born population - Brazil (%)
Place of birth for the foreign-born population - Chile (%)
Place of birth for the foreign-born population - Colombia (%)
Place of birth for the foreign-born population - Ecuador (%)
Place of birth for the foreign-born population - Guyana (%)
Place of birth for the foreign-born population - Peru (%)
Place of birth for the foreign-born population - Uruguay (%)
Place of birth for the foreign-born population - Venezuela (%)
Place of birth for the foreign-born population - Other South America (%)
Place of birth for the foreign-born population - Canada (%)
Place of birth for the foreign-born population - Other Northern America (%)
Place of birth for the foreign-born population - Other (%)
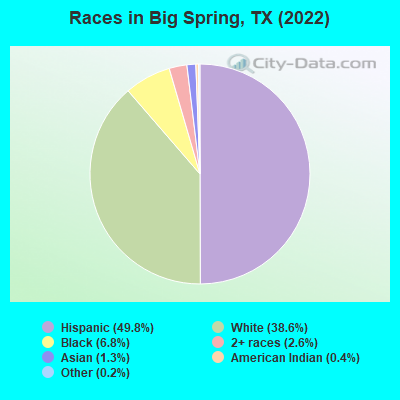
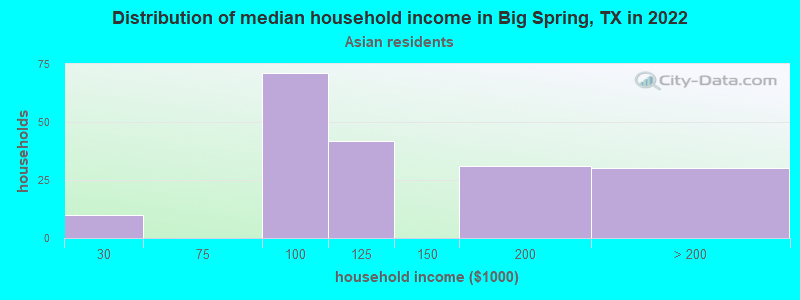
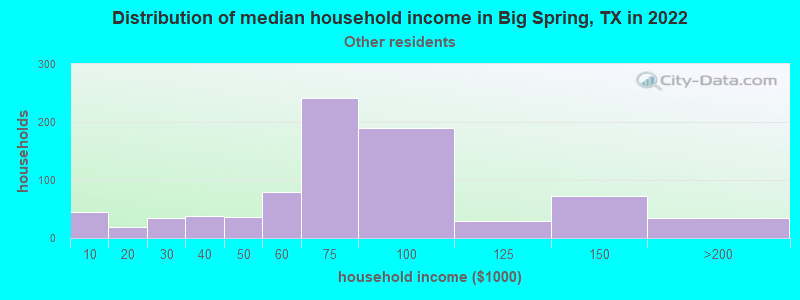
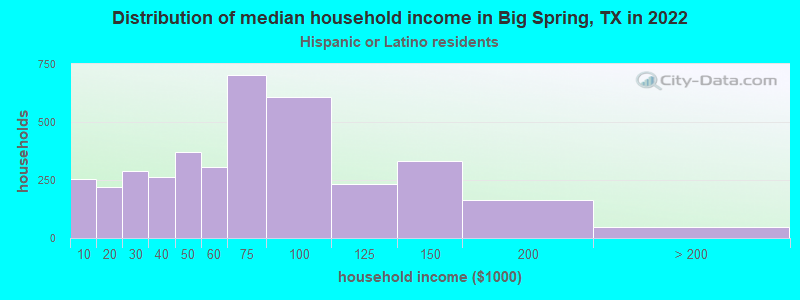
According to 2022 data, the most numerous races in Big Spring, TX are Hispanic (13,279 residents), White alone (10,273 residents), and Black alone (1,819 residents). 68.5% of Big Spring residents speak English at home. 11.9% of Big Spring, TX residents are foreign-born (10.1% born in Latin America), which is 42.6% less than the foreign-born rate of 17.0% across the entire state of Texas.
Race distribution in Big Spring
2000 2022
10,933,313 52.4% White alone 6,669,666 32.0% Hispanic 2,364,255 11.3% Black alone 554,445 2.7% Asian alone 230,567 1.1% Two or more races 68,859 0.3% American Indian alone 19,958 0.10% Other race alone 10,757 0.05% Native Hawaiian and Other
12,070,642 40.2% Hispanic 11,683,430 38.9% White alone 3,508,706 11.7% Black alone 1,608,173 5.4% Asian alone 956,560 3.2% Two or more races 125,763 0.4% Other race alone 47,023 0.2% American Indian alone 29,275 0.10% Native Hawaiian and Other
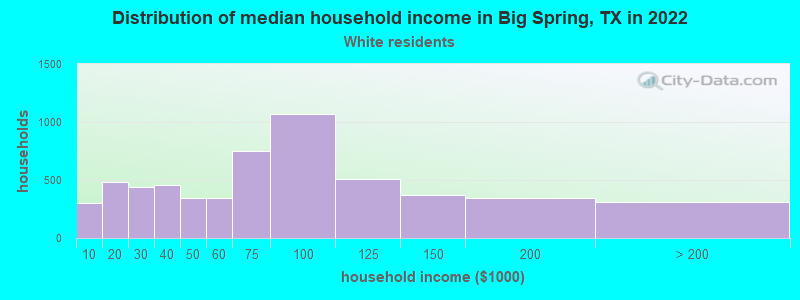
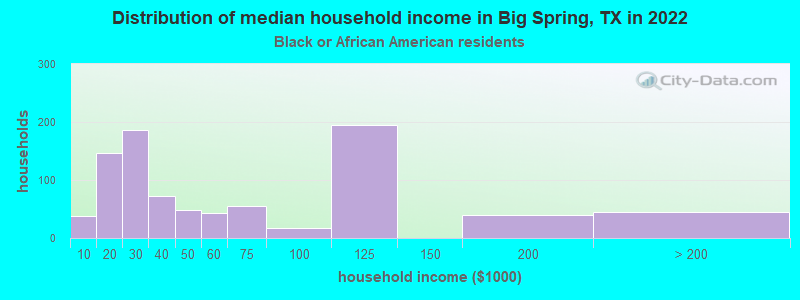
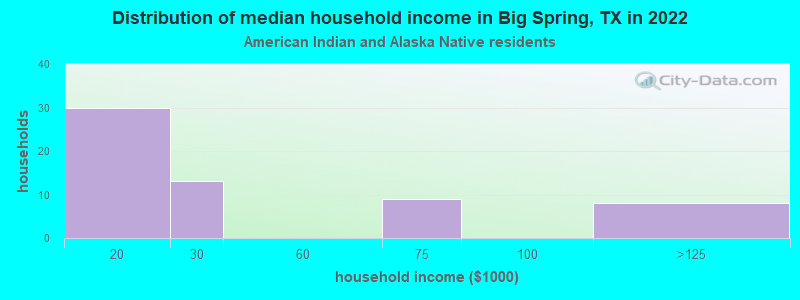
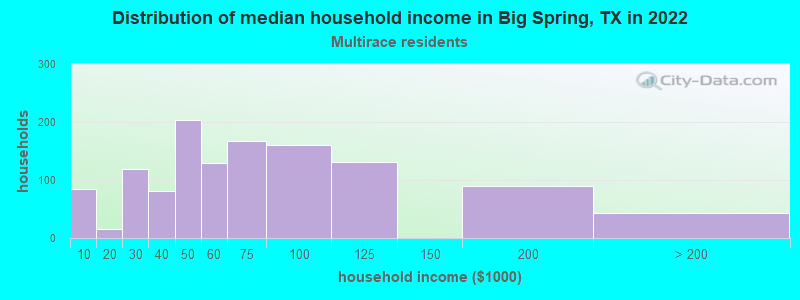
Income and house value in Big Spring Median household income in 2022 $72,503 White non-Hispanic householders$108,453 Asian householders$67,738 Some other race householders$57,977 Two or more races householders$63,113 Hispanic or Latino race householdersMedian 2022 house value $173,683 White Non-Hispanic householders$128,940 Black or African American householders$295,709 American Indian or Alaska Native householders$183,038 Native Hawaiian and other Pacific Islander householders$75,656 Some other race householders$101,688 Two or more races householders$88,672 Hispanic or Latino householders
Median age by race in Big Spring
38.3 Median age for White residents38.8 38.0 41.2 Median age for Black or African American residents40.9 43.0 54.8 Median age for American Indian / Alaska Native residents54.5 55.2 37.8 Median age for Asian residents37.9 37.7 -581,560,283.1 Median age for Native Hawaiian / Pacific Islander residents-612,729,233.5 -577,777,777.2 33.2 Median age for Other race residents33.3 32.9 37.1 Median age for Two or more races residents38.9 33.8 40.3 Median age for White alone residents39.3 42.2 33.9 Median age for Hispanic or Latino residents35.3 31.3
Owner/renter occupied households by race in Big Spring
House owners and renters - White residents 3,765 65.4% Owner occupied1,992 34.6% Renter occupiedHouse owners and renters - Black or African American residents 476 53.2% Owner occupied418 46.8% Renter occupiedHouse owners and renters - American Indian / Alaska Native residents 9 15.3% Owner occupied49 84.7% Renter occupiedHouse owners and renters - Asian residents 83 45.8% Owner occupied98 54.2% Renter occupiedHouse owners and renters - Other race residents 454 55.4% Owner occupied366 44.6% Renter occupiedHouse owners and renters - Two or more races residents 776 64.4% Owner occupied429 35.6% Renter occupiedHouse owners and renters - White alone residents 2,869 67.0% Owner occupied1,414 33.0% Renter occupiedHouse owners and renters - Hispanic or Latino residents 2,215 58.5% Owner occupied1,569 41.5% Renter occupied
Language usage in Big Spring
English speakers - Total 68.5% of residents of Big Spring speak English at home.
29.3% of residents speak Spanish at home 4,728 64.3% Speak English very well2,625 35.7% Speak English less than very well2.0% of residents speak other language at home 376 73.2% Speak English very well138 26.8% Speak English less than very well
English speakers - Born in the United States 83.5% of residents of Big Spring speak English at home.
15.5% of residents speak Spanish at home 504 74.4% Speak English very well173 25.6% Speak English less than very well0.9% of residents speak other language at home 24 63.2% Speak English very well14 36.8% Speak English less than very well
English speakers - Native, born elsewhere 44.9% of residents of Big Spring speak English at home.
53.1% of residents speak Spanish at home 82 63.1% Speak English very well48 36.9% Speak English less than very well
English speakers - Foreign-born 8.6% of residents of Big Spring speak English at home.
78.0% of residents speak Spanish at home 577 23.3% Speak English very well1,901 76.7% Speak English less than very well12.9% of residents speak other language at home 296 72.4% Speak English very well113 27.6% Speak English less than very well
White (Caucasian) - Speak only English Native:
89.0% (11,991)Foreign-born:
13.5% (117)
White (Caucasian) - Speak another language Native:
10.6% (1,435)Foreign-born:
81.6% (711)
Black or African American - Speak only English Native:
86.3% (1,517)Foreign-born:
25.2% (50)
Black or African American - Speak another language Native:
13.7% (240)Foreign-born:
75.9% (152)
American Indian / Alaska Native - Speak another language Native:
66.2% (176)Foreign-born:
98.9% (41)
Asian - Speak only English Native:
100.0% (193)Foreign-born:
18.5% (41)
Other race - Speak only English Native:
51.9% (1,318)Foreign-born:
13.3% (37)
Other race - Speak another language Native:
49.2% (1,248)Foreign-born:
87.3% (240)
Two or more races - Speak another language Native:
42.3% (1,346)Foreign-born:
100.0% (905)
White alone - Speak only English Native:
97.4% (9,425)Foreign-born:
25.5% (44)
White alone - Speak another language Native:
2.6% (256)Foreign-born:
74.4% (127)
Hispanic or Latino - Speak only English Native:
54.2% (5,266)Foreign-born:
4.6% (118)
Hispanic or Latino - Speak another language Native:
46.2% (4,484)Foreign-born:
95.4% (2,466)
Foreign-born residents in Big Spring 3,177 residents are foreign born (10.1% Latin America ).
This city:
11.9%Texas:
17.1%
Marital status for residents in Big Spring Marital status - White (Caucasian) population 15 years and over
Males 37.7% Never married42.0% Now married4.2% Separated4.1% Widowed12.0% DivorcedFemales 27.1% Never married44.3% Now married2.8% Separated9.5% Widowed16.3% DivorcedWomen who gave birth in the past 12 months Now married:
71.6% (132)Unmarried:
28.4% (53)
Women who did not give birth in the past 12 months Now married:
44.6% (1,284)Unmarried:
55.4% (1,599)
Marital status - Black or African American population 15 years and over
Males 38.8% Never married40.4% Now married6.4% Separated2.4% Widowed12.0% DivorcedFemales 50.7% Never married8.4% Now married3.7% Separated8.9% Widowed28.3% DivorcedWomen who gave birth in the past 12 months Now married:
0.0% (0)Unmarried:
100.0% (16)
Women who did not give birth in the past 12 months Now married:
9.6% (39)Unmarried:
90.4% (373)
Marital status - American Indian / Alaska Native population 15 years and over
Males 32.6% Never married67.4% Now married0.0% Separated0.0% Widowed0.0% DivorcedFemales 0.0% Never married57.1% Now married0.0% Separated0.0% Widowed42.9% DivorcedWomen who did not give birth in the past 12 months Now married:
100.0% (11)Unmarried:
0.0% (0)
Marital status - Asian population 15 years and over
Males 58.7% Never married32.6% Now married3.3% Separated0.0% Widowed5.4% DivorcedFemales 43.7% Never married56.3% Now married0.0% Separated0.0% Widowed0.0% DivorcedWomen who did not give birth in the past 12 months Now married:
53.4% (68)Unmarried:
46.6% (59)
Marital status - Other race population 15 years and over
Males 45.6% Never married45.0% Now married0.6% Separated2.5% Widowed6.3% DivorcedFemales 39.1% Never married42.2% Now married2.4% Separated2.2% Widowed14.1% DivorcedWomen who gave birth in the past 12 months Now married:
3.6% (12)Unmarried:
96.4% (331)
Women who did not give birth in the past 12 months Now married:
56.9% (356)Unmarried:
43.1% (269)
Marital status - Two or more races population 15 years and over
Males 23.4% Never married54.8% Now married2.4% Separated1.1% Widowed18.4% DivorcedFemales 19.8% Never married49.6% Now married6.3% Separated11.2% Widowed13.1% DivorcedWomen who gave birth in the past 12 months Now married:
100.0% (82)Unmarried:
0.0% (0)
Women who did not give birth in the past 12 months Now married:
61.4% (373)Unmarried:
38.6% (235)
Marital status - White alone, not Hispanic / Latino population 15 years and over
Males 36.0% Never married42.8% Now married1.9% Separated5.6% Widowed13.8% DivorcedFemales 17.9% Never married49.6% Now married3.1% Separated12.8% Widowed16.5% DivorcedWomen who gave birth in the past 12 months Now married:
81.8% (98)Unmarried:
18.2% (22)
Women who did not give birth in the past 12 months Now married:
52.4% (1,021)Unmarried:
47.6% (927)
Marital status - Hispanic or Latino population 15 years and over
Males 39.0% Never married44.1% Now married5.2% Separated2.2% Widowed9.6% DivorcedFemales 36.9% Never married39.4% Now married3.2% Separated4.8% Widowed15.7% DivorcedWomen who gave birth in the past 12 months Now married:
30.4% (129)Unmarried:
69.6% (295)
Women who did not give birth in the past 12 months Now married:
42.5% (1,063)Unmarried:
57.5% (1,438)
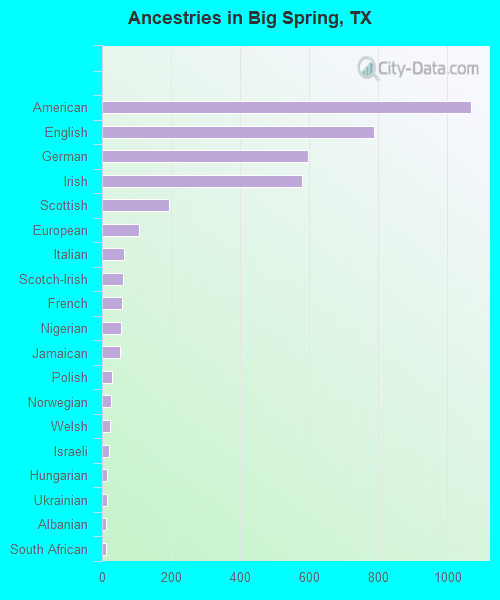
Ancestries in Big Spring
1,068 6.9% American787 5.1% English598 3.8% German579 3.7% Irish194 1.2% Scottish107 0.7% European64 0.4% Italian62 0.4% Scotch-Irish58 0.4% French54 0.3% Nigerian53 0.3% Jamaican28 0.2% Polish25 0.2% Norwegian24 0.2% Welsh19 0.1% Israeli15 0.10% Hungarian15 0.10% Ukrainian13 0.08% Albanian13 0.08% South African9 0.06% Czech7 0.04% Scandinavian3 0.02% African
Geographical mobility in Big Spring Same house 1 year ago 12,643 84.2% White (Caucasian)1,728 88.2% Black or African American296 92.3% American Indian / Alaska Native343 84.2% Asian2,780 93.0% Other race3,871 84.4% Two or more races8,342 81.4% White alone, not Hispanic / Latino11,632 88.8% Hispanic or LatinoMoved within same county 850 5.7% White / Caucasian41 2.1% Black or African American108 3.6% Other race384 8.4% Two or more races904 8.8% White alone, not Hispanic / Latino398 3.0% Hispanic or LatinoMoved within same state 1,245 8.3% White / Caucasian177 9.0% Black or African American28 8.8% American Indian / Alaska Native62 15.3% Asian51 1.7% Other race118 2.6% Two or more races837 8.2% White alone, not Hispanic / Latino720 5.5% Hispanic or LatinoMoved from different state 299 2.0% White / Caucasian24 1.2% Black or African American53 1.8% Other race190 4.1% Two or more races134 1.3% White alone, not Hispanic / Latino292 2.2% Hispanic or LatinoMoved from abroad 58 0.4% White8 0.4% Black or African American5 1.2% Asian19 0.4% Two or more races118 0.9% Hispanic or Latino
Children Nativity (place of birth) in Big Spring
Children under 6 years - Living with two parents Both parents native 798 100.0% NativeBoth parents foreign-born 81 100.0% NativeOne native, one foreign-born parent 46 100.0% NativeChildren under 6 years - Living with one parent Native parent 751 100.0% NativeChildren 6 to 17 years - Living with two parents Both parents native 1,676 99.4% Native10 0.6% Foreign-bornBoth parents foreign-born 75 82.3% Native16 17.7% Foreign-bornOne native, one foreign-born parent 123 100.0% NativeChildren 6 to 17 years - Living with one parent Native parent 1,548 100.0% NativeForeign-born parent 95 50.5% Native93 49.5% Foreign-born
Grandparents responsible for own grandchildren in Big Spring
Grandparents (30 to 59 years) White / Caucasian 56 31.3% Responsible for grandchildren122 68.7% Not responsible for grandchildrenBlack or African American 121 100.0% Responsible for grandchildrenOther race 8 7.1% Responsible for grandchildren109 92.9% Not responsible for grandchildrenWhite alone, not Hispanic / Latino 38 100.0% Responsible for grandchildrenHispanic or Latino 47 14.8% Responsible for grandchildren270 85.2% Not responsible for grandchildrenGrandparents (60 years and over) White / Caucasian 37 60.6% Responsible for grandchildren24 39.4% Not responsible for grandchildrenWhite alone, not Hispanic / Latino 44 73.3% Responsible for grandchildren16 26.7% Not responsible for grandchildrenHispanic or Latino 35 100.0% Not responsible for grandchildren