Races in Bethany, Oregon (OR) Detailed Stats
Data:
Races - White alone (%)
Races - White alone (% change since 2000)
Races - Black alone (%)
Races - Black alone (% change since 2000)
Races - American Indian alone (%)
Races - American Indian alone (% change since 2000)
Races - Asian alone (%)
Races - Asian alone (% change since 2000)
Races - Hispanic (%)
Races - Hispanic (% change since 2000)
Races - Native Hawaiian and Other Pacific Islander alone (%)
Races - Native Hawaiian and Other Pacific Islander alone (% change since 2000)
Races - Two or more races(%)
Races - Two or more races(% change since 2000)
Races - Other race alone (%)
Races - Other race alone (% change since 2000)
Racial diversity
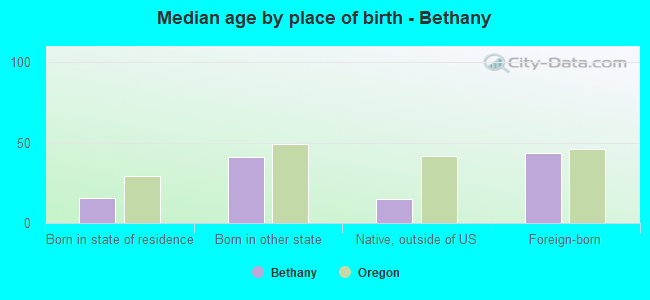
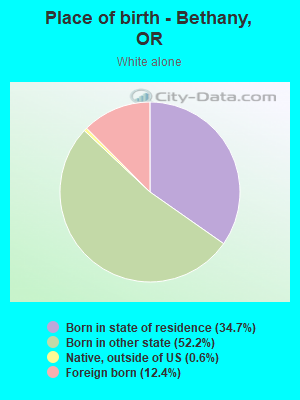
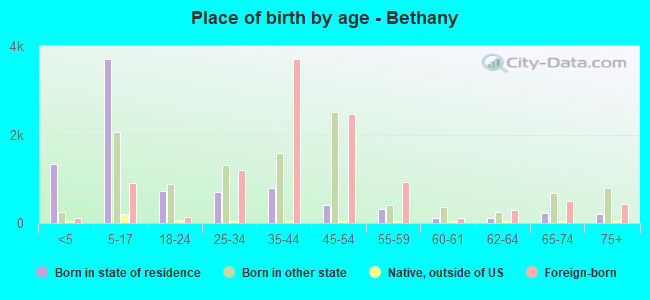
Place of birth - Born in state of residence (%)
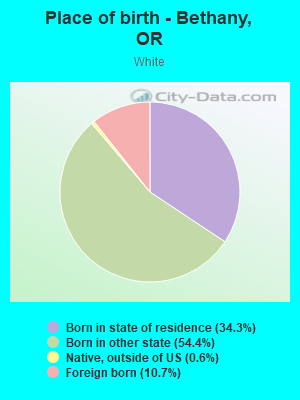
Place of birth - Born in state of residence (%) - White
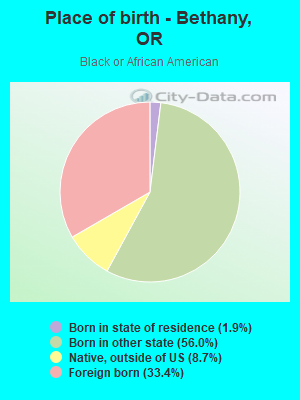
Place of birth - Born in state of residence (%) - Black or African American
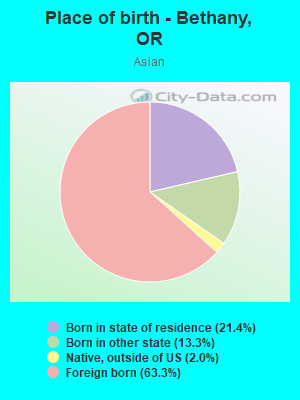
Place of birth - Born in state of residence (%) - Asian
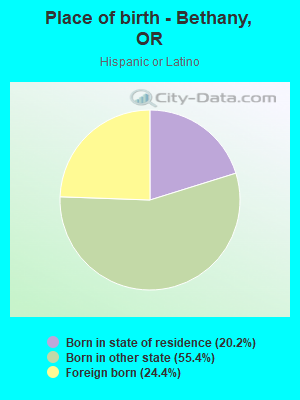
Place of birth - Born in state of residence (%) - Hispanic or Latino
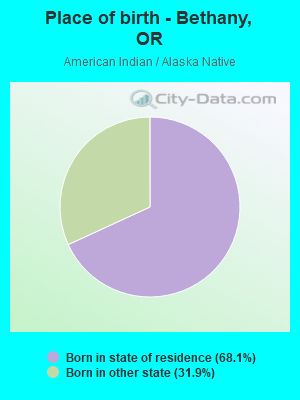
Place of birth - Born in state of residence (%) - American Indian and Alaska Native
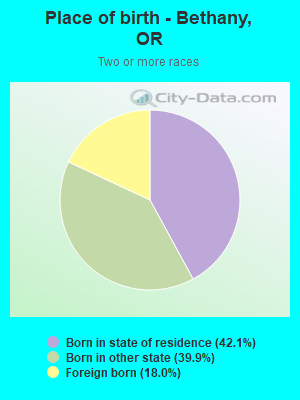
Place of birth - Born in state of residence (%) - Multirace
Place of birth - Born in state of residence (%) - Other Race
Place of birth - Born in other state (%)
Place of birth - Born in other state (%) - White
Place of birth - Born in other state (%) - Black or African American
Place of birth - Born in other state (%) - Asian
Place of birth - Born in other state (%) - Hispanic or Latino
Place of birth - Born in other state (%) - American Indian and Alaska Native
Place of birth - Born in other state (%) - Multirace
Place of birth - Born in other state (%) - Other Race
Place of birth - Native, outside of US (%)
Place of birth - Native, outside of US (%) - White
Place of birth - Native, outside of US (%) - Black or African American
Place of birth - Native, outside of US (%) - Asian
Place of birth - Native, outside of US (%) - Hispanic or Latino
Place of birth - Native, outside of US (%) - American Indian and Alaska Native
Place of birth - Native, outside of US (%) - Multirace
Place of birth - Native, outside of US (%) - Other Race
Place of birth - Foreign born (%)
Place of birth - Foreign born (%) - White
Place of birth - Foreign born (%) - Black or African American
Place of birth - Foreign born (%) - Asian
Place of birth - Foreign born (%) - Hispanic or Latino
Place of birth - Foreign born (%) - American Indian and Alaska Native
Place of birth - Foreign born (%) - Multirace
Place of birth - Foreign born (%) - Other Race
Residents speaking English at home (%)
Residents speaking English at home - Born in the United States (%)
Residents speaking English at home - Native, born elsewhere (%)
Residents speaking English at home - Foreign born (%)
Residents speaking Spanish at home (%)
Residents speaking Spanish at home - Born in the United States (%)
Residents speaking Spanish at home - Native, born elsewhere (%)
Residents speaking Spanish at home - Foreign born (%)
Residents speaking other language at home (%)
Residents speaking other language at home - Born in the United States (%)
Residents speaking other language at home - Native, born elsewhere (%)
Residents speaking other language at home - Foreign born (%)
Marital status - Never married (%)
Marital status - Now married (%)
Marital status - Separated (%)
Marital status - Widowed (%)
Marital status - Divorced (%)
Ancestries Reported - Arab (%)
Ancestries Reported - Czech (%)
Ancestries Reported - Danish (%)
Ancestries Reported - Dutch (%)
Ancestries Reported - English (%)
Ancestries Reported - French (%)
Ancestries Reported - French Canadian (%)
Ancestries Reported - German (%)
Ancestries Reported - Greek (%)
Ancestries Reported - Hungarian (%)
Ancestries Reported - Irish (%)
Ancestries Reported - Italian (%)
Ancestries Reported - Lithuanian (%)
Ancestries Reported - Norwegian (%)
Ancestries Reported - Polish (%)
Ancestries Reported - Portuguese (%)
Ancestries Reported - Russian (%)
Ancestries Reported - Scotch-Irish (%)
Ancestries Reported - Scottish (%)
Ancestries Reported - Slovak (%)
Ancestries Reported - Subsaharan African (%)
Ancestries Reported - Swedish (%)
Ancestries Reported - Swiss (%)
Ancestries Reported - Ukrainian (%)
Ancestries Reported - United States (%)
Ancestries Reported - Welsh (%)
Ancestries Reported - West Indian (%)
Ancestries Reported - Other (%)
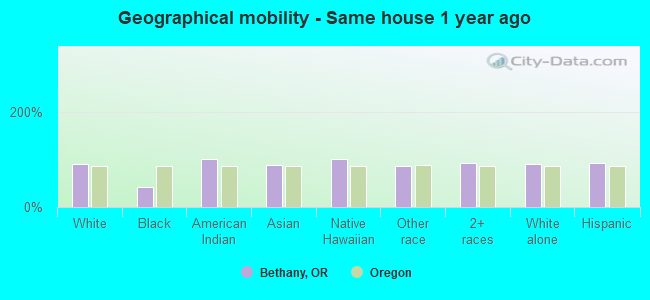
Geographical mobility - Same house 1 year ago (%)
Geographical mobility - Same house 1 year ago (%) - White
Geographical mobility - Same house 1 year ago (%) - Black or African American
Geographical mobility - Same house 1 year ago (%) - Asian
Geographical mobility - Same house 1 year ago (%) - Hispanic or Latino
Geographical mobility - Same house 1 year ago (%) - American Indian and Alaska Native
Geographical mobility - Same house 1 year ago (%) - Multirace
Geographical mobility - Same house 1 year ago (%) - Other Race
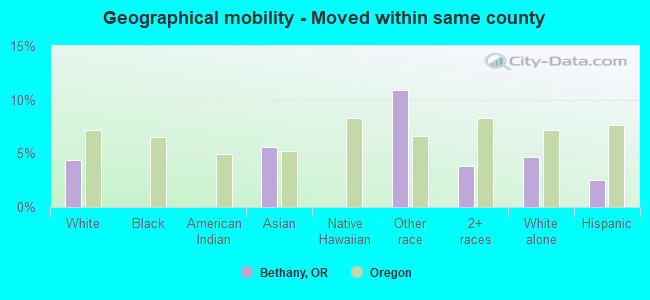
Geographical mobility - Moved within same county (%)
Geographical mobility - Moved within same county (%) - White
Geographical mobility - Moved within same county (%) - Black or African American
Geographical mobility - Moved within same county (%) - Asian
Geographical mobility - Moved within same county (%) - Hispanic or Latino
Geographical mobility - Moved within same county (%) - American Indian and Alaska Native
Geographical mobility - Moved within same county (%) - Multirace
Geographical mobility - Moved within same county (%) - Other Race
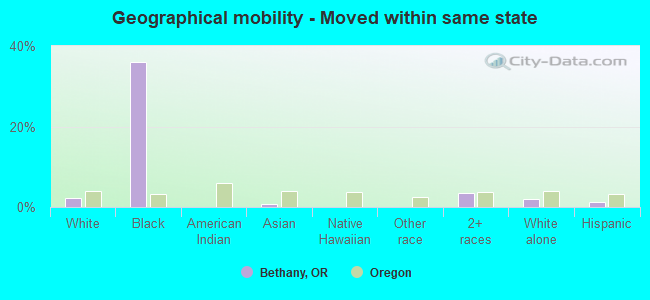
Geographical mobility - Moved from different county within same state (%)
Geographical mobility - Moved from different county within same state (%) - White
Geographical mobility - Moved from different county within same state (%) - Black or African American
Geographical mobility - Moved from different county within same state (%) - Asian
Geographical mobility - Moved from different county within same state (%) - Hispanic or Latino
Geographical mobility - Moved from different county within same state (%) - American Indian and Alaska Native
Geographical mobility - Moved from different county within same state (%) - Multirace
Geographical mobility - Moved from different county within same state (%) - Other Race
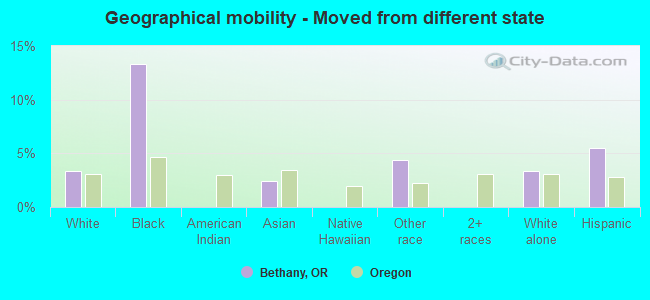
Geographical mobility - Moved from different state (%)
Geographical mobility - Moved from different state (%) - White
Geographical mobility - Moved from different state (%) - Black or African American
Geographical mobility - Moved from different state (%) - Asian
Geographical mobility - Moved from different state (%) - Hispanic or Latino
Geographical mobility - Moved from different state (%) - American Indian and Alaska Native
Geographical mobility - Moved from different state (%) - Multirace
Geographical mobility - Moved from different state (%) - Other Race
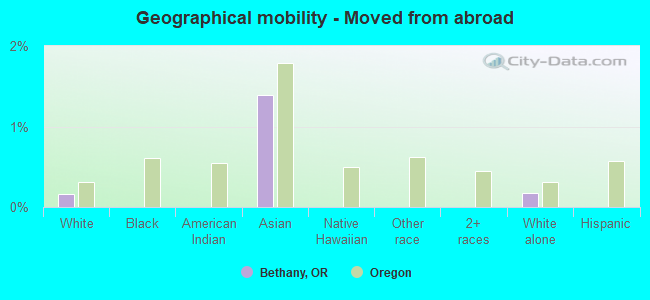
Geographical mobility - Moved from abroad (%)
Geographical mobility - Moved from abroad (%) - White
Geographical mobility - Moved from abroad (%) - Black or African American
Geographical mobility - Moved from abroad (%) - Asian
Geographical mobility - Moved from abroad (%) - Hispanic or Latino
Geographical mobility - Moved from abroad (%) - American Indian and Alaska Native
Geographical mobility - Moved from abroad (%) - Multirace
Geographical mobility - Moved from abroad (%) - Other Race
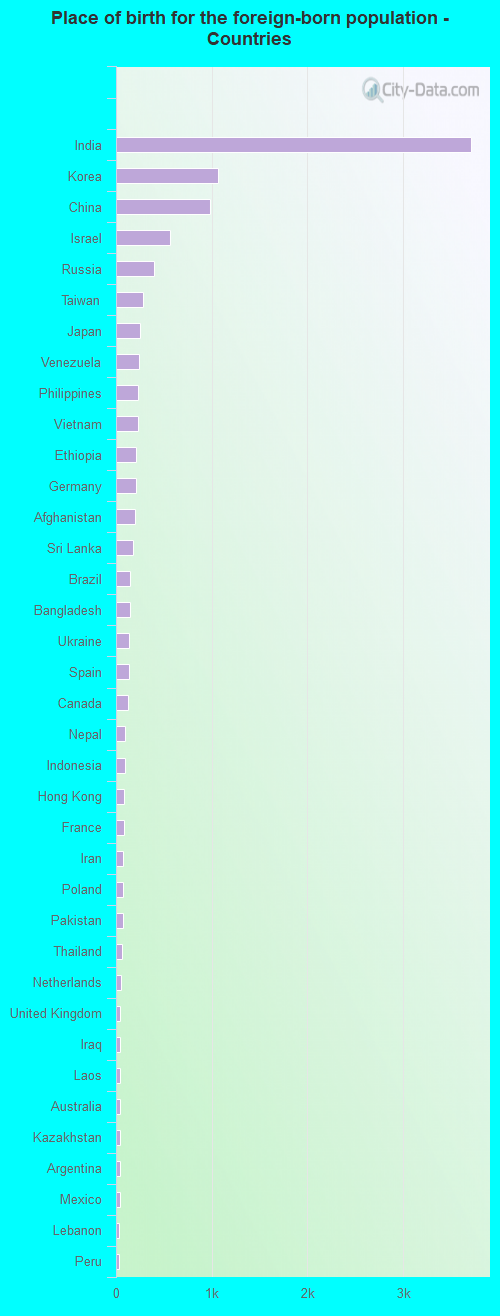
Place of birth for the foreign-born population - Ireland (%)
Place of birth for the foreign-born population - Denmark (%)
Place of birth for the foreign-born population - Norway (%)
Place of birth for the foreign-born population - Sweden (%)
Place of birth for the foreign-born population - United Kingdom (%)
Place of birth for the foreign-born population - England (%)
Place of birth for the foreign-born population - Scotland (%)
Place of birth for the foreign-born population - Other Northern Europe (%)
Place of birth for the foreign-born population - Austria (%)
Place of birth for the foreign-born population - Belgium (%)
Place of birth for the foreign-born population - France (%)
Place of birth for the foreign-born population - Germany (%)
Place of birth for the foreign-born population - Netherlands (%)
Place of birth for the foreign-born population - Switzerland (%)
Place of birth for the foreign-born population - Other Western Europe (%)
Place of birth for the foreign-born population - Greece (%)
Place of birth for the foreign-born population - Italy (%)
Place of birth for the foreign-born population - Portugal (%)
Place of birth for the foreign-born population - Spain (%)
Place of birth for the foreign-born population - Other Southern Europe (%)
Place of birth for the foreign-born population - Albania (%)
Place of birth for the foreign-born population - Belarus (%)
Place of birth for the foreign-born population - Bosnia and Herzegovina (%)
Place of birth for the foreign-born population - Bulgaria (%)
Place of birth for the foreign-born population - Croatia (%)
Place of birth for the foreign-born population - Czechoslovakia (%)
Place of birth for the foreign-born population - Hungary (%)
Place of birth for the foreign-born population - Latvia (%)
Place of birth for the foreign-born population - Lithuania (%)
Place of birth for the foreign-born population - North Macedonia (Macedonia) (%)
Place of birth for the foreign-born population - Moldova (%)
Place of birth for the foreign-born population - Poland (%)
Place of birth for the foreign-born population - Romania (%)
Place of birth for the foreign-born population - Russia (%)
Place of birth for the foreign-born population - Serbia (%)
Place of birth for the foreign-born population - Ukraine (%)
Place of birth for the foreign-born population - Other Eastern Europe (%)
Place of birth for the foreign-born population - China (%)
Place of birth for the foreign-born population - Hong Kong (%)
Place of birth for the foreign-born population - Taiwan (%)
Place of birth for the foreign-born population - Japan (%)
Place of birth for the foreign-born population - Korea (%)
Place of birth for the foreign-born population - Other Eastern Asia (%)
Place of birth for the foreign-born population - Afghanistan (%)
Place of birth for the foreign-born population - Bangladesh (%)
Place of birth for the foreign-born population - India (%)
Place of birth for the foreign-born population - Iran (%)
Place of birth for the foreign-born population - Kazakhstan (%)
Place of birth for the foreign-born population - Nepal (%)
Place of birth for the foreign-born population - Pakistan (%)
Place of birth for the foreign-born population - Sri Lanka (%)
Place of birth for the foreign-born population - Uzbekistan (%)
Place of birth for the foreign-born population - Other South Central Asia (%)
Place of birth for the foreign-born population - Burma (%)
Place of birth for the foreign-born population - Cambodia (%)
Place of birth for the foreign-born population - Indonesia (%)
Place of birth for the foreign-born population - Laos (%)
Place of birth for the foreign-born population - Malaysia (%)
Place of birth for the foreign-born population - Philippines (%)
Place of birth for the foreign-born population - Singapore (%)
Place of birth for the foreign-born population - Thailand (%)
Place of birth for the foreign-born population - Vietnam (%)
Place of birth for the foreign-born population - Other South Eastern Asia (%)
Place of birth for the foreign-born population - Armenia (%)
Place of birth for the foreign-born population - Iraq (%)
Place of birth for the foreign-born population - Israel (%)
Place of birth for the foreign-born population - Jordan (%)
Place of birth for the foreign-born population - Kuwait (%)
Place of birth for the foreign-born population - Lebanon (%)
Place of birth for the foreign-born population - Saudi Arabia (%)
Place of birth for the foreign-born population - Syria (%)
Place of birth for the foreign-born population - Turkey (%)
Place of birth for the foreign-born population - Yemen (%)
Place of birth for the foreign-born population - Other Western Asia (%)
Place of birth for the foreign-born population - Eritrea (%)
Place of birth for the foreign-born population - Ethiopia (%)
Place of birth for the foreign-born population - Kenya (%)
Place of birth for the foreign-born population - Somalia (%)
Place of birth for the foreign-born population - Uganda (%)
Place of birth for the foreign-born population - Zimbabwe (%)
Place of birth for the foreign-born population - Other Eastern Africa (%)
Place of birth for the foreign-born population - Cameroon (%)
Place of birth for the foreign-born population - Congo (%)
Place of birth for the foreign-born population - Democratic Republic of Congo (Zaire) (%)
Place of birth for the foreign-born population - Other Middle Africa (%)
Place of birth for the foreign-born population - Egypt (%)
Place of birth for the foreign-born population - Morocco (%)
Place of birth for the foreign-born population - Sudan (%)
Place of birth for the foreign-born population - Other Northern Africa (%)
Place of birth for the foreign-born population - South Africa (%)
Place of birth for the foreign-born population - Other Southern Africa (%)
Place of birth for the foreign-born population - Cabo Verde (%)
Place of birth for the foreign-born population - Ghana (%)
Place of birth for the foreign-born population - Liberia (%)
Place of birth for the foreign-born population - Nigeria (%)
Place of birth for the foreign-born population - Senegal (%)
Place of birth for the foreign-born population - Sierra Leone (%)
Place of birth for the foreign-born population - Other Western Africa (%)
Place of birth for the foreign-born population - Australia (%)
Place of birth for the foreign-born population - New Zealand (%)
Place of birth for the foreign-born population - Fiji (%)
Place of birth for the foreign-born population - Micronesia (%)
Place of birth for the foreign-born population - Bahamas (%)
Place of birth for the foreign-born population - Barbados (%)
Place of birth for the foreign-born population - Cuba (%)
Place of birth for the foreign-born population - Dominica (%)
Place of birth for the foreign-born population - Dominican Republic (%)
Place of birth for the foreign-born population - Grenada (%)
Place of birth for the foreign-born population - Haiti (%)
Place of birth for the foreign-born population - Jamaica (%)
Place of birth for the foreign-born population - St. Vincent and the Grenadines (%)
Place of birth for the foreign-born population - Trinidad and Tobago (%)
Place of birth for the foreign-born population - West Indies (%)
Place of birth for the foreign-born population - Other Caribbean (%)
Place of birth for the foreign-born population - Belize (%)
Place of birth for the foreign-born population - Costa Rica (%)
Place of birth for the foreign-born population - El Salvador (%)
Place of birth for the foreign-born population - Guatemala (%)
Place of birth for the foreign-born population - Honduras (%)
Place of birth for the foreign-born population - Mexico (%)
Place of birth for the foreign-born population - Nicaragua (%)
Place of birth for the foreign-born population - Panama (%)
Place of birth for the foreign-born population - Other Central America (%)
Place of birth for the foreign-born population - Argentina (%)
Place of birth for the foreign-born population - Bolivia (%)
Place of birth for the foreign-born population - Brazil (%)
Place of birth for the foreign-born population - Chile (%)
Place of birth for the foreign-born population - Colombia (%)
Place of birth for the foreign-born population - Ecuador (%)
Place of birth for the foreign-born population - Guyana (%)
Place of birth for the foreign-born population - Peru (%)
Place of birth for the foreign-born population - Uruguay (%)
Place of birth for the foreign-born population - Venezuela (%)
Place of birth for the foreign-born population - Other South America (%)
Place of birth for the foreign-born population - Canada (%)
Place of birth for the foreign-born population - Other Northern America (%)
Place of birth for the foreign-born population - Other (%)
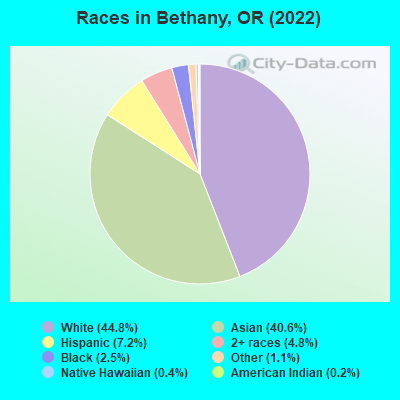
According to 2022 data, the most numerous races in Bethany, OR are White alone (13,890 residents), Hispanic (2,245 residents), and Two or more races (1,488 residents). 54.8% of Bethany residents speak English at home.
Race distribution in Bethany 13,890 44.8% White alone 12,579 40.6% Asian alone 2,245 7.2% Hispanic 1,488 4.8% Two or more races 775 2.5% Black alone 355 1.1% Other race alone 112 0.4% Native Hawaiian and Other 68 0.2% American Indian alone
2000 2022
2,857,616 83.5% White alone 275,314 8.0% Hispanic 100,333 2.9% Asian alone 82,733 2.4% Two or more races 53,325 1.6% Black alone 40,130 1.2% American Indian alone 7,398 0.2% Native Hawaiian and Other 4,550 0.1% Other race alone
3,037,571 71.6% White alone 609,538 14.4% Hispanic 252,744 6.0% Two or more races 191,283 4.5% Asian alone 78,228 1.8% Black alone 29,399 0.7% American Indian alone 25,731 0.6% Other race alone 15,643 0.4% Native Hawaiian and Other
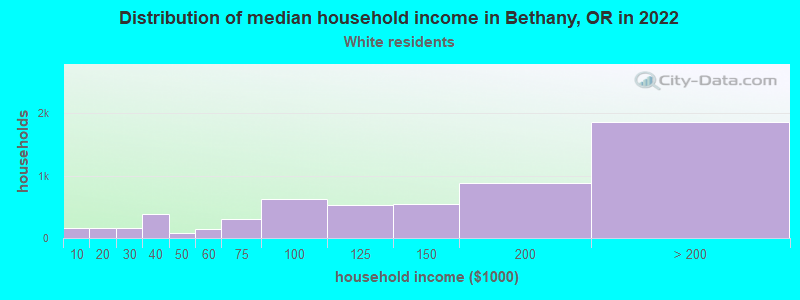
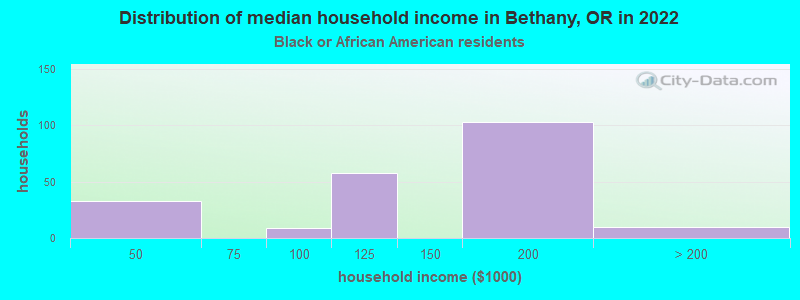
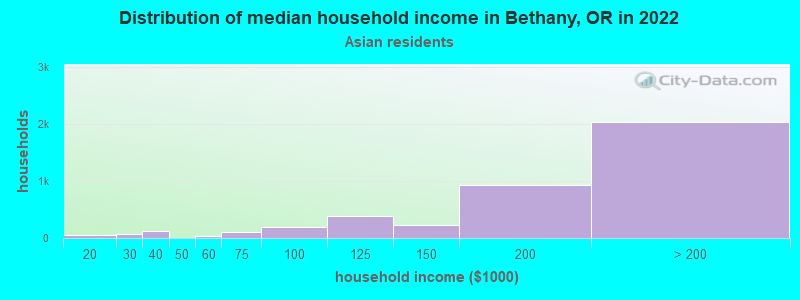
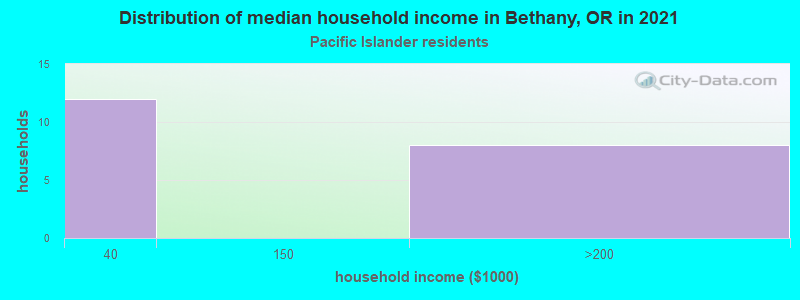
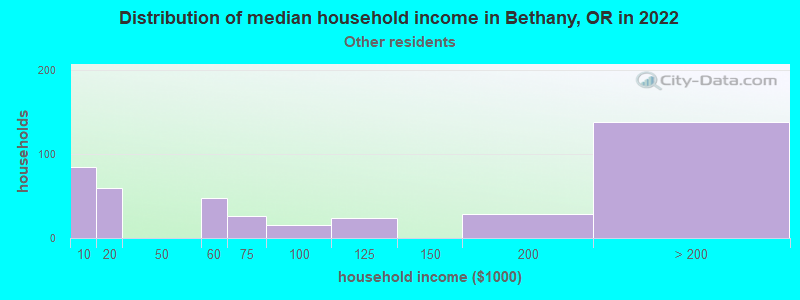
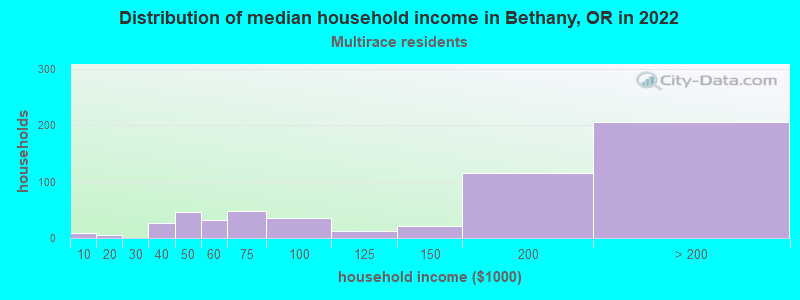
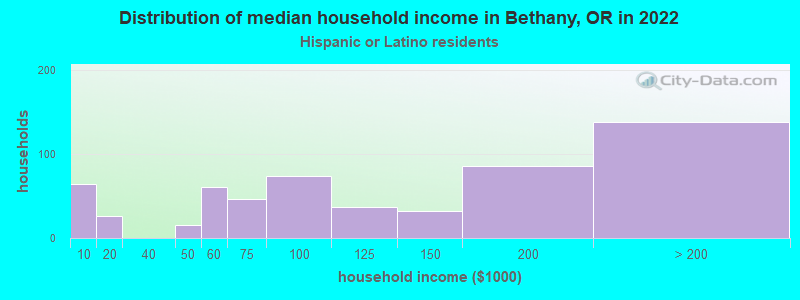
Income and house value in Bethany Median household income in 2022 $136,898 White non-Hispanic householders$106,309 Black householdersover $200,000 Asian householders$150,453 Two or more races householders$106,139 Hispanic or Latino race householders
Median age by race in Bethany
41.1 Median age for White residents42.5 38.6 40.1 Median age for Black or African American residents35.2 37.9 16.3 Median age for American Indian / Alaska Native residents18.5 -658,119,657.5 38.9 Median age for Asian residents40.4 37.2 43.9 Median age for Native Hawaiian / Pacific Islander residents18.5 65.7 35.3 Median age for Other race residents43.7 21.9 19.0 Median age for Two or more races residents22.1 18.1 42.2 Median age for White alone residents42.5 40.6 21.3 Median age for Hispanic or Latino residents27.0 19.6
Owner/renter occupied households by race in Bethany
House owners and renters - White residents 3,536 60.6% Owner occupied2,295 39.4% Renter occupiedHouse owners and renters - Black or African American residents 80 44.0% Owner occupied102 56.0% Renter occupiedHouse owners and renters - American Indian / Alaska Native residents 14 100.0% Owner occupiedHouse owners and renters - Asian residents 3,633 87.4% Owner occupied526 12.6% Renter occupiedHouse owners and renters - Native Hawaiian / Pacific Islander residents 27 100.0% Owner occupiedHouse owners and renters - Other race residents 132 39.0% Owner occupied207 61.0% Renter occupiedHouse owners and renters - Two or more races residents 335 60.0% Owner occupied224 40.0% Renter occupiedHouse owners and renters - White alone residents 3,384 59.2% Owner occupied2,334 40.8% Renter occupiedHouse owners and renters - Hispanic or Latino residents 207 36.6% Owner occupied359 63.4% Renter occupied
Language usage in Bethany
English speakers - Total 54.8% of residents of Bethany speak English at home.
3.0% of residents speak Spanish at home 696 79.6% Speak English very well178 20.4% Speak English less than very well43.5% of residents speak other language at home 9,637 75.8% Speak English very well3,080 24.2% Speak English less than very well
English speakers - Born in the United States 85.3% of residents of Bethany speak English at home.
2.3% of residents speak Spanish at home 250 100.0% Speak English very well12.2% of residents speak other language at home 1,208 91.2% Speak English very well117 8.8% Speak English less than very well
English speakers - Native, born elsewhere 47.0% of residents of Bethany speak English at home.
1.5% of residents speak Spanish at home 6 100.0% Speak English less than very well86.9% of residents speak other language at home 318 91.9% Speak English very well28 8.1% Speak English less than very well
English speakers - Foreign-born 9.5% of residents of Bethany speak English at home.
4.4% of residents speak Spanish at home 342 72.0% Speak English very well133 28.0% Speak English less than very well83.3% of residents speak other language at home 6,280 69.5% Speak English very well2,759 30.5% Speak English less than very well
White (Caucasian) - Speak only English Native:
96.8% (11,699)Foreign-born:
12.9% (183)
White (Caucasian) - Speak another language Native:
3.4% (411)Foreign-born:
84.9% (1,202)
Black or African American - Speak only English Native:
93.9% (529)Foreign-born:
80.4% (208)
Asian - Speak only English Native:
29.7% (1,085)Foreign-born:
7.8% (620)
Asian - Speak another language Native:
73.7% (2,692)Foreign-born:
93.2% (7,418)
Other race - Speak another language Native:
39.4% (212)Foreign-born:
100.0% (436)
Two or more races - Speak only English Native:
72.7% (1,186)Foreign-born:
3.0% (12)
Two or more races - Speak another language Native:
28.0% (456)Foreign-born:
97.1% (399)
White alone - Speak only English Native:
95.8% (11,259)Foreign-born:
11.9% (191)
White alone - Speak another language Native:
4.4% (517)Foreign-born:
87.7% (1,406)
Hispanic or Latino - Speak only English Native:
72.9% (956)Foreign-born:
2.4% (14)
Hispanic or Latino - Speak another language Native:
23.2% (304)Foreign-born:
98.1% (557)
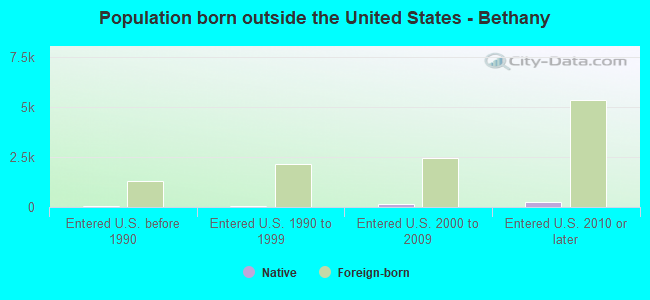
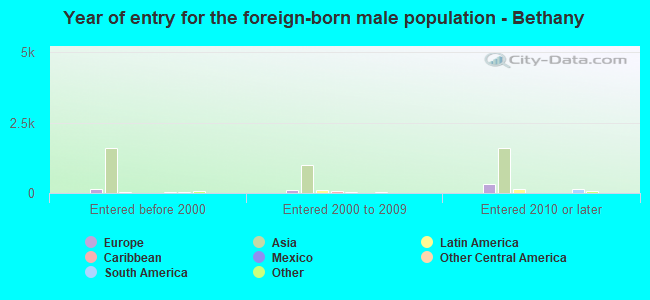
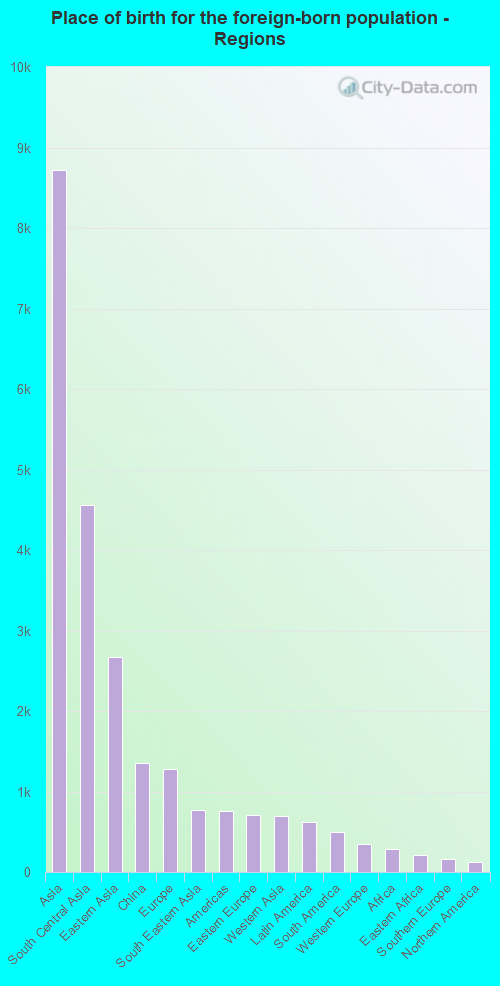
Foreign-born residents in Bethany
Marital status for residents in Bethany Marital status - White (Caucasian) population 15 years and over
Males 26.4% Never married61.5% Now married0.3% Separated1.6% Widowed10.3% DivorcedFemales 27.9% Never married53.4% Now married0.5% Separated4.3% Widowed13.9% DivorcedWomen who gave birth in the past 12 months Now married:
100.0% (167)Unmarried:
0.0% (0)
Women who did not give birth in the past 12 months Now married:
48.1% (1,676)Unmarried:
51.9% (1,806)
Marital status - Black or African American population 15 years and over
Males 15.2% Never married84.8% Now married0.0% Separated0.0% Widowed0.0% DivorcedFemales 30.2% Never married26.5% Now married11.9% Separated18.0% Widowed13.4% DivorcedWomen who did not give birth in the past 12 months Now married:
37.5% (105)Unmarried:
62.5% (174)
Marital status - Asian population 15 years and over
Males 20.2% Never married77.1% Now married0.0% Separated1.5% Widowed1.2% DivorcedFemales 14.4% Never married78.0% Now married0.0% Separated3.6% Widowed4.0% DivorcedWomen who gave birth in the past 12 months Now married:
100.0% (176)Unmarried:
0.0% (0)
Women who did not give birth in the past 12 months Now married:
79.3% (2,591)Unmarried:
20.7% (678)
Marital status - Native Hawaiian / Pacific Islander population 15 years and over
Males 62.2% Never married37.8% Now married0.0% Separated0.0% Widowed0.0% DivorcedFemales 22.0% Never married36.0% Now married0.0% Separated42.0% Widowed0.0% DivorcedWomen who did not give birth in the past 12 months Now married:
47.6% (11)Unmarried:
52.4% (12)
Marital status - Other race population 15 years and over
Males 30.7% Never married69.3% Now married0.0% Separated0.0% Widowed0.0% DivorcedFemales 42.2% Never married51.3% Now married0.0% Separated0.0% Widowed6.5% DivorcedWomen who did not give birth in the past 12 months Now married:
52.3% (251)Unmarried:
47.7% (229)
Marital status - Two or more races population 15 years and over
Males 46.3% Never married53.1% Now married0.0% Separated0.6% Widowed0.0% DivorcedFemales 55.5% Never married38.5% Now married0.0% Separated3.1% Widowed2.9% DivorcedWomen who did not give birth in the past 12 months Now married:
31.1% (184)Unmarried:
68.9% (407)
Marital status - White alone, not Hispanic / Latino population 15 years and over
Males 26.1% Never married61.0% Now married0.3% Separated1.7% Widowed11.0% DivorcedFemales 27.3% Never married53.2% Now married0.6% Separated4.5% Widowed14.4% DivorcedWomen who gave birth in the past 12 months Now married:
100.0% (177)Unmarried:
0.0% (0)
Women who did not give birth in the past 12 months Now married:
48.0% (1,659)Unmarried:
52.0% (1,798)
Marital status - Hispanic or Latino population 15 years and over
Males 44.4% Never married55.5% Now married0.0% Separated0.0% Widowed0.1% DivorcedFemales 57.0% Never married38.6% Now married0.0% Separated0.0% Widowed4.4% DivorcedWomen who did not give birth in the past 12 months Now married:
33.6% (259)Unmarried:
66.4% (511)
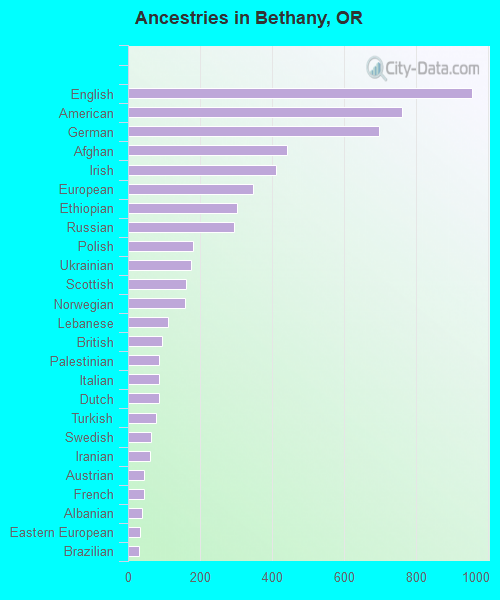
Ancestries in Bethany
954 5.0% English760 4.0% American697 3.7% German442 2.3% Afghan410 2.2% Irish346 1.8% European303 1.6% Ethiopian295 1.5% Russian181 1.0% Polish175 0.9% Ukrainian161 0.8% Scottish159 0.8% Norwegian111 0.6% Lebanese94 0.5% British87 0.5% Palestinian87 0.5% Italian85 0.4% Dutch79 0.4% Turkish65 0.3% Swedish62 0.3% Iranian45 0.2% Austrian45 0.2% French38 0.2% Albanian32 0.2% Eastern European31 0.2% Brazilian27 0.1% Armenian26 0.1% Hungarian22 0.1% French Canadian21 0.1% Greek20 0.1% Welsh17 0.09% Arab16 0.08% Slovak15 0.08% Scandinavian10 0.05% Croatian9 0.05% Scotch-Irish7 0.04% Macedonian6 0.03% Swiss5 0.03% Australian5 0.03% Canadian
Geographical mobility in Bethany Same house 1 year ago 12,642 89.7% White (Caucasian)325 42.2% Black or African American86 100.0% American Indian / Alaska Native11,195 89.3% Asian126 100.0% Native Hawaiian / Pacific Islander870 84.5% Other race2,124 92.6% Two or more races12,292 89.6% White alone, not Hispanic / Latino2,101 93.2% Hispanic or LatinoMoved within same county 619 4.4% White / Caucasian706 5.6% Asian112 10.9% Other race88 3.8% Two or more races640 4.7% White alone, not Hispanic / Latino56 2.5% Hispanic or LatinoMoved within same state 327 2.3% White / Caucasian278 36.0% Black or African American103 0.8% Asian82 3.6% Two or more races283 2.1% White alone, not Hispanic / Latino27 1.2% Hispanic or LatinoMoved from different state 477 3.4% White / Caucasian103 13.3% Black or African American300 2.4% Asian45 4.3% Other race460 3.4% White alone, not Hispanic / Latino123 5.5% Hispanic or LatinoMoved from abroad 22 0.2% White174 1.4% Asian24 0.2% White alone, not Hispanic / Latino
Children Nativity (place of birth) in Bethany
Children under 6 years - Living with two parents Both parents native 421 100.0% NativeBoth parents foreign-born 1,241 80.5% Native301 19.5% Foreign-bornOne native, one foreign-born parent 192 100.0% NativeChildren under 6 years - Living with one parent Native parent 61 100.0% NativeForeign-born parent 22 100.0% NativeChildren 6 to 17 years - Living with two parents Both parents native 1,828 98.0% Native37 2.0% Foreign-bornBoth parents foreign-born 2,291 75.2% Native756 24.8% Foreign-bornOne native, one foreign-born parent 597 97.2% Native17 2.8% Foreign-bornChildren 6 to 17 years - Living with one parent Native parent 686 100.0% NativeForeign-born parent 146 51.3% Native139 48.7% Foreign-born
Grandparents responsible for own grandchildren in Bethany
Grandparents (30 to 59 years) White / Caucasian 11 46.7% Responsible for grandchildren12 53.3% Not responsible for grandchildrenAsian 25 100.0% Not responsible for grandchildrenWhite alone, not Hispanic / Latino 11 42.5% Responsible for grandchildren15 57.5% Not responsible for grandchildrenGrandparents (60 years and over) White / Caucasian 47 100.0% Not responsible for grandchildrenAsian 16 6.3% Responsible for grandchildren234 93.7% Not responsible for grandchildrenWhite alone, not Hispanic / Latino 57 100.0% Not responsible for grandchildren