Races in Berkley, Massachusetts (MA) Detailed Stats
Ancestries, Foreign-born residents, place of birth

Recent posts about races in Berkley, Massachusetts on our local forum with over 2,400,000 registered users:
 | Family moving to Berkley MA from Florida needs info (29 replies) |
| New Bedford --> Boston commute? (32 replies) |
| Moving to Boston - Oh my Head!! (27 replies) |
| Best haunted houses... (11 replies) |
| How to Fix Fall River, MA (125 replies) |
| Brockton vs. Lawrence (33 replies) |
Latest news about races in Berkley, MA collected exclusively by city-data.com from local newspapers, TV, and radio stations
2.9% of Berkley, MA residents are foreign-born (2.4% born in Europe), which is 531.0% less than the foreign-born rate of 18.0% across the entire state of Massachusetts.
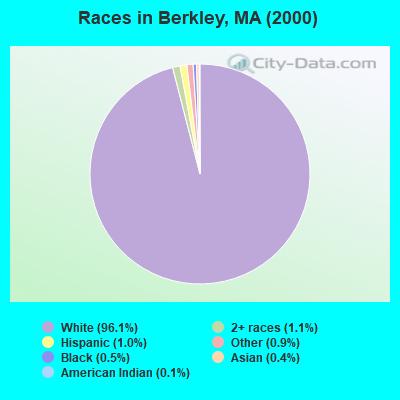
Race distribution in Berkley

- 5,52296.1%White alone
- 621.1%Two or more races
- 551.0%Hispanic
- 490.9%Other race alone
- 310.5%Black alone
- 210.4%Asian alone
- 70.1%American Indian alone
- 20.03%Native Hawaiian and Other
Pacific Islander alone
2000
2022
-
- 5,198,35981.9%White alone
- 428,7296.8%Hispanic
- 318,3295.0%Black alone
- 236,7863.7%Asian alone
- 110,3381.7%Two or more races
- 43,5860.7%Other race alone
- 11,2640.2%American Indian alone
- 1,7060.03%Native Hawaiian and Other
Pacific Islander alone

-
- 4,676,62767.0%White alone
- 911,03813.0%Hispanic
- 501,4637.2%Asian alone
- 459,7406.6%Black alone
- 341,8894.9%Two or more races
- 84,4031.2%Other race alone
- 5,8380.08%American Indian alone
- 9760.01%Native Hawaiian and Other
Pacific Islander alone

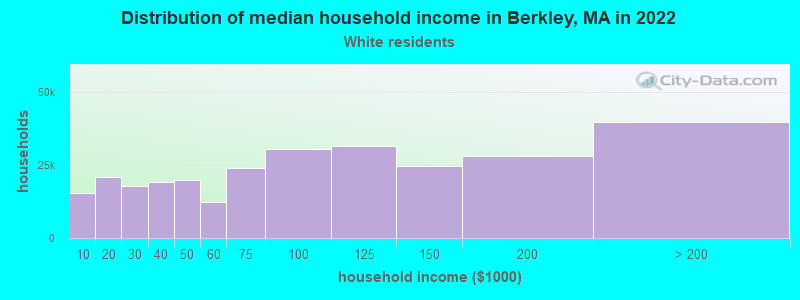
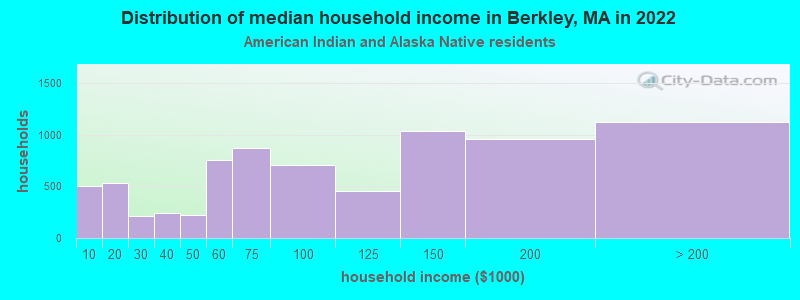
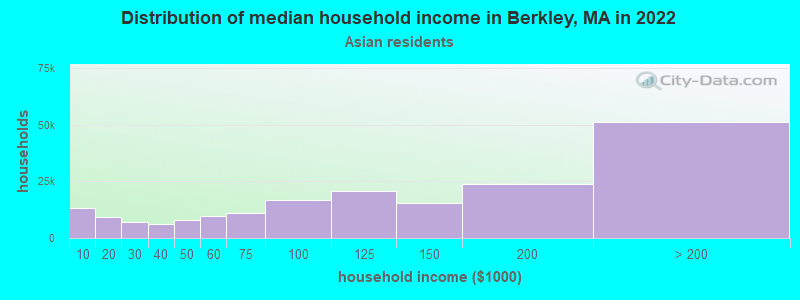
Income and house value in Berkley
- Median household income in 2022
- $128,219White non-Hispanic householders
- $94,787American Indian and Alaska Native householders
- $128,050Asian householders
- $115,609Some other race householders
- $60,475Two or more races householders
- over $200,000Hispanic or Latino race householders
- Median 2022 house value
- $494,259White Non-Hispanic householders
- $330,387Asian householders
- $501,601Some other race householders
- $807,613Two or more races householders
- $447,858Hispanic or Latino householders
Household income for White non-Hispanic householders
Household income for American Indian and Alaska Native householders
Household income for Asian householders
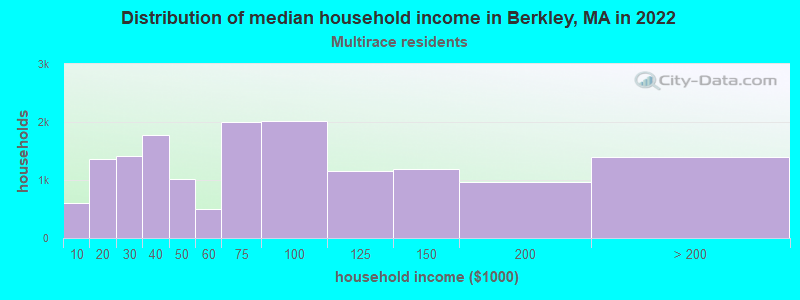
Household income for Two or more races householders
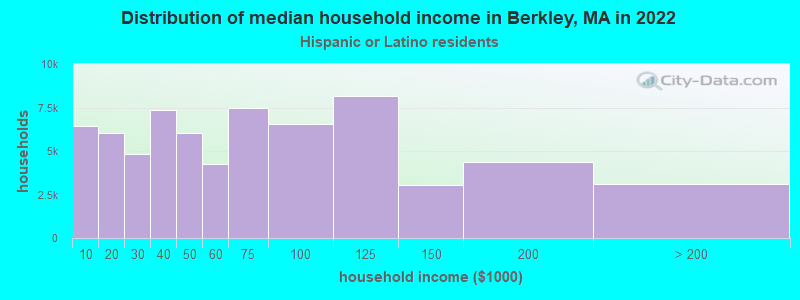
Household income for Hispanic or Latino race householders
Foreign-born residents in Berkley
164 residents are foreign born (2.4% Europe).
| This city: | 2.9% |
| Massachusetts: | 12.2% |
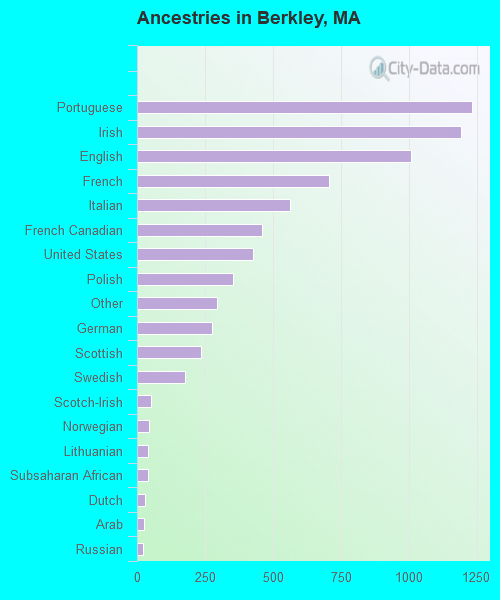
Ancestries in Berkley

- 1,23317.2%Portuguese
- 1,19216.6%Irish
- 1,00914.0%English
- 7089.9%French
- 5617.8%Italian
- 4616.4%French Canadian
- 4275.9%United States
- 3544.9%Polish
- 2934.1%Other
- 2763.8%German
- 2363.3%Scottish
- 1762.4%Swedish
- 500.7%Scotch-Irish
- 440.6%Norwegian
- 400.6%Lithuanian
- 390.5%Subsaharan African
- 280.4%Dutch
- 240.3%Arab
- 210.3%Russian
- 70.10%Hungarian
- 60.08%Welsh
Zip codes: 02779.