Races in Berea, Kentucky (KY) Detailed Stats
Data:
Races - White alone (%)
Races - White alone (% change since 2000)
Races - Black alone (%)
Races - Black alone (% change since 2000)
Races - American Indian alone (%)
Races - American Indian alone (% change since 2000)
Races - Asian alone (%)
Races - Asian alone (% change since 2000)
Races - Hispanic (%)
Races - Hispanic (% change since 2000)
Races - Native Hawaiian and Other Pacific Islander alone (%)
Races - Native Hawaiian and Other Pacific Islander alone (% change since 2000)
Races - Two or more races(%)
Races - Two or more races(% change since 2000)
Races - Other race alone (%)
Races - Other race alone (% change since 2000)
Racial diversity
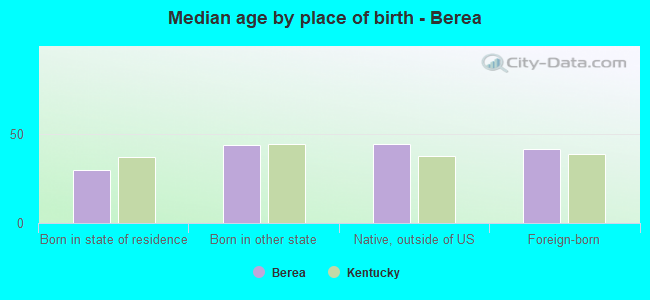
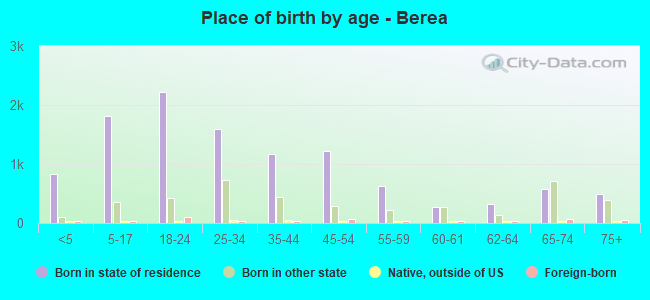
Place of birth - Born in state of residence (%)
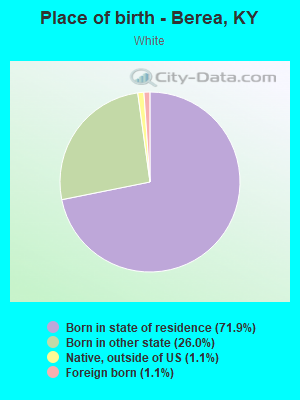
Place of birth - Born in state of residence (%) - White
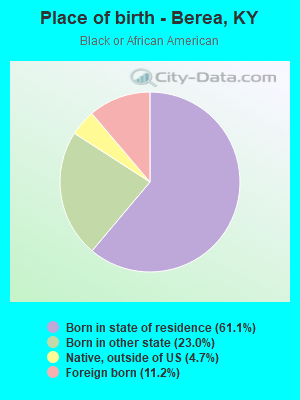
Place of birth - Born in state of residence (%) - Black or African American
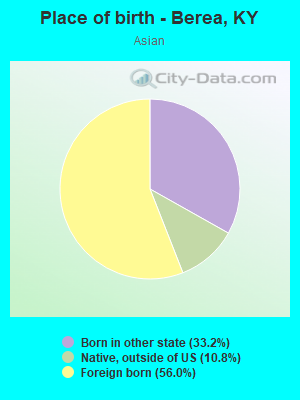
Place of birth - Born in state of residence (%) - Asian
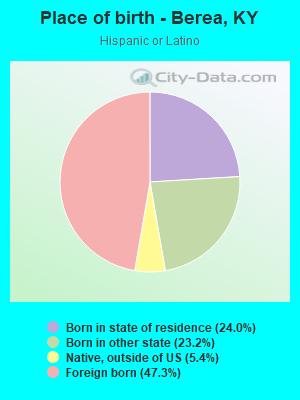
Place of birth - Born in state of residence (%) - Hispanic or Latino
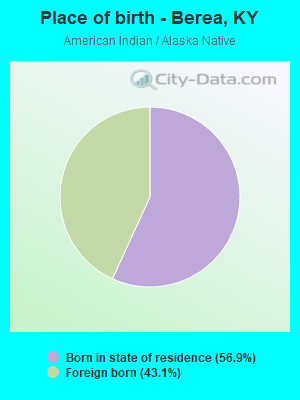
Place of birth - Born in state of residence (%) - American Indian and Alaska Native
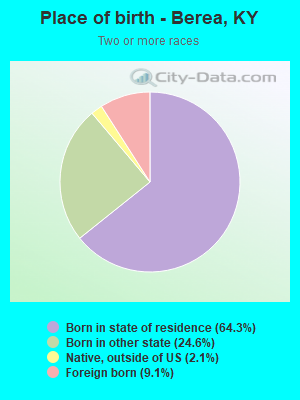
Place of birth - Born in state of residence (%) - Multirace
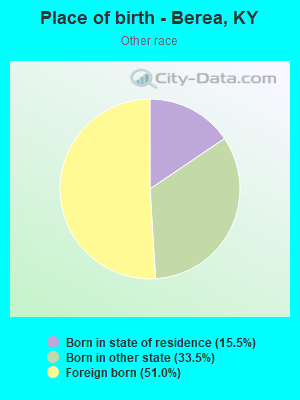
Place of birth - Born in state of residence (%) - Other Race
Place of birth - Born in other state (%)
Place of birth - Born in other state (%) - White
Place of birth - Born in other state (%) - Black or African American
Place of birth - Born in other state (%) - Asian
Place of birth - Born in other state (%) - Hispanic or Latino
Place of birth - Born in other state (%) - American Indian and Alaska Native
Place of birth - Born in other state (%) - Multirace
Place of birth - Born in other state (%) - Other Race
Place of birth - Native, outside of US (%)
Place of birth - Native, outside of US (%) - White
Place of birth - Native, outside of US (%) - Black or African American
Place of birth - Native, outside of US (%) - Asian
Place of birth - Native, outside of US (%) - Hispanic or Latino
Place of birth - Native, outside of US (%) - American Indian and Alaska Native
Place of birth - Native, outside of US (%) - Multirace
Place of birth - Native, outside of US (%) - Other Race
Place of birth - Foreign born (%)
Place of birth - Foreign born (%) - White
Place of birth - Foreign born (%) - Black or African American
Place of birth - Foreign born (%) - Asian
Place of birth - Foreign born (%) - Hispanic or Latino
Place of birth - Foreign born (%) - American Indian and Alaska Native
Place of birth - Foreign born (%) - Multirace
Place of birth - Foreign born (%) - Other Race
Residents speaking English at home (%)
Residents speaking English at home - Born in the United States (%)
Residents speaking English at home - Native, born elsewhere (%)
Residents speaking English at home - Foreign born (%)
Residents speaking Spanish at home (%)
Residents speaking Spanish at home - Born in the United States (%)
Residents speaking Spanish at home - Native, born elsewhere (%)
Residents speaking Spanish at home - Foreign born (%)
Residents speaking other language at home (%)
Residents speaking other language at home - Born in the United States (%)
Residents speaking other language at home - Native, born elsewhere (%)
Residents speaking other language at home - Foreign born (%)
Marital status - Never married (%)
Marital status - Now married (%)
Marital status - Separated (%)
Marital status - Widowed (%)
Marital status - Divorced (%)
Ancestries Reported - Arab (%)
Ancestries Reported - Czech (%)
Ancestries Reported - Danish (%)
Ancestries Reported - Dutch (%)
Ancestries Reported - English (%)
Ancestries Reported - French (%)
Ancestries Reported - French Canadian (%)
Ancestries Reported - German (%)
Ancestries Reported - Greek (%)
Ancestries Reported - Hungarian (%)
Ancestries Reported - Irish (%)
Ancestries Reported - Italian (%)
Ancestries Reported - Lithuanian (%)
Ancestries Reported - Norwegian (%)
Ancestries Reported - Polish (%)
Ancestries Reported - Portuguese (%)
Ancestries Reported - Russian (%)
Ancestries Reported - Scotch-Irish (%)
Ancestries Reported - Scottish (%)
Ancestries Reported - Slovak (%)
Ancestries Reported - Subsaharan African (%)
Ancestries Reported - Swedish (%)
Ancestries Reported - Swiss (%)
Ancestries Reported - Ukrainian (%)
Ancestries Reported - United States (%)
Ancestries Reported - Welsh (%)
Ancestries Reported - West Indian (%)
Ancestries Reported - Other (%)
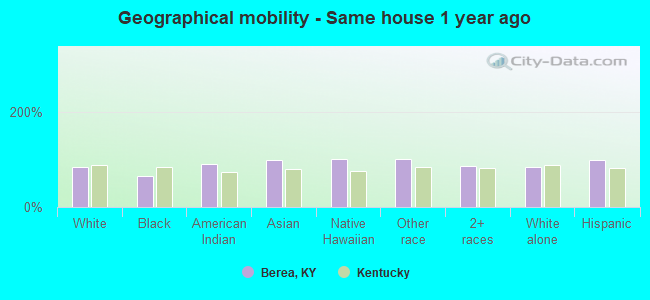
Geographical mobility - Same house 1 year ago (%)
Geographical mobility - Same house 1 year ago (%) - White
Geographical mobility - Same house 1 year ago (%) - Black or African American
Geographical mobility - Same house 1 year ago (%) - Asian
Geographical mobility - Same house 1 year ago (%) - Hispanic or Latino
Geographical mobility - Same house 1 year ago (%) - American Indian and Alaska Native
Geographical mobility - Same house 1 year ago (%) - Multirace
Geographical mobility - Same house 1 year ago (%) - Other Race
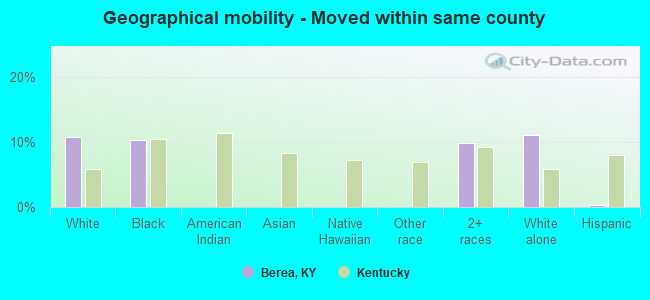
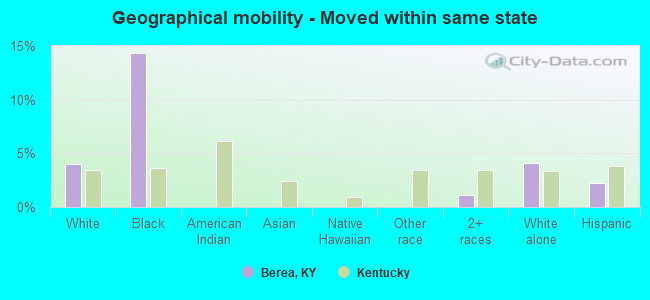
Geographical mobility - Moved within same county (%)
Geographical mobility - Moved within same county (%) - White
Geographical mobility - Moved within same county (%) - Black or African American
Geographical mobility - Moved within same county (%) - Asian
Geographical mobility - Moved within same county (%) - Hispanic or Latino
Geographical mobility - Moved within same county (%) - American Indian and Alaska Native
Geographical mobility - Moved within same county (%) - Multirace
Geographical mobility - Moved within same county (%) - Other Race
Geographical mobility - Moved from different county within same state (%)
Geographical mobility - Moved from different county within same state (%) - White
Geographical mobility - Moved from different county within same state (%) - Black or African American
Geographical mobility - Moved from different county within same state (%) - Asian
Geographical mobility - Moved from different county within same state (%) - Hispanic or Latino
Geographical mobility - Moved from different county within same state (%) - American Indian and Alaska Native
Geographical mobility - Moved from different county within same state (%) - Multirace
Geographical mobility - Moved from different county within same state (%) - Other Race
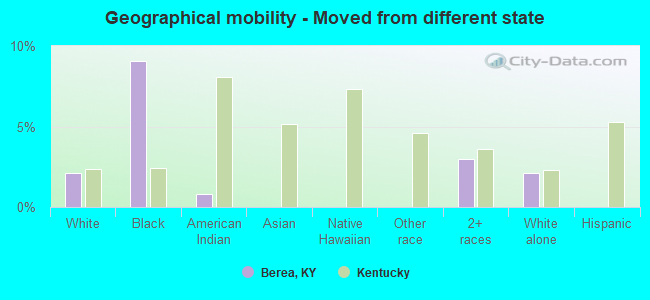
Geographical mobility - Moved from different state (%)
Geographical mobility - Moved from different state (%) - White
Geographical mobility - Moved from different state (%) - Black or African American
Geographical mobility - Moved from different state (%) - Asian
Geographical mobility - Moved from different state (%) - Hispanic or Latino
Geographical mobility - Moved from different state (%) - American Indian and Alaska Native
Geographical mobility - Moved from different state (%) - Multirace
Geographical mobility - Moved from different state (%) - Other Race
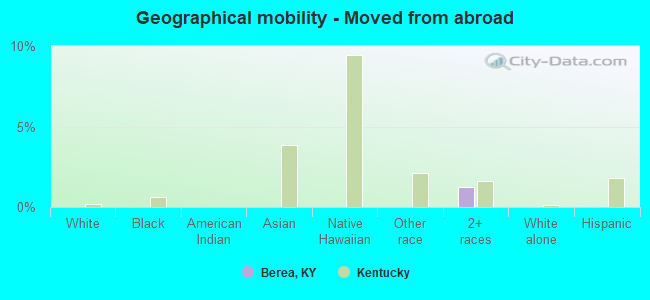
Geographical mobility - Moved from abroad (%)
Geographical mobility - Moved from abroad (%) - White
Geographical mobility - Moved from abroad (%) - Black or African American
Geographical mobility - Moved from abroad (%) - Asian
Geographical mobility - Moved from abroad (%) - Hispanic or Latino
Geographical mobility - Moved from abroad (%) - American Indian and Alaska Native
Geographical mobility - Moved from abroad (%) - Multirace
Geographical mobility - Moved from abroad (%) - Other Race
Place of birth for the foreign-born population - Ireland (%)
Place of birth for the foreign-born population - Denmark (%)
Place of birth for the foreign-born population - Norway (%)
Place of birth for the foreign-born population - Sweden (%)
Place of birth for the foreign-born population - United Kingdom (%)
Place of birth for the foreign-born population - England (%)
Place of birth for the foreign-born population - Scotland (%)
Place of birth for the foreign-born population - Other Northern Europe (%)
Place of birth for the foreign-born population - Austria (%)
Place of birth for the foreign-born population - Belgium (%)
Place of birth for the foreign-born population - France (%)
Place of birth for the foreign-born population - Germany (%)
Place of birth for the foreign-born population - Netherlands (%)
Place of birth for the foreign-born population - Switzerland (%)
Place of birth for the foreign-born population - Other Western Europe (%)
Place of birth for the foreign-born population - Greece (%)
Place of birth for the foreign-born population - Italy (%)
Place of birth for the foreign-born population - Portugal (%)
Place of birth for the foreign-born population - Spain (%)
Place of birth for the foreign-born population - Other Southern Europe (%)
Place of birth for the foreign-born population - Albania (%)
Place of birth for the foreign-born population - Belarus (%)
Place of birth for the foreign-born population - Bosnia and Herzegovina (%)
Place of birth for the foreign-born population - Bulgaria (%)
Place of birth for the foreign-born population - Croatia (%)
Place of birth for the foreign-born population - Czechoslovakia (%)
Place of birth for the foreign-born population - Hungary (%)
Place of birth for the foreign-born population - Latvia (%)
Place of birth for the foreign-born population - Lithuania (%)
Place of birth for the foreign-born population - North Macedonia (Macedonia) (%)
Place of birth for the foreign-born population - Moldova (%)
Place of birth for the foreign-born population - Poland (%)
Place of birth for the foreign-born population - Romania (%)
Place of birth for the foreign-born population - Russia (%)
Place of birth for the foreign-born population - Serbia (%)
Place of birth for the foreign-born population - Ukraine (%)
Place of birth for the foreign-born population - Other Eastern Europe (%)
Place of birth for the foreign-born population - China (%)
Place of birth for the foreign-born population - Hong Kong (%)
Place of birth for the foreign-born population - Taiwan (%)
Place of birth for the foreign-born population - Japan (%)
Place of birth for the foreign-born population - Korea (%)
Place of birth for the foreign-born population - Other Eastern Asia (%)
Place of birth for the foreign-born population - Afghanistan (%)
Place of birth for the foreign-born population - Bangladesh (%)
Place of birth for the foreign-born population - India (%)
Place of birth for the foreign-born population - Iran (%)
Place of birth for the foreign-born population - Kazakhstan (%)
Place of birth for the foreign-born population - Nepal (%)
Place of birth for the foreign-born population - Pakistan (%)
Place of birth for the foreign-born population - Sri Lanka (%)
Place of birth for the foreign-born population - Uzbekistan (%)
Place of birth for the foreign-born population - Other South Central Asia (%)
Place of birth for the foreign-born population - Burma (%)
Place of birth for the foreign-born population - Cambodia (%)
Place of birth for the foreign-born population - Indonesia (%)
Place of birth for the foreign-born population - Laos (%)
Place of birth for the foreign-born population - Malaysia (%)
Place of birth for the foreign-born population - Philippines (%)
Place of birth for the foreign-born population - Singapore (%)
Place of birth for the foreign-born population - Thailand (%)
Place of birth for the foreign-born population - Vietnam (%)
Place of birth for the foreign-born population - Other South Eastern Asia (%)
Place of birth for the foreign-born population - Armenia (%)
Place of birth for the foreign-born population - Iraq (%)
Place of birth for the foreign-born population - Israel (%)
Place of birth for the foreign-born population - Jordan (%)
Place of birth for the foreign-born population - Kuwait (%)
Place of birth for the foreign-born population - Lebanon (%)
Place of birth for the foreign-born population - Saudi Arabia (%)
Place of birth for the foreign-born population - Syria (%)
Place of birth for the foreign-born population - Turkey (%)
Place of birth for the foreign-born population - Yemen (%)
Place of birth for the foreign-born population - Other Western Asia (%)
Place of birth for the foreign-born population - Eritrea (%)
Place of birth for the foreign-born population - Ethiopia (%)
Place of birth for the foreign-born population - Kenya (%)
Place of birth for the foreign-born population - Somalia (%)
Place of birth for the foreign-born population - Uganda (%)
Place of birth for the foreign-born population - Zimbabwe (%)
Place of birth for the foreign-born population - Other Eastern Africa (%)
Place of birth for the foreign-born population - Cameroon (%)
Place of birth for the foreign-born population - Congo (%)
Place of birth for the foreign-born population - Democratic Republic of Congo (Zaire) (%)
Place of birth for the foreign-born population - Other Middle Africa (%)
Place of birth for the foreign-born population - Egypt (%)
Place of birth for the foreign-born population - Morocco (%)
Place of birth for the foreign-born population - Sudan (%)
Place of birth for the foreign-born population - Other Northern Africa (%)
Place of birth for the foreign-born population - South Africa (%)
Place of birth for the foreign-born population - Other Southern Africa (%)
Place of birth for the foreign-born population - Cabo Verde (%)
Place of birth for the foreign-born population - Ghana (%)
Place of birth for the foreign-born population - Liberia (%)
Place of birth for the foreign-born population - Nigeria (%)
Place of birth for the foreign-born population - Senegal (%)
Place of birth for the foreign-born population - Sierra Leone (%)
Place of birth for the foreign-born population - Other Western Africa (%)
Place of birth for the foreign-born population - Australia (%)
Place of birth for the foreign-born population - New Zealand (%)
Place of birth for the foreign-born population - Fiji (%)
Place of birth for the foreign-born population - Micronesia (%)
Place of birth for the foreign-born population - Bahamas (%)
Place of birth for the foreign-born population - Barbados (%)
Place of birth for the foreign-born population - Cuba (%)
Place of birth for the foreign-born population - Dominica (%)
Place of birth for the foreign-born population - Dominican Republic (%)
Place of birth for the foreign-born population - Grenada (%)
Place of birth for the foreign-born population - Haiti (%)
Place of birth for the foreign-born population - Jamaica (%)
Place of birth for the foreign-born population - St. Vincent and the Grenadines (%)
Place of birth for the foreign-born population - Trinidad and Tobago (%)
Place of birth for the foreign-born population - West Indies (%)
Place of birth for the foreign-born population - Other Caribbean (%)
Place of birth for the foreign-born population - Belize (%)
Place of birth for the foreign-born population - Costa Rica (%)
Place of birth for the foreign-born population - El Salvador (%)
Place of birth for the foreign-born population - Guatemala (%)
Place of birth for the foreign-born population - Honduras (%)
Place of birth for the foreign-born population - Mexico (%)
Place of birth for the foreign-born population - Nicaragua (%)
Place of birth for the foreign-born population - Panama (%)
Place of birth for the foreign-born population - Other Central America (%)
Place of birth for the foreign-born population - Argentina (%)
Place of birth for the foreign-born population - Bolivia (%)
Place of birth for the foreign-born population - Brazil (%)
Place of birth for the foreign-born population - Chile (%)
Place of birth for the foreign-born population - Colombia (%)
Place of birth for the foreign-born population - Ecuador (%)
Place of birth for the foreign-born population - Guyana (%)
Place of birth for the foreign-born population - Peru (%)
Place of birth for the foreign-born population - Uruguay (%)
Place of birth for the foreign-born population - Venezuela (%)
Place of birth for the foreign-born population - Other South America (%)
Place of birth for the foreign-born population - Canada (%)
Place of birth for the foreign-born population - Other Northern America (%)
Place of birth for the foreign-born population - Other (%)
Latest news about races in Berea, KY collected exclusively by city-data.com from local newspapers, TV, and radio stations
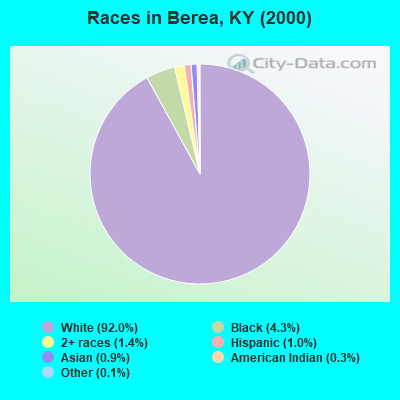
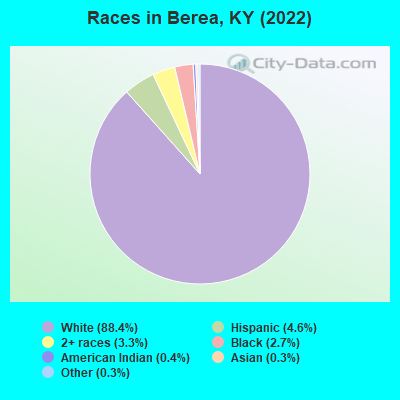
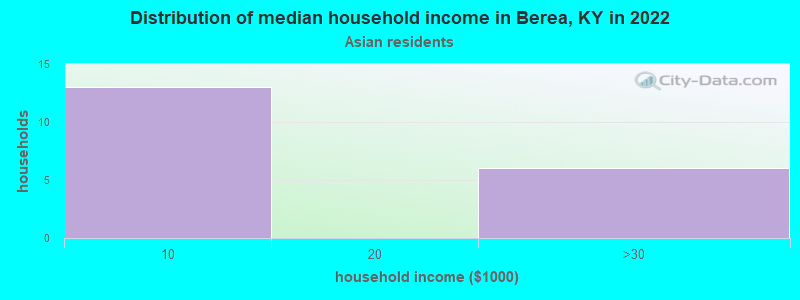
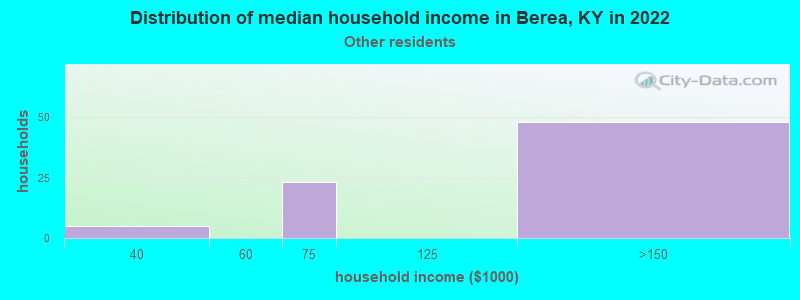
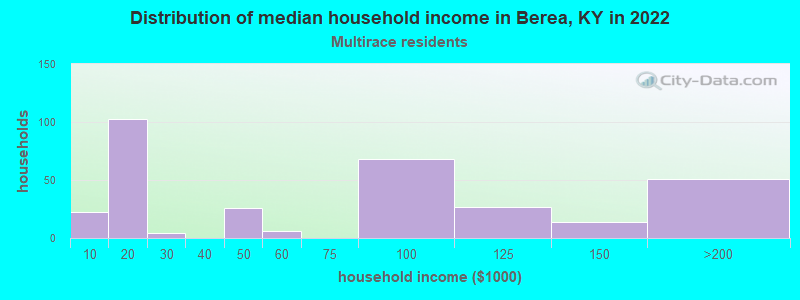
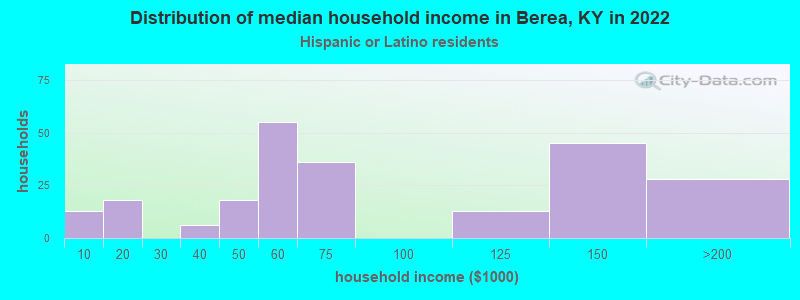
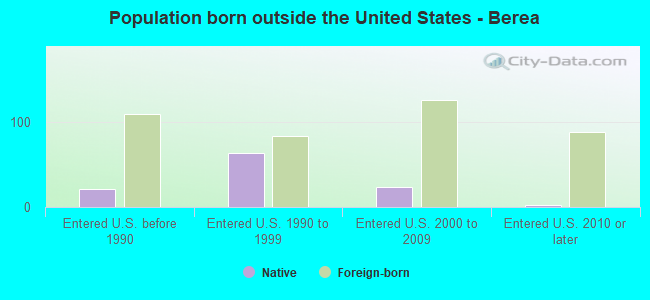
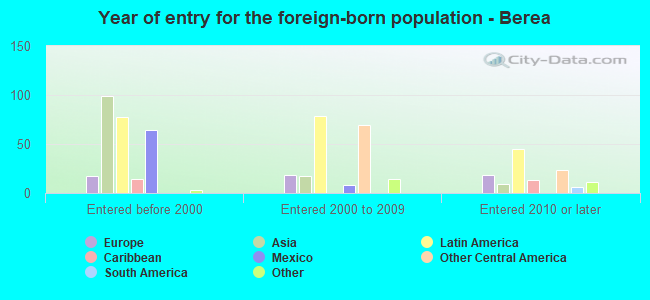
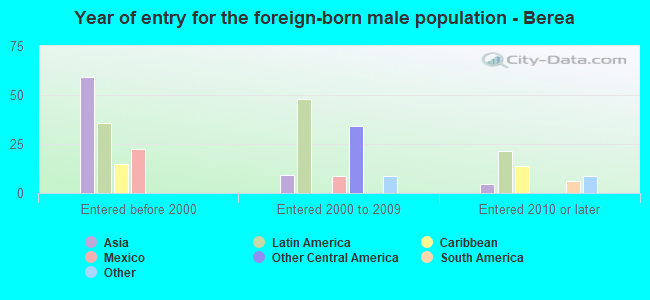
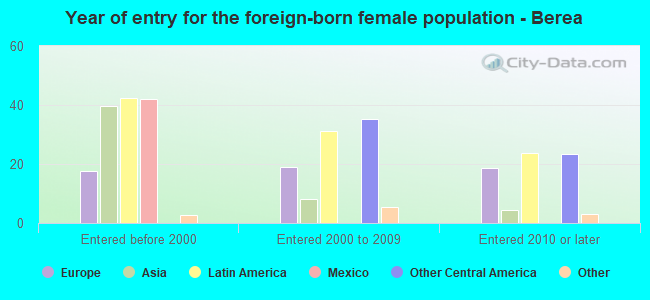
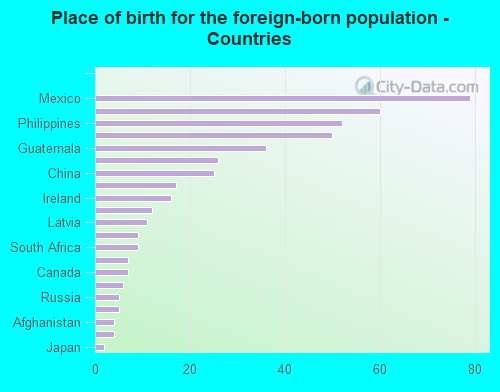
According to 2022 data, the most numerous races in Berea, KY are White alone (13,639 residents), Black alone (420 residents), and Hispanic (711 residents). 95.4% of Berea residents speak English at home. 2.9% of Berea, KY residents are foreign-born (1.4% born in Latin America, 0.9% born in Asia, 0.4% born in Europe), which is 39.6% less than the foreign-born rate of 4.0% across the entire state of Kentucky.
Race distribution in Berea
2000 2022
3,608,013 89.3% White alone 293,639 7.3% Black alone 59,939 1.5% Hispanic 37,750 0.9% Two or more races 29,368 0.7% Asian alone 7,939 0.2% American Indian alone 3,846 0.10% Other race alone 1,275 0.03% Native Hawaiian and Other
3,710,998 82.2% White alone 343,194 7.6% Black alone 187,483 4.2% Hispanic 187,394 4.2% Two or more races 62,240 1.4% Asian alone 13,529 0.3% Other race alone 4,302 0.10% American Indian alone 3,170 0.07% Native Hawaiian and Other
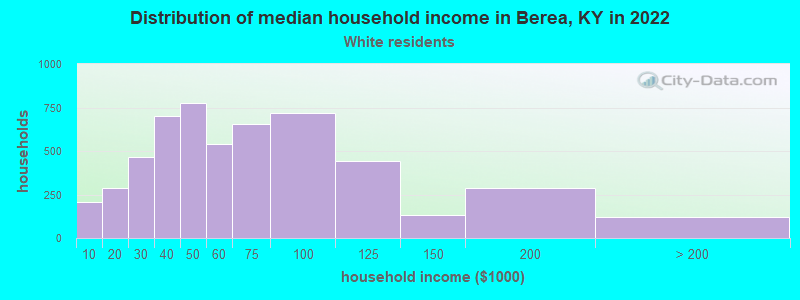
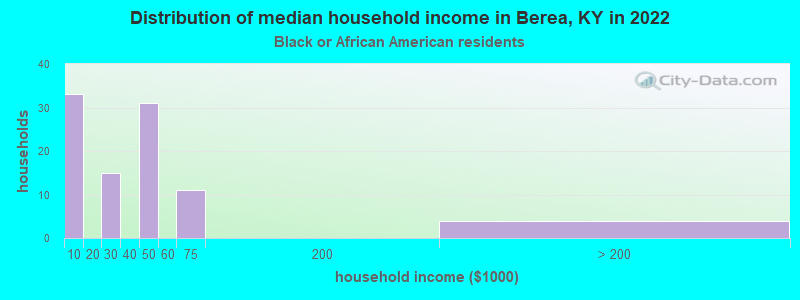
Income and house value in Berea Median household income in 2022 $55,137 White non-Hispanic householders$119,409 Some other race householders$75,061 Hispanic or Latino race householdersMedian 2022 house value $190,248 White Non-Hispanic householders$168,315 Black or African American householders$268,207 American Indian or Alaska Native householders $268,207 Asian householders$202,645 Two or more races householders$202,645 Hispanic or Latino householders
Median age by race in Berea
33.3 Median age for White residents32.7 34.1 29.8 Median age for Black or African American residents28.6 33.8 17.4 Median age for American Indian / Alaska Native residents18.7 21.3 34.4 Median age for Asian residents37.3 26.7 -755,186,721.2 Median age for Native Hawaiian / Pacific Islander residents-724,043,715.1 -853,801,168.7 30.6 Median age for Other race residents29.7 31.5 21.7 Median age for Two or more races residents22.8 23.0 33.4 Median age for White alone residents33.1 34.4 47.7 Median age for Hispanic or Latino residents47.0 38.4
Owner/renter occupied households by race in Berea
House owners and renters - White residents 2,877 54.2% Owner occupied2,429 45.8% Renter occupiedHouse owners and renters - Black or African American residents 31 40.0% Owner occupied47 60.0% Renter occupiedHouse owners and renters - American Indian / Alaska Native residents 43 100.0% Renter occupiedHouse owners and renters - Asian residents 16 76.2% Owner occupied5 23.8% Renter occupiedHouse owners and renters - Other race residents 71 100.0% Renter occupiedHouse owners and renters - Two or more races residents 212 71.8% Owner occupied83 28.2% Renter occupiedHouse owners and renters - White alone residents 2,880 54.7% Owner occupied2,389 45.3% Renter occupiedHouse owners and renters - Hispanic or Latino residents 66 31.7% Owner occupied143 68.3% Renter occupied
Language usage in Berea
English speakers - Total 95.4% of residents of Berea speak English at home.
3.4% of residents speak Spanish at home 171 34.1% Speak English very well330 65.9% Speak English less than very well1.4% of residents speak other language at home 197 92.9% Speak English very well15 7.1% Speak English less than very well
English speakers - Born in the United States 97.6% of residents of Berea speak English at home.
2.2% of residents speak Spanish at home 33 37.9% Speak English very well54 62.1% Speak English less than very well0.6% of residents speak other language at home 22 100.0% Speak English very well
English speakers - Native, born elsewhere 40.5% of residents of Berea speak English at home.
33.8% of residents speak Spanish at home 50 100.0% Speak English less than very well36.5% of residents speak other language at home 54 100.0% Speak English very well
English speakers - Foreign-born 10.2% of residents of Berea speak English at home.
78.8% of residents speak Spanish at home 145 39.0% Speak English very well227 61.0% Speak English less than very well32.0% of residents speak other language at home 136 90.1% Speak English very well15 9.9% Speak English less than very well
White (Caucasian) - Speak only English Native:
98.5% (13,018)Foreign-born:
25.9% (40)
White (Caucasian) - Speak another language Native:
1.2% (162)Foreign-born:
89.2% (136)
Black or African American - Speak only English Native:
100.0% (362)Foreign-born:
30.2% (11)
American Indian / Alaska Native - Speak only English Native:
43.2% (63)Foreign-born:
34.5% (31)
American Indian / Alaska Native - Speak another language Native:
70.7% (103)Foreign-born:
66.5% (60)
Asian - Speak another language Native:
8.2% (2)Foreign-born:
100.0% (33)
Other race - Speak only English Native:
72.4% (79)Foreign-born:
4.6% (6)
Other race - Speak another language Native:
30.8% (34)Foreign-born:
94.6% (118)
Two or more races - Speak another language Native:
0.3% (2)Foreign-born:
100.0% (77)
White alone - Speak only English Native:
99.2% (12,942)Foreign-born:
22.2% (19)
White alone - Speak another language Native:
0.8% (98)Foreign-born:
81.5% (70)
Hispanic or Latino - Speak only English Native:
68.6% (258)Foreign-born:
6.1% (23)
Hispanic or Latino - Speak another language Native:
66.0% (248)Foreign-born:
91.4% (339)
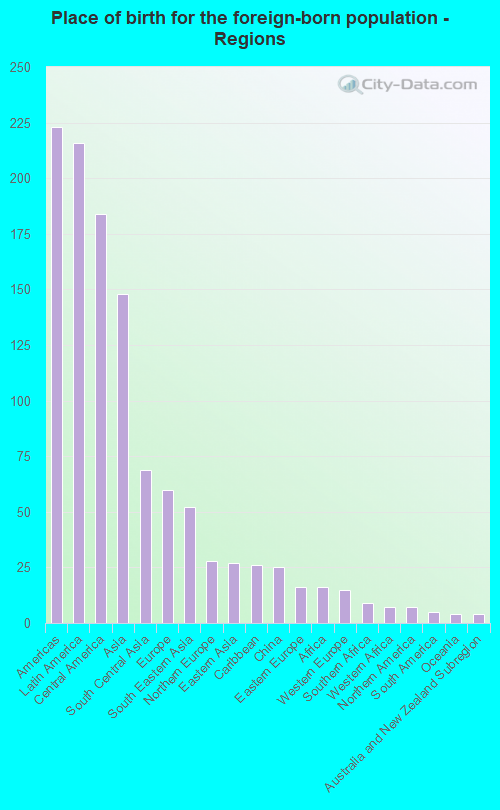
Foreign-born residents in Berea 452 residents are foreign born (1.4% Latin America , 0.9% Asia , 0.4% Europe ).
This city:
2.9%Kentucky:
4.1%
Marital status for residents in Berea Marital status - White (Caucasian) population 15 years and over
Males 33.4% Never married47.1% Now married0.5% Separated1.7% Widowed17.3% DivorcedFemales 32.3% Never married41.0% Now married1.2% Separated6.5% Widowed19.0% DivorcedWomen who gave birth in the past 12 months Now married:
90.2% (236)Unmarried:
9.8% (26)
Women who did not give birth in the past 12 months Now married:
31.4% (1,166)Unmarried:
68.6% (2,548)
Marital status - Black or African American population 15 years and over
Males 66.7% Never married33.3% Now married0.0% Separated0.0% Widowed0.0% DivorcedFemales 62.5% Never married17.7% Now married0.0% Separated3.6% Widowed16.1% DivorcedWomen who gave birth in the past 12 months Now married:
0.0% (0)Unmarried:
100.0% (19)
Women who did not give birth in the past 12 months Now married:
29.3% (44)Unmarried:
70.7% (107)
Marital status - American Indian / Alaska Native population 15 years and over
Males 72.7% Never married0.0% Now married0.0% Separated0.0% Widowed27.3% DivorcedFemales 71.1% Never married13.3% Now married0.0% Separated0.0% Widowed15.6% DivorcedWomen who did not give birth in the past 12 months Now married:
15.8% (14)Unmarried:
84.2% (75)
Marital status - Asian population 15 years and over
Males 30.0% Never married70.0% Now married0.0% Separated0.0% Widowed0.0% DivorcedFemales 45.2% Never married26.2% Now married28.6% Separated0.0% Widowed0.0% DivorcedWomen who did not give birth in the past 12 months Now married:
36.7% (10)Unmarried:
63.3% (17)
Marital status - Other race population 15 years and over
Males 12.2% Never married87.8% Now married0.0% Separated0.0% Widowed0.0% DivorcedFemales 19.6% Never married80.4% Now married0.0% Separated0.0% Widowed0.0% DivorcedWomen who gave birth in the past 12 months Now married:
100.0% (14)Unmarried:
0.0% (0)
Women who did not give birth in the past 12 months Now married:
60.8% (41)Unmarried:
39.2% (26)
Marital status - Two or more races population 15 years and over
Males 34.3% Never married46.6% Now married0.0% Separated0.0% Widowed19.1% DivorcedFemales 50.3% Never married27.3% Now married0.0% Separated0.0% Widowed22.4% DivorcedWomen who gave birth in the past 12 months Now married:
0.0% (0)Unmarried:
100.0% (11)
Women who did not give birth in the past 12 months Now married:
35.9% (60)Unmarried:
64.1% (108)
Marital status - White alone, not Hispanic / Latino population 15 years and over
Males 33.7% Never married46.3% Now married0.5% Separated1.7% Widowed17.7% DivorcedFemales 31.9% Never married41.2% Now married1.2% Separated6.5% Widowed19.1% DivorcedWomen who gave birth in the past 12 months Now married:
90.2% (238)Unmarried:
9.8% (26)
Women who did not give birth in the past 12 months Now married:
31.8% (1,175)Unmarried:
68.2% (2,526)
Marital status - Hispanic or Latino population 15 years and over
Males 25.7% Never married59.7% Now married0.0% Separated0.0% Widowed14.7% DivorcedFemales 40.4% Never married39.2% Now married5.0% Separated0.0% Widowed15.4% DivorcedWomen who gave birth in the past 12 months Now married:
100.0% (12)Unmarried:
0.0% (0)
Women who did not give birth in the past 12 months Now married:
24.2% (34)Unmarried:
75.8% (105)
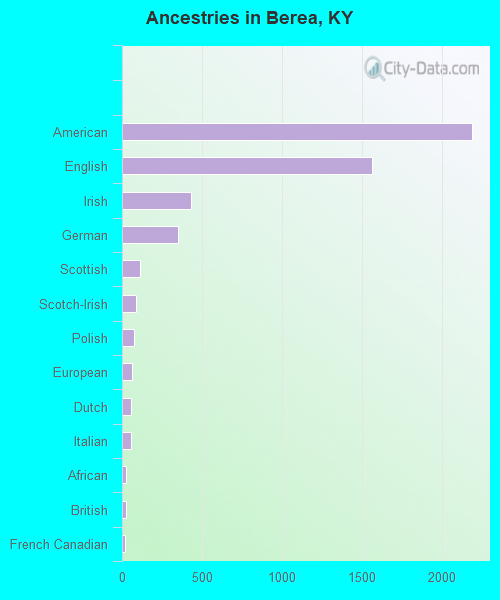
Ancestries in Berea
2,186 33.1% American1,563 23.7% English433 6.6% Irish353 5.3% German113 1.7% Scottish90 1.4% Scotch-Irish72 1.1% Polish61 0.9% European59 0.9% Dutch58 0.9% Italian28 0.4% African22 0.3% British20 0.3% French Canadian16 0.2% Belgian12 0.2% Russian12 0.2% Swedish6 0.09% Scandinavian4 0.06% Lebanese4 0.06% Greek4 0.06% Nigerian3 0.05% Celtic3 0.05% Eastern European2 0.03% Danish1 0.02% Iranian
Children Nativity (place of birth) in Berea
Children under 6 years - Living with two parents Both parents native 725 100.0% NativeChildren under 6 years - Living with one parent Native parent 338 100.0% NativeForeign-born parent 11 100.0% NativeChildren 6 to 17 years - Living with two parents Both parents native 1,010 96.9% Native32 3.1% Foreign-bornChildren 6 to 17 years - Living with one parent Native parent 844 100.0% NativeForeign-born parent 84 49.5% Native85 50.5% Foreign-born
Grandparents responsible for own grandchildren in Berea
Grandparents (30 to 59 years) White / Caucasian 92 80.7% Responsible for grandchildren22 19.3% Not responsible for grandchildrenWhite alone, not Hispanic / Latino 92 80.7% Responsible for grandchildren22 19.3% Not responsible for grandchildrenGrandparents (60 years and over) White / Caucasian 61 59.5% Responsible for grandchildren42 40.5% Not responsible for grandchildrenWhite alone, not Hispanic / Latino 61 59.5% Responsible for grandchildren42 40.5% Not responsible for grandchildren