Races in Benson, Vermont (VT) Detailed Stats
Ancestries, Foreign-born residents, place of birth

Data:
Latest news about races in Benson, VT collected exclusively by city-data.com from local newspapers, TV, and radio stations
1.4% of Benson, VT residents are foreign-born , which is 177.1% less than the foreign-born rate of 4.0% across the entire state of Vermont.
Race distribution in Benson

- 1,00196.3%White alone
- 161.5%Two or more races
- 90.9%Hispanic
- 70.7%Black alone
- 30.3%Asian alone
- 30.3%American Indian alone
2000
2022
-
- 585,43196.2%White alone
- 6,8091.1%Two or more races
- 5,5040.9%Hispanic
- 5,1600.8%Asian alone
- 2,9210.5%Black alone
- 2,3250.4%American Indian alone
- 5570.09%Other race alone
- 1200.02%Native Hawaiian and Other
Pacific Islander alone
-
- 583,54690.2%White alone
- 27,3404.2%Two or more races
- 14,7702.3%Hispanic
- 11,5121.8%Asian alone
- 6,2641.0%Black alone
- 2,5210.4%Other race alone
- 1,0520.2%American Indian alone
- 590.01%Native Hawaiian and Other
Pacific Islander alone
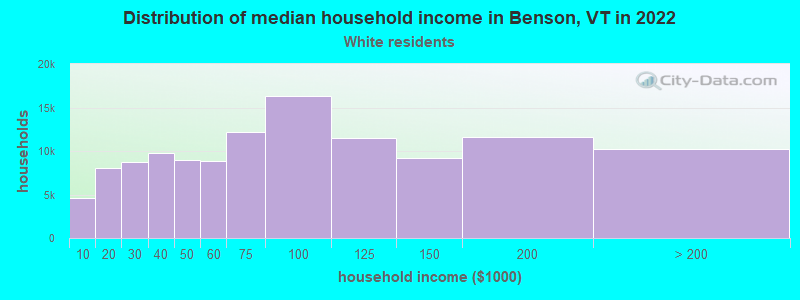
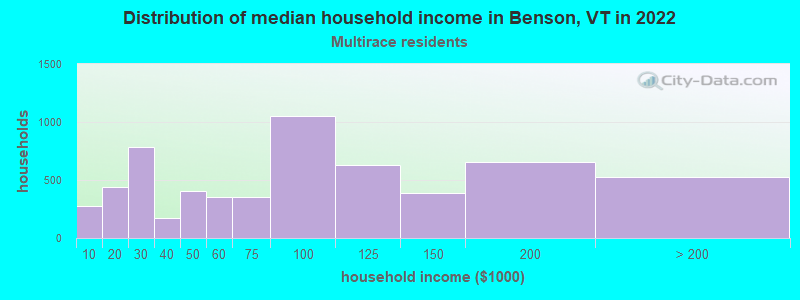
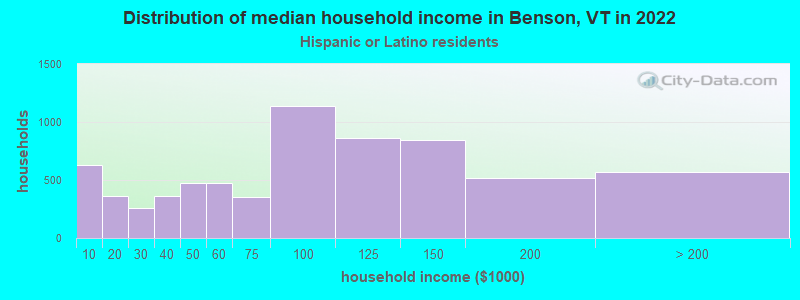
Income and house value in Benson
- Median household income in 2022
- $68,414White non-Hispanic householders
- $29,003Two or more races householders
- $104,048Hispanic or Latino race householders
- Median 2022 house value
- $197,654White Non-Hispanic householders
- $199,059Two or more races householders
Foreign-born residents in Benson
15 residents are foreign born
| This city: | 1.4% |
| Vermont: | 3.8% |
Ancestries in Benson

- 17214.7%Irish
- 16314.0%French
- 14212.2%English
- 13411.5%Other
- 12710.9%United States
- 927.9%German
- 776.6%Italian
- 685.8%French Canadian
- 413.5%Welsh
- 373.2%Polish
- 171.5%Scottish
- 171.5%Swedish
- 161.4%Hungarian
- 110.9%Dutch
- 90.8%Czech
- 80.7%Greek
- 80.7%Scotch-Irish
- 70.6%Arab
- 50.4%Portuguese
- 40.3%Danish
- 40.3%Norwegian
- 40.3%West Indian
- 30.3%Russian
- 20.2%Lithuanian