Races in Belvidere, Vermont (VT) Detailed Stats
Ancestries, Foreign-born residents, place of birth
0.7% of Belvidere, VT residents are foreign-born , which is 488.0% less than the foreign-born rate of 4.0% across the entire state of Vermont.
Race distribution in Belvidere

- 29299.3%White alone
- 10.3%Two or more races
- 10.3%Hispanic

2000
2022
-
- 585,43196.2%White alone
- 6,8091.1%Two or more races
- 5,5040.9%Hispanic
- 5,1600.8%Asian alone
- 2,9210.5%Black alone
- 2,3250.4%American Indian alone
- 5570.09%Other race alone
- 1200.02%Native Hawaiian and Other
Pacific Islander alone

-
- 583,54690.2%White alone
- 27,3404.2%Two or more races
- 14,7702.3%Hispanic
- 11,5121.8%Asian alone
- 6,2641.0%Black alone
- 2,5210.4%Other race alone
- 1,0520.2%American Indian alone
- 590.01%Native Hawaiian and Other
Pacific Islander alone

Income and house value in Belvidere
- Median household income in 2022
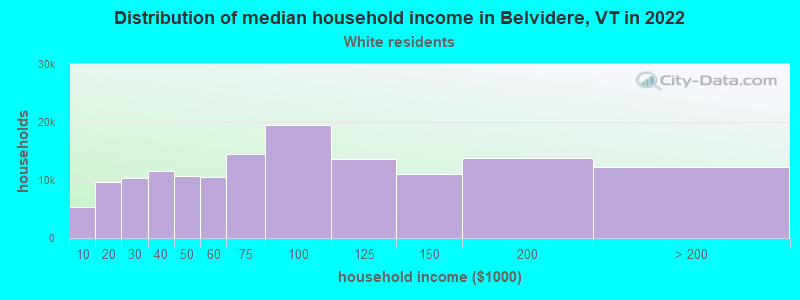
- $87,254White non-Hispanic householders
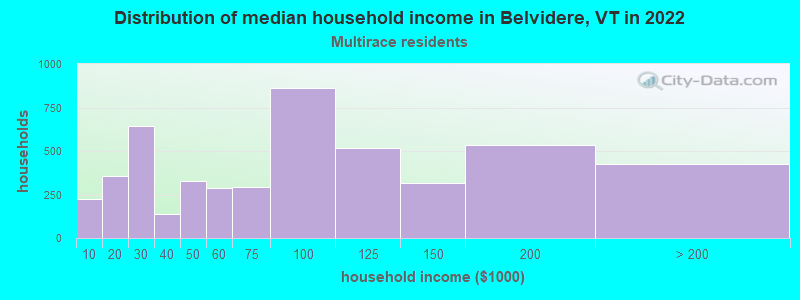
- $23,730Two or more races householders
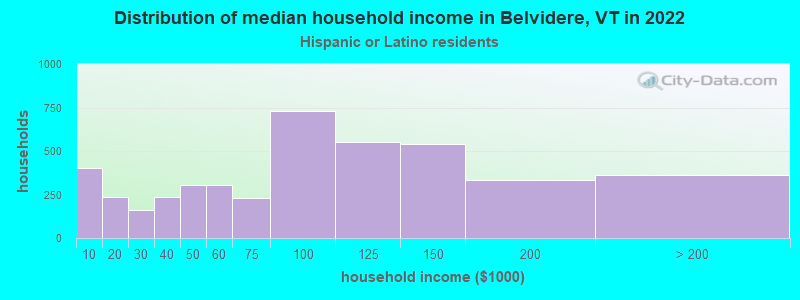
- $66,697Hispanic or Latino race householders
- Median 2022 house value
- $203,012White Non-Hispanic householders
Household income for White non-Hispanic householders
Household income for Two or more races householders
Household income for Hispanic or Latino race householders
Foreign-born residents in Belvidere
2 residents are foreign born
| This city: | 0.7% |
| Vermont: | 3.8% |
Ancestries in Belvidere

- 4016.0%Irish
- 3614.4%United States
- 3514.0%Other
- 3112.4%English
- 2610.4%French
- 239.2%French Canadian
- 166.4%German
- 104.0%Scottish
- 72.8%Russian
- 72.8%Welsh
- 62.4%Italian
- 52.0%Ukrainian
- 41.6%Scotch-Irish
- 31.2%Polish
- 10.4%Swedish

Zip codes: 05442.