Races in Belmont, Massachusetts (MA) Detailed Stats
Data:
Races - White alone (%)
Races - White alone (% change since 2000)
Races - Black alone (%)
Races - Black alone (% change since 2000)
Races - American Indian alone (%)
Races - American Indian alone (% change since 2000)
Races - Asian alone (%)
Races - Asian alone (% change since 2000)
Races - Hispanic (%)
Races - Hispanic (% change since 2000)
Races - Native Hawaiian and Other Pacific Islander alone (%)
Races - Native Hawaiian and Other Pacific Islander alone (% change since 2000)
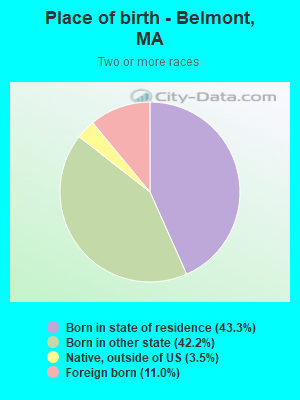
Races - Two or more races(%)
Races - Two or more races(% change since 2000)
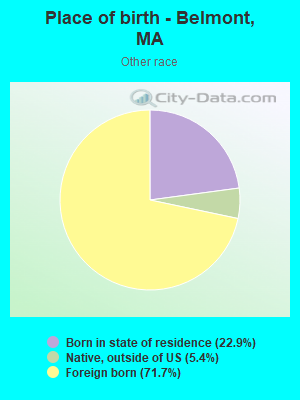
Races - Other race alone (%)
Races - Other race alone (% change since 2000)
Racial diversity
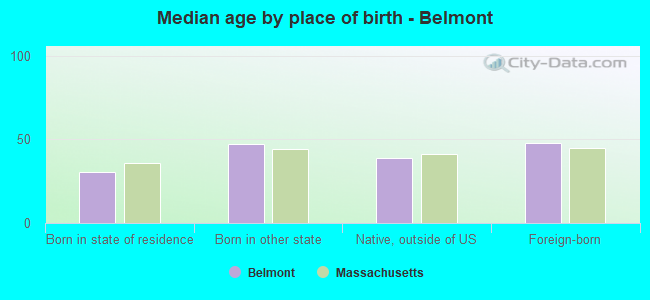
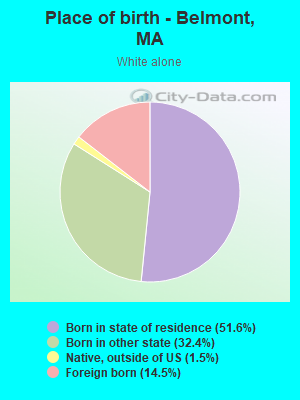
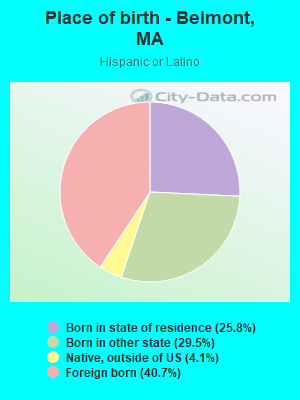
Place of birth - Born in state of residence (%)
Place of birth - Born in state of residence (%) - White
Place of birth - Born in state of residence (%) - Black or African American
Place of birth - Born in state of residence (%) - Asian
Place of birth - Born in state of residence (%) - Hispanic or Latino
Place of birth - Born in state of residence (%) - American Indian and Alaska Native
Place of birth - Born in state of residence (%) - Multirace
Place of birth - Born in state of residence (%) - Other Race
Place of birth - Born in other state (%)
Place of birth - Born in other state (%) - White
Place of birth - Born in other state (%) - Black or African American
Place of birth - Born in other state (%) - Asian
Place of birth - Born in other state (%) - Hispanic or Latino
Place of birth - Born in other state (%) - American Indian and Alaska Native
Place of birth - Born in other state (%) - Multirace
Place of birth - Born in other state (%) - Other Race
Place of birth - Native, outside of US (%)
Place of birth - Native, outside of US (%) - White
Place of birth - Native, outside of US (%) - Black or African American
Place of birth - Native, outside of US (%) - Asian
Place of birth - Native, outside of US (%) - Hispanic or Latino
Place of birth - Native, outside of US (%) - American Indian and Alaska Native
Place of birth - Native, outside of US (%) - Multirace
Place of birth - Native, outside of US (%) - Other Race
Place of birth - Foreign born (%)
Place of birth - Foreign born (%) - White
Place of birth - Foreign born (%) - Black or African American
Place of birth - Foreign born (%) - Asian
Place of birth - Foreign born (%) - Hispanic or Latino
Place of birth - Foreign born (%) - American Indian and Alaska Native
Place of birth - Foreign born (%) - Multirace
Place of birth - Foreign born (%) - Other Race
Residents speaking English at home (%)
Residents speaking English at home - Born in the United States (%)
Residents speaking English at home - Native, born elsewhere (%)
Residents speaking English at home - Foreign born (%)
Residents speaking Spanish at home (%)
Residents speaking Spanish at home - Born in the United States (%)
Residents speaking Spanish at home - Native, born elsewhere (%)
Residents speaking Spanish at home - Foreign born (%)
Residents speaking other language at home (%)
Residents speaking other language at home - Born in the United States (%)
Residents speaking other language at home - Native, born elsewhere (%)
Residents speaking other language at home - Foreign born (%)
Marital status - Never married (%)
Marital status - Now married (%)
Marital status - Separated (%)
Marital status - Widowed (%)
Marital status - Divorced (%)
Ancestries Reported - Arab (%)
Ancestries Reported - Czech (%)
Ancestries Reported - Danish (%)
Ancestries Reported - Dutch (%)
Ancestries Reported - English (%)
Ancestries Reported - French (%)
Ancestries Reported - French Canadian (%)
Ancestries Reported - German (%)
Ancestries Reported - Greek (%)
Ancestries Reported - Hungarian (%)
Ancestries Reported - Irish (%)
Ancestries Reported - Italian (%)
Ancestries Reported - Lithuanian (%)
Ancestries Reported - Norwegian (%)
Ancestries Reported - Polish (%)
Ancestries Reported - Portuguese (%)
Ancestries Reported - Russian (%)
Ancestries Reported - Scotch-Irish (%)
Ancestries Reported - Scottish (%)
Ancestries Reported - Slovak (%)
Ancestries Reported - Subsaharan African (%)
Ancestries Reported - Swedish (%)
Ancestries Reported - Swiss (%)
Ancestries Reported - Ukrainian (%)
Ancestries Reported - United States (%)
Ancestries Reported - Welsh (%)
Ancestries Reported - West Indian (%)
Ancestries Reported - Other (%)
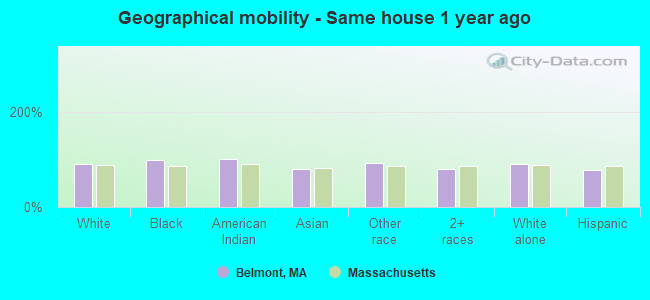
Geographical mobility - Same house 1 year ago (%)
Geographical mobility - Same house 1 year ago (%) - White
Geographical mobility - Same house 1 year ago (%) - Black or African American
Geographical mobility - Same house 1 year ago (%) - Asian
Geographical mobility - Same house 1 year ago (%) - Hispanic or Latino
Geographical mobility - Same house 1 year ago (%) - American Indian and Alaska Native
Geographical mobility - Same house 1 year ago (%) - Multirace
Geographical mobility - Same house 1 year ago (%) - Other Race
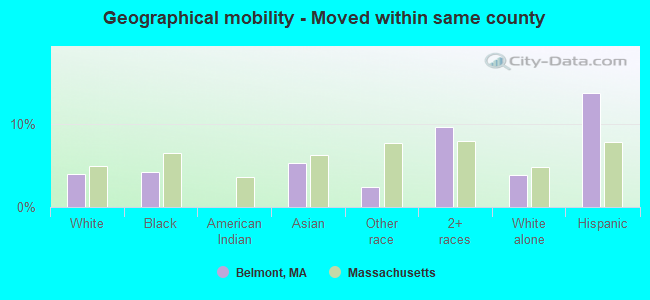
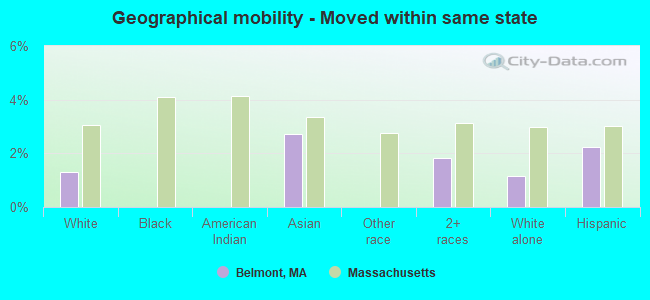
Geographical mobility - Moved within same county (%)
Geographical mobility - Moved within same county (%) - White
Geographical mobility - Moved within same county (%) - Black or African American
Geographical mobility - Moved within same county (%) - Asian
Geographical mobility - Moved within same county (%) - Hispanic or Latino
Geographical mobility - Moved within same county (%) - American Indian and Alaska Native
Geographical mobility - Moved within same county (%) - Multirace
Geographical mobility - Moved within same county (%) - Other Race
Geographical mobility - Moved from different county within same state (%)
Geographical mobility - Moved from different county within same state (%) - White
Geographical mobility - Moved from different county within same state (%) - Black or African American
Geographical mobility - Moved from different county within same state (%) - Asian
Geographical mobility - Moved from different county within same state (%) - Hispanic or Latino
Geographical mobility - Moved from different county within same state (%) - American Indian and Alaska Native
Geographical mobility - Moved from different county within same state (%) - Multirace
Geographical mobility - Moved from different county within same state (%) - Other Race
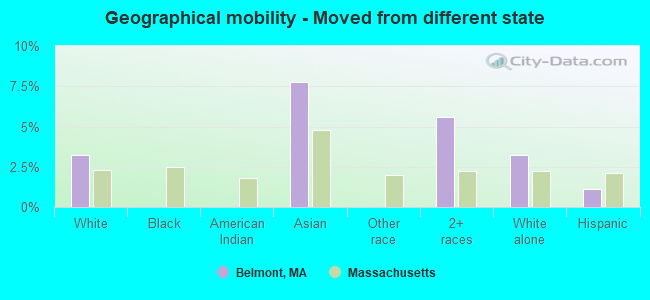
Geographical mobility - Moved from different state (%)
Geographical mobility - Moved from different state (%) - White
Geographical mobility - Moved from different state (%) - Black or African American
Geographical mobility - Moved from different state (%) - Asian
Geographical mobility - Moved from different state (%) - Hispanic or Latino
Geographical mobility - Moved from different state (%) - American Indian and Alaska Native
Geographical mobility - Moved from different state (%) - Multirace
Geographical mobility - Moved from different state (%) - Other Race
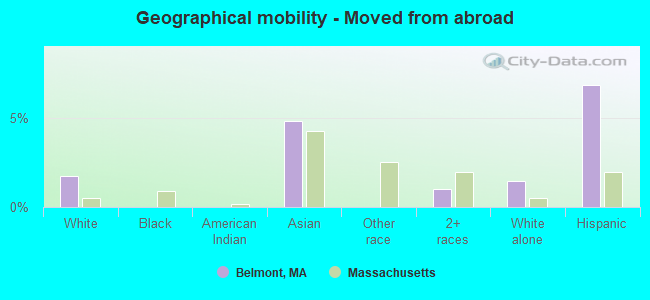
Geographical mobility - Moved from abroad (%)
Geographical mobility - Moved from abroad (%) - White
Geographical mobility - Moved from abroad (%) - Black or African American
Geographical mobility - Moved from abroad (%) - Asian
Geographical mobility - Moved from abroad (%) - Hispanic or Latino
Geographical mobility - Moved from abroad (%) - American Indian and Alaska Native
Geographical mobility - Moved from abroad (%) - Multirace
Geographical mobility - Moved from abroad (%) - Other Race
Place of birth for the foreign-born population - Ireland (%)
Place of birth for the foreign-born population - Denmark (%)
Place of birth for the foreign-born population - Norway (%)
Place of birth for the foreign-born population - Sweden (%)
Place of birth for the foreign-born population - United Kingdom (%)
Place of birth for the foreign-born population - England (%)
Place of birth for the foreign-born population - Scotland (%)
Place of birth for the foreign-born population - Other Northern Europe (%)
Place of birth for the foreign-born population - Austria (%)
Place of birth for the foreign-born population - Belgium (%)
Place of birth for the foreign-born population - France (%)
Place of birth for the foreign-born population - Germany (%)
Place of birth for the foreign-born population - Netherlands (%)
Place of birth for the foreign-born population - Switzerland (%)
Place of birth for the foreign-born population - Other Western Europe (%)
Place of birth for the foreign-born population - Greece (%)
Place of birth for the foreign-born population - Italy (%)
Place of birth for the foreign-born population - Portugal (%)
Place of birth for the foreign-born population - Spain (%)
Place of birth for the foreign-born population - Other Southern Europe (%)
Place of birth for the foreign-born population - Albania (%)
Place of birth for the foreign-born population - Belarus (%)
Place of birth for the foreign-born population - Bosnia and Herzegovina (%)
Place of birth for the foreign-born population - Bulgaria (%)
Place of birth for the foreign-born population - Croatia (%)
Place of birth for the foreign-born population - Czechoslovakia (%)
Place of birth for the foreign-born population - Hungary (%)
Place of birth for the foreign-born population - Latvia (%)
Place of birth for the foreign-born population - Lithuania (%)
Place of birth for the foreign-born population - North Macedonia (Macedonia) (%)
Place of birth for the foreign-born population - Moldova (%)
Place of birth for the foreign-born population - Poland (%)
Place of birth for the foreign-born population - Romania (%)
Place of birth for the foreign-born population - Russia (%)
Place of birth for the foreign-born population - Serbia (%)
Place of birth for the foreign-born population - Ukraine (%)
Place of birth for the foreign-born population - Other Eastern Europe (%)
Place of birth for the foreign-born population - China (%)
Place of birth for the foreign-born population - Hong Kong (%)
Place of birth for the foreign-born population - Taiwan (%)
Place of birth for the foreign-born population - Japan (%)
Place of birth for the foreign-born population - Korea (%)
Place of birth for the foreign-born population - Other Eastern Asia (%)
Place of birth for the foreign-born population - Afghanistan (%)
Place of birth for the foreign-born population - Bangladesh (%)
Place of birth for the foreign-born population - India (%)
Place of birth for the foreign-born population - Iran (%)
Place of birth for the foreign-born population - Kazakhstan (%)
Place of birth for the foreign-born population - Nepal (%)
Place of birth for the foreign-born population - Pakistan (%)
Place of birth for the foreign-born population - Sri Lanka (%)
Place of birth for the foreign-born population - Uzbekistan (%)
Place of birth for the foreign-born population - Other South Central Asia (%)
Place of birth for the foreign-born population - Burma (%)
Place of birth for the foreign-born population - Cambodia (%)
Place of birth for the foreign-born population - Indonesia (%)
Place of birth for the foreign-born population - Laos (%)
Place of birth for the foreign-born population - Malaysia (%)
Place of birth for the foreign-born population - Philippines (%)
Place of birth for the foreign-born population - Singapore (%)
Place of birth for the foreign-born population - Thailand (%)
Place of birth for the foreign-born population - Vietnam (%)
Place of birth for the foreign-born population - Other South Eastern Asia (%)
Place of birth for the foreign-born population - Armenia (%)
Place of birth for the foreign-born population - Iraq (%)
Place of birth for the foreign-born population - Israel (%)
Place of birth for the foreign-born population - Jordan (%)
Place of birth for the foreign-born population - Kuwait (%)
Place of birth for the foreign-born population - Lebanon (%)
Place of birth for the foreign-born population - Saudi Arabia (%)
Place of birth for the foreign-born population - Syria (%)
Place of birth for the foreign-born population - Turkey (%)
Place of birth for the foreign-born population - Yemen (%)
Place of birth for the foreign-born population - Other Western Asia (%)
Place of birth for the foreign-born population - Eritrea (%)
Place of birth for the foreign-born population - Ethiopia (%)
Place of birth for the foreign-born population - Kenya (%)
Place of birth for the foreign-born population - Somalia (%)
Place of birth for the foreign-born population - Uganda (%)
Place of birth for the foreign-born population - Zimbabwe (%)
Place of birth for the foreign-born population - Other Eastern Africa (%)
Place of birth for the foreign-born population - Cameroon (%)
Place of birth for the foreign-born population - Congo (%)
Place of birth for the foreign-born population - Democratic Republic of Congo (Zaire) (%)
Place of birth for the foreign-born population - Other Middle Africa (%)
Place of birth for the foreign-born population - Egypt (%)
Place of birth for the foreign-born population - Morocco (%)
Place of birth for the foreign-born population - Sudan (%)
Place of birth for the foreign-born population - Other Northern Africa (%)
Place of birth for the foreign-born population - South Africa (%)
Place of birth for the foreign-born population - Other Southern Africa (%)
Place of birth for the foreign-born population - Cabo Verde (%)
Place of birth for the foreign-born population - Ghana (%)
Place of birth for the foreign-born population - Liberia (%)
Place of birth for the foreign-born population - Nigeria (%)
Place of birth for the foreign-born population - Senegal (%)
Place of birth for the foreign-born population - Sierra Leone (%)
Place of birth for the foreign-born population - Other Western Africa (%)
Place of birth for the foreign-born population - Australia (%)
Place of birth for the foreign-born population - New Zealand (%)
Place of birth for the foreign-born population - Fiji (%)
Place of birth for the foreign-born population - Micronesia (%)
Place of birth for the foreign-born population - Bahamas (%)
Place of birth for the foreign-born population - Barbados (%)
Place of birth for the foreign-born population - Cuba (%)
Place of birth for the foreign-born population - Dominica (%)
Place of birth for the foreign-born population - Dominican Republic (%)
Place of birth for the foreign-born population - Grenada (%)
Place of birth for the foreign-born population - Haiti (%)
Place of birth for the foreign-born population - Jamaica (%)
Place of birth for the foreign-born population - St. Vincent and the Grenadines (%)
Place of birth for the foreign-born population - Trinidad and Tobago (%)
Place of birth for the foreign-born population - West Indies (%)
Place of birth for the foreign-born population - Other Caribbean (%)
Place of birth for the foreign-born population - Belize (%)
Place of birth for the foreign-born population - Costa Rica (%)
Place of birth for the foreign-born population - El Salvador (%)
Place of birth for the foreign-born population - Guatemala (%)
Place of birth for the foreign-born population - Honduras (%)
Place of birth for the foreign-born population - Mexico (%)
Place of birth for the foreign-born population - Nicaragua (%)
Place of birth for the foreign-born population - Panama (%)
Place of birth for the foreign-born population - Other Central America (%)
Place of birth for the foreign-born population - Argentina (%)
Place of birth for the foreign-born population - Bolivia (%)
Place of birth for the foreign-born population - Brazil (%)
Place of birth for the foreign-born population - Chile (%)
Place of birth for the foreign-born population - Colombia (%)
Place of birth for the foreign-born population - Ecuador (%)
Place of birth for the foreign-born population - Guyana (%)
Place of birth for the foreign-born population - Peru (%)
Place of birth for the foreign-born population - Uruguay (%)
Place of birth for the foreign-born population - Venezuela (%)
Place of birth for the foreign-born population - Other South America (%)
Place of birth for the foreign-born population - Canada (%)
Place of birth for the foreign-born population - Other Northern America (%)
Place of birth for the foreign-born population - Other (%)
Latest news about races in Belmont, MA collected exclusively by city-data.com from local newspapers, TV, and radio stations
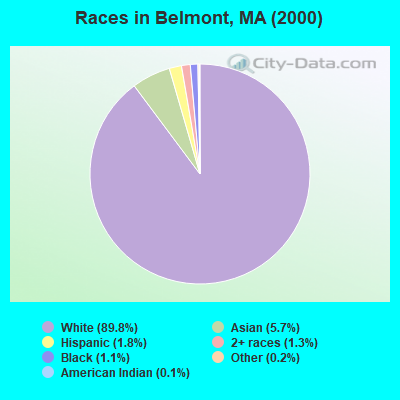
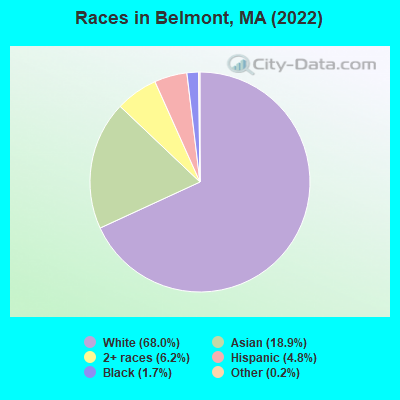
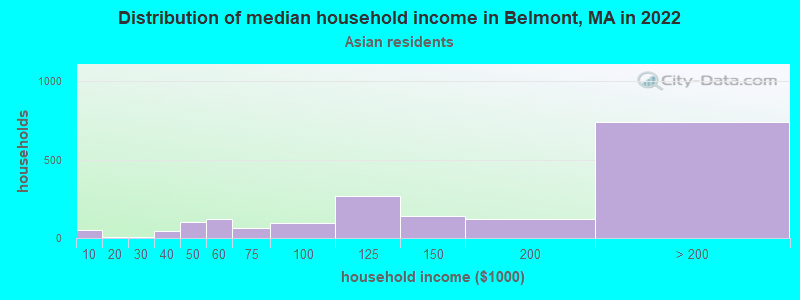
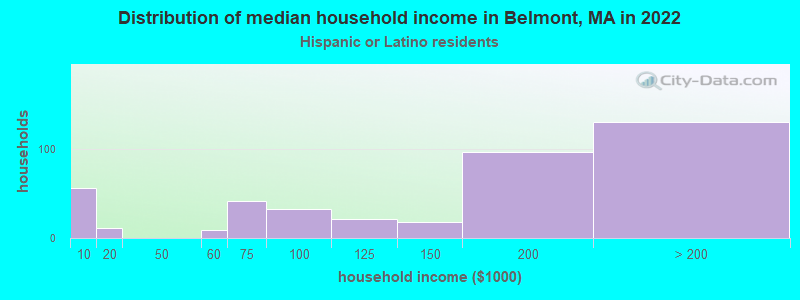
According to 2022 data, the most numerous races in Belmont, MA are White alone (18,283 residents), Hispanic (1,298 residents), and Asian alone (5,076 residents). 67.8% of Belmont residents speak English at home. 26.6% of Belmont, MA residents are foreign-born (14.7% born in Asia, 7.0% born in Europe), which is 32.3% greater than the foreign-born rate of 18.0% across the entire state of Massachusetts.
Race distribution in Belmont
2000 2022
5,198,359 81.9% White alone 428,729 6.8% Hispanic 318,329 5.0% Black alone 236,786 3.7% Asian alone 110,338 1.7% Two or more races 43,586 0.7% Other race alone 11,264 0.2% American Indian alone 1,706 0.03% Native Hawaiian and Other
4,676,627 67.0% White alone 911,038 13.0% Hispanic 501,463 7.2% Asian alone 459,740 6.6% Black alone 341,889 4.9% Two or more races 84,403 1.2% Other race alone 5,838 0.08% American Indian alone 976 0.01% Native Hawaiian and Other
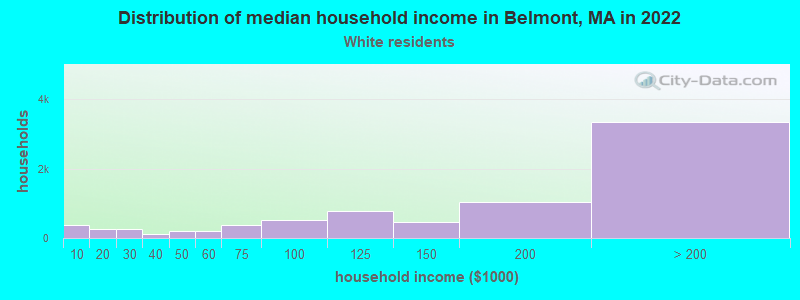
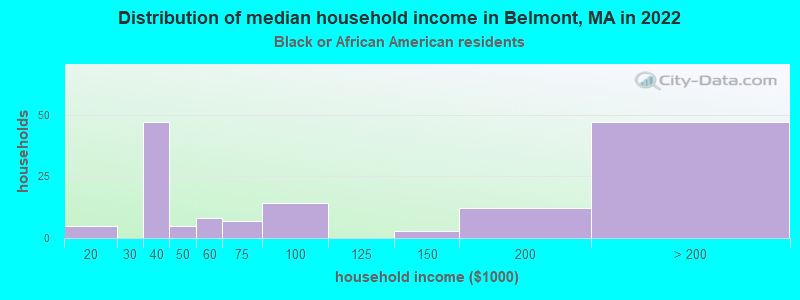
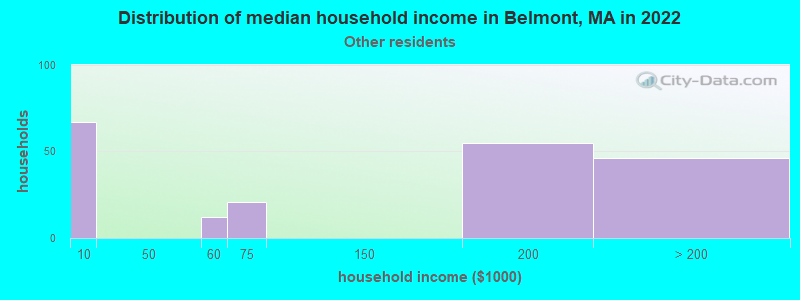
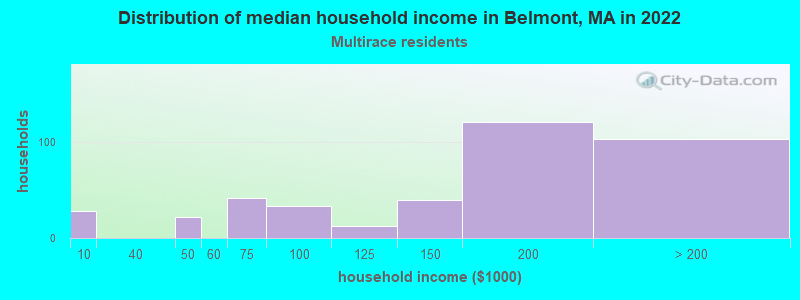
Income and house value in Belmont Median household income in 2022 $168,136 White non-Hispanic householders$147,457 Asian householders$141,847 Some other race householders$153,041 Two or more races householders$161,182 Hispanic or Latino race householdersMedian 2022 house value over $1,000,000 White Non-Hispanic householders$720,363 Black or African American householders$433,552 American Indian or Alaska Native householders over $1,000,000 Asian householdersover $1,000,000 Two or more races householdersover $1,000,000 Hispanic or Latino householders
Median age by race in Belmont
46.6 Median age for White residents46.8 46.5 31.9 Median age for Black or African American residents40.0 31.8 16.4 Median age for American Indian / Alaska Native residents-751,004,015.3 -1,078,313,251.9 40.9 Median age for Asian residents40.4 41.7 -514,227,641.8 Median age for Native Hawaiian / Pacific Islander residents-513,131,312.6 -508,717,948.2 44.0 Median age for Other race residents53.5 45.0 18.0 Median age for Two or more races residents17.6 18.7 46.5 Median age for White alone residents46.9 46.4 33.5 Median age for Hispanic or Latino residents30.9 34.6
Owner/renter occupied households by race in Belmont
House owners and renters - White residents 5,311 66.4% Owner occupied2,689 33.6% Renter occupiedHouse owners and renters - Black or African American residents 15 11.5% Owner occupied119 88.5% Renter occupiedHouse owners and renters - Asian residents 1,050 61.0% Owner occupied671 39.0% Renter occupiedHouse owners and renters - Other race residents 124 62.5% Owner occupied75 37.5% Renter occupiedHouse owners and renters - Two or more races residents 163 40.7% Owner occupied238 59.3% Renter occupiedHouse owners and renters - White alone residents 5,283 66.3% Owner occupied2,684 33.7% Renter occupiedHouse owners and renters - Hispanic or Latino residents 187 47.2% Owner occupied209 52.8% Renter occupied
Language usage in Belmont
English speakers - Total 67.8% of residents of Belmont speak English at home.
3.9% of residents speak Spanish at home 834 83.8% Speak English very well161 16.2% Speak English less than very well28.5% of residents speak other language at home 5,149 70.6% Speak English very well2,141 29.4% Speak English less than very well
English speakers - Born in the United States 90.1% of residents of Belmont speak English at home.
3.1% of residents speak Spanish at home 228 100.0% Speak English very well6.7% of residents speak other language at home 482 97.2% Speak English very well14 2.8% Speak English less than very well
English speakers - Native, born elsewhere 60.8% of residents of Belmont speak English at home.
7.7% of residents speak Spanish at home 17 53.1% Speak English very well15 46.9% Speak English less than very well34.1% of residents speak other language at home 55 38.7% Speak English very well87 61.3% Speak English less than very well
English speakers - Foreign-born 16.7% of residents of Belmont speak English at home.
7.4% of residents speak Spanish at home 377 72.2% Speak English very well145 27.8% Speak English less than very well75.6% of residents speak other language at home 3,532 65.8% Speak English very well1,832 34.2% Speak English less than very well
White (Caucasian) - Speak only English Native:
93.6% (13,972)Foreign-born:
23.3% (629)
White (Caucasian) - Speak another language Native:
6.2% (933)Foreign-born:
76.8% (2,074)
Black or African American - Speak only English Native:
56.9% (144)Foreign-born:
31.8% (60)
Black or African American - Speak another language Native:
48.1% (122)Foreign-born:
68.3% (129)
Asian - Speak only English Native:
42.5% (628)Foreign-born:
11.9% (394)
Asian - Speak another language Native:
57.5% (851)Foreign-born:
87.9% (2,909)
Other race - Speak only English Native:
81.9% (70)Foreign-born:
2.4% (6)
Other race - Speak another language Native:
28.9% (25)Foreign-born:
97.2% (262)
Two or more races - Speak only English Native:
75.2% (1,384)Foreign-born:
22.7% (57)
Two or more races - Speak another language Native:
23.9% (440)Foreign-born:
76.6% (191)
White alone - Speak only English Native:
93.3% (13,854)Foreign-born:
22.5% (592)
White alone - Speak another language Native:
6.7% (988)Foreign-born:
77.9% (2,049)
Hispanic or Latino - Speak only English Native:
58.8% (393)Foreign-born:
12.8% (69)
Hispanic or Latino - Speak another language Native:
42.5% (284)Foreign-born:
87.3% (470)
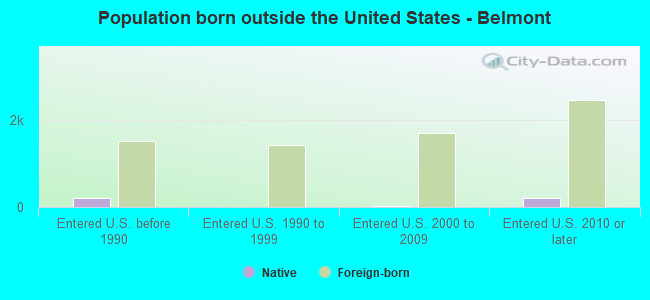
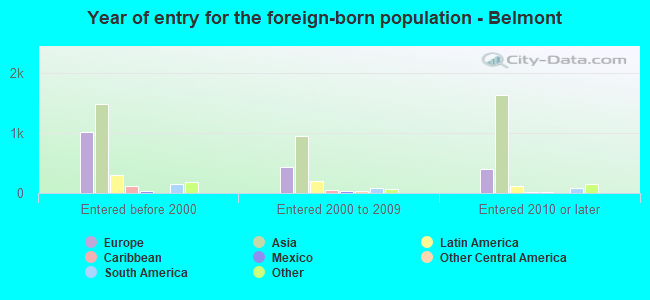
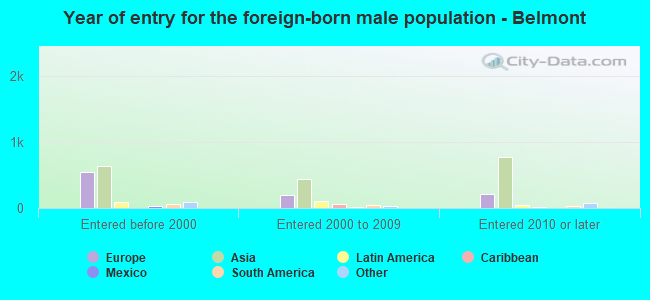
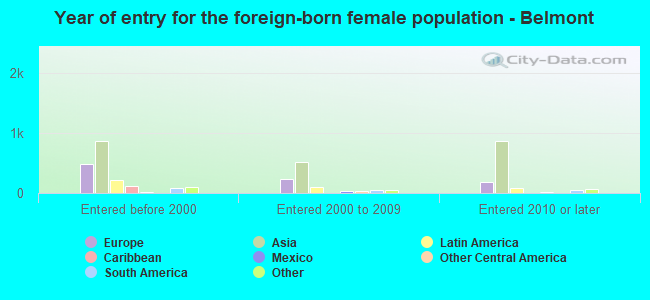
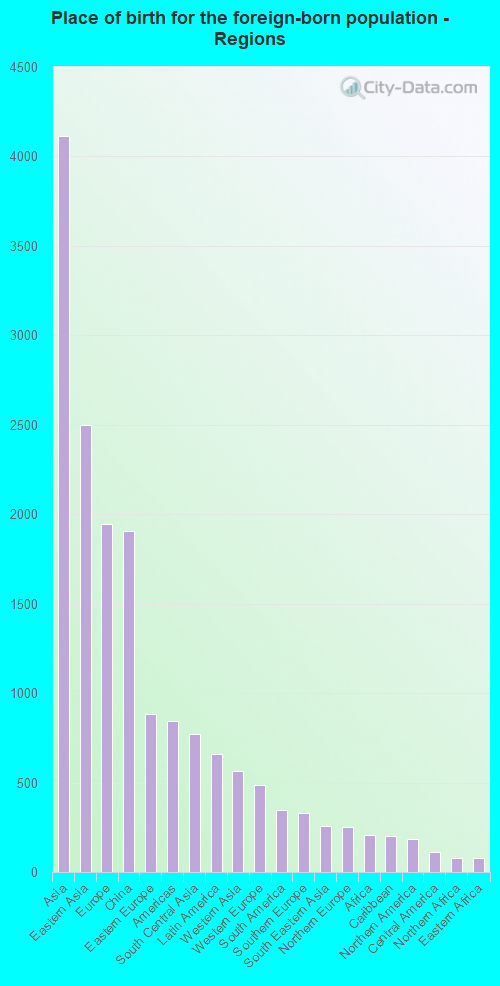
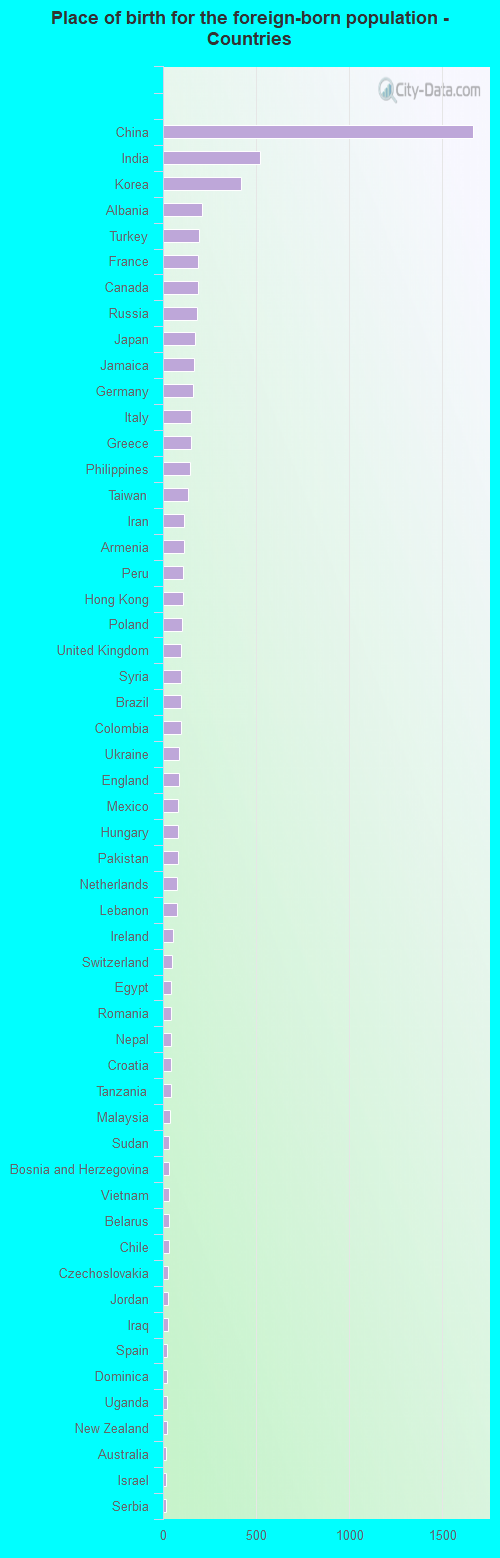
Foreign-born residents in Belmont 7,153 residents are foreign born (14.7% Asia , 7.0% Europe ).
This city:
26.6%Massachusetts:
17.6%
Marital status for residents in Belmont Marital status - White (Caucasian) population 15 years and over
Males 25.7% Never married67.1% Now married0.5% Separated2.4% Widowed4.4% DivorcedFemales 24.2% Never married57.8% Now married0.8% Separated9.1% Widowed8.1% DivorcedWomen who gave birth in the past 12 months Now married:
91.3% (144)Unmarried:
8.7% (14)
Women who did not give birth in the past 12 months Now married:
54.1% (1,960)Unmarried:
45.9% (1,663)
Marital status - Black or African American population 15 years and over
Males 24.1% Never married68.8% Now married0.0% Separated0.0% Widowed7.1% DivorcedFemales 73.9% Never married12.8% Now married6.9% Separated0.0% Widowed6.4% DivorcedWomen who did not give birth in the past 12 months Now married:
4.9% (7)Unmarried:
95.1% (132)
Marital status - Asian population 15 years and over
Males 15.7% Never married79.6% Now married0.0% Separated1.4% Widowed3.3% DivorcedFemales 18.8% Never married72.8% Now married0.3% Separated5.6% Widowed2.5% DivorcedWomen who gave birth in the past 12 months Now married:
100.0% (34)Unmarried:
0.0% (0)
Women who did not give birth in the past 12 months Now married:
70.1% (914)Unmarried:
29.9% (390)
Marital status - Other race population 15 years and over
Males 0.0% Never married89.6% Now married10.4% Separated0.0% Widowed0.0% DivorcedFemales 15.9% Never married63.1% Now married0.0% Separated21.0% Widowed0.0% DivorcedWomen who gave birth in the past 12 months Now married:
100.0% (19)Unmarried:
0.0% (0)
Women who did not give birth in the past 12 months Now married:
64.0% (64)Unmarried:
36.0% (36)
Marital status - Two or more races population 15 years and over
Males 64.1% Never married35.6% Now married0.2% Separated0.0% Widowed0.0% DivorcedFemales 52.6% Never married40.4% Now married2.3% Separated1.2% Widowed3.5% DivorcedWomen who gave birth in the past 12 months Now married:
100.0% (20)Unmarried:
0.0% (0)
Women who did not give birth in the past 12 months Now married:
40.5% (292)Unmarried:
59.5% (430)
Marital status - White alone, not Hispanic / Latino population 15 years and over
Males 25.2% Never married67.5% Now married0.6% Separated2.4% Widowed4.3% DivorcedFemales 24.0% Never married57.9% Now married0.8% Separated9.3% Widowed8.1% DivorcedWomen who gave birth in the past 12 months Now married:
91.0% (141)Unmarried:
9.0% (14)
Women who did not give birth in the past 12 months Now married:
54.4% (1,964)Unmarried:
45.6% (1,645)
Marital status - Hispanic or Latino population 15 years and over
Males 35.2% Never married58.8% Now married3.3% Separated0.0% Widowed2.7% DivorcedFemales 31.0% Never married56.7% Now married0.0% Separated7.6% Widowed4.7% DivorcedWomen who gave birth in the past 12 months Now married:
100.0% (22)Unmarried:
0.0% (0)
Women who did not give birth in the past 12 months Now married:
51.8% (180)Unmarried:
48.2% (167)
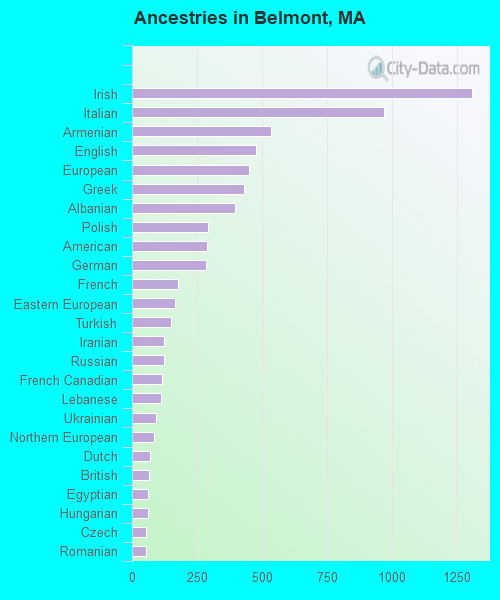
Ancestries in Belmont
1,309 10.1% Irish969 7.5% Italian537 4.1% Armenian478 3.7% English449 3.5% European432 3.3% Greek395 3.0% Albanian291 2.2% Polish288 2.2% American285 2.2% German179 1.4% French166 1.3% Eastern European151 1.2% Turkish125 1.0% Iranian123 0.9% Russian115 0.9% French Canadian111 0.9% Lebanese93 0.7% Ukrainian84 0.6% Northern European69 0.5% Dutch66 0.5% British62 0.5% Egyptian62 0.5% Hungarian55 0.4% Czech53 0.4% Romanian51 0.4% Brazilian44 0.3% Portuguese38 0.3% Israeli37 0.3% Jamaican35 0.3% Scottish33 0.3% Sudanese32 0.2% Swiss32 0.2% Lithuanian32 0.2% Scandinavian32 0.2% Swedish31 0.2% Croatian29 0.2% Austrian28 0.2% Norwegian26 0.2% Yugoslavian21 0.2% Scotch-Irish19 0.1% African18 0.1% Macedonian14 0.1% Danish14 0.1% Ethiopian14 0.1% Cypriot12 0.09% Serbian11 0.08% Estonian10 0.08% Canadian10 0.08% Arab9 0.07% Syrian9 0.07% Ghanaian3 0.02% Australian3 0.02% British West Indian2 0.02% Palestinian
Children Nativity (place of birth) in Belmont
Children under 6 years - Living with two parents Both parents native 962 100.0% NativeBoth parents foreign-born 334 82.7% Native70 17.3% Foreign-bornOne native, one foreign-born parent 171 100.0% NativeChildren under 6 years - Living with one parent Native parent 63 100.0% NativeForeign-born parent 41 71.1% Native17 28.9% Foreign-bornChildren 6 to 17 years - Living with two parents Both parents native 2,160 99.5% Native11 0.5% Foreign-bornBoth parents foreign-born 921 75.2% Native303 24.8% Foreign-bornOne native, one foreign-born parent 729 99.4% Native4 0.6% Foreign-bornChildren 6 to 17 years - Living with one parent Native parent 359 100.0% NativeForeign-born parent 161 55.4% Native130 44.6% Foreign-born
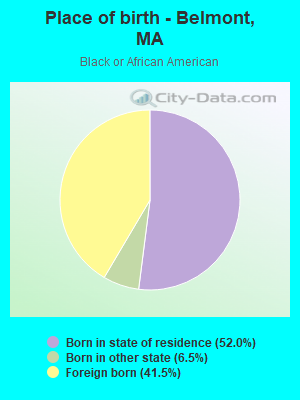
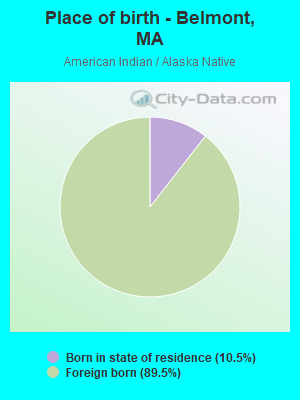
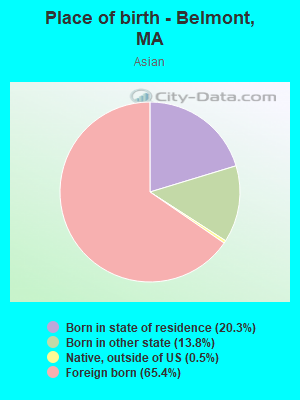
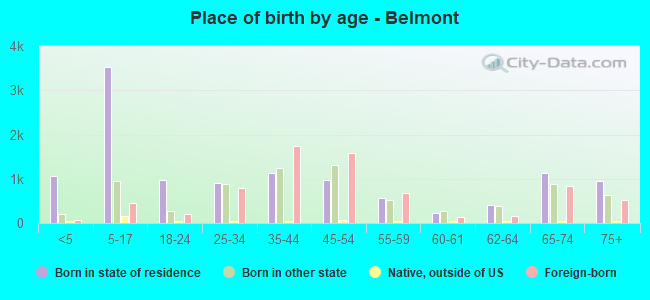
Place of birth for residents in Belmont
Grandparents responsible for own grandchildren in Belmont
Grandparents (30 to 59 years) Black or African American 11 100.0% Responsible for grandchildren
Grandparents (60 years and over)