Races in Bellmead, Texas (TX) Detailed Stats
Data:
Races - White alone (%)
Races - White alone (% change since 2000)
Races - Black alone (%)
Races - Black alone (% change since 2000)
Races - American Indian alone (%)
Races - American Indian alone (% change since 2000)
Races - Asian alone (%)
Races - Asian alone (% change since 2000)
Races - Hispanic (%)
Races - Hispanic (% change since 2000)
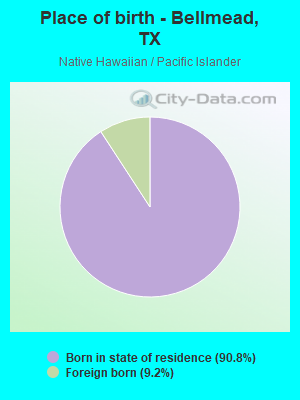
Races - Native Hawaiian and Other Pacific Islander alone (%)
Races - Native Hawaiian and Other Pacific Islander alone (% change since 2000)
Races - Two or more races(%)
Races - Two or more races(% change since 2000)
Races - Other race alone (%)
Races - Other race alone (% change since 2000)
Racial diversity
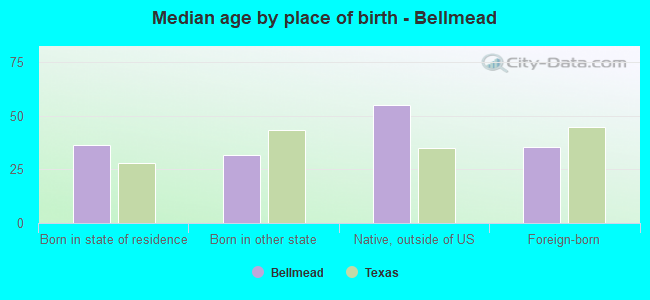
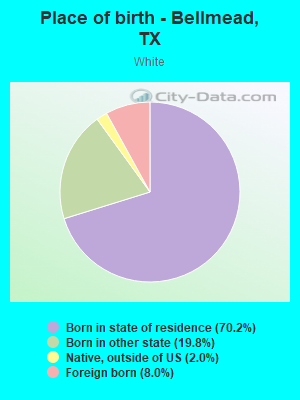
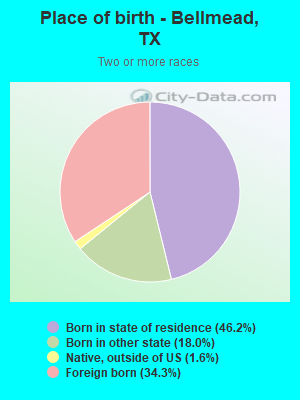
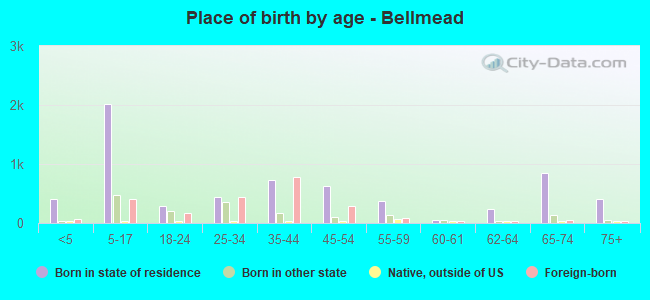
Place of birth - Born in state of residence (%)
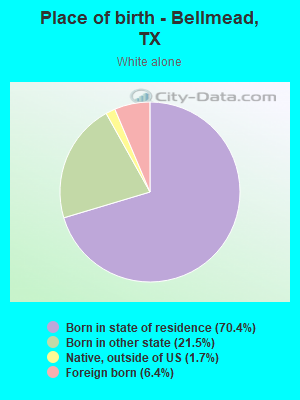
Place of birth - Born in state of residence (%) - White
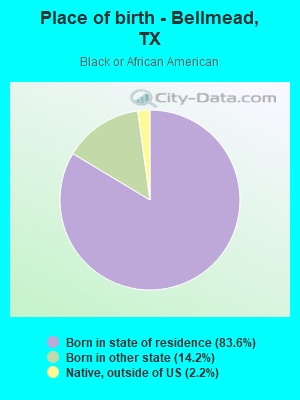
Place of birth - Born in state of residence (%) - Black or African American
Place of birth - Born in state of residence (%) - Asian
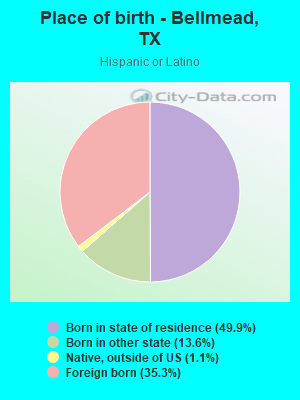
Place of birth - Born in state of residence (%) - Hispanic or Latino
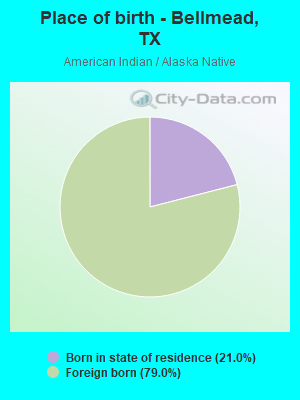
Place of birth - Born in state of residence (%) - American Indian and Alaska Native
Place of birth - Born in state of residence (%) - Multirace
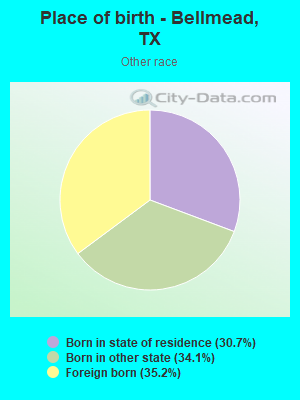
Place of birth - Born in state of residence (%) - Other Race
Place of birth - Born in other state (%)
Place of birth - Born in other state (%) - White
Place of birth - Born in other state (%) - Black or African American
Place of birth - Born in other state (%) - Asian
Place of birth - Born in other state (%) - Hispanic or Latino
Place of birth - Born in other state (%) - American Indian and Alaska Native
Place of birth - Born in other state (%) - Multirace
Place of birth - Born in other state (%) - Other Race
Place of birth - Native, outside of US (%)
Place of birth - Native, outside of US (%) - White
Place of birth - Native, outside of US (%) - Black or African American
Place of birth - Native, outside of US (%) - Asian
Place of birth - Native, outside of US (%) - Hispanic or Latino
Place of birth - Native, outside of US (%) - American Indian and Alaska Native
Place of birth - Native, outside of US (%) - Multirace
Place of birth - Native, outside of US (%) - Other Race
Place of birth - Foreign born (%)
Place of birth - Foreign born (%) - White
Place of birth - Foreign born (%) - Black or African American
Place of birth - Foreign born (%) - Asian
Place of birth - Foreign born (%) - Hispanic or Latino
Place of birth - Foreign born (%) - American Indian and Alaska Native
Place of birth - Foreign born (%) - Multirace
Place of birth - Foreign born (%) - Other Race
Residents speaking English at home (%)
Residents speaking English at home - Born in the United States (%)
Residents speaking English at home - Native, born elsewhere (%)
Residents speaking English at home - Foreign born (%)
Residents speaking Spanish at home (%)
Residents speaking Spanish at home - Born in the United States (%)
Residents speaking Spanish at home - Native, born elsewhere (%)
Residents speaking Spanish at home - Foreign born (%)
Residents speaking other language at home (%)
Residents speaking other language at home - Born in the United States (%)
Residents speaking other language at home - Native, born elsewhere (%)
Residents speaking other language at home - Foreign born (%)
Marital status - Never married (%)
Marital status - Now married (%)
Marital status - Separated (%)
Marital status - Widowed (%)
Marital status - Divorced (%)
Ancestries Reported - Arab (%)
Ancestries Reported - Czech (%)
Ancestries Reported - Danish (%)
Ancestries Reported - Dutch (%)
Ancestries Reported - English (%)
Ancestries Reported - French (%)
Ancestries Reported - French Canadian (%)
Ancestries Reported - German (%)
Ancestries Reported - Greek (%)
Ancestries Reported - Hungarian (%)
Ancestries Reported - Irish (%)
Ancestries Reported - Italian (%)
Ancestries Reported - Lithuanian (%)
Ancestries Reported - Norwegian (%)
Ancestries Reported - Polish (%)
Ancestries Reported - Portuguese (%)
Ancestries Reported - Russian (%)
Ancestries Reported - Scotch-Irish (%)
Ancestries Reported - Scottish (%)
Ancestries Reported - Slovak (%)
Ancestries Reported - Subsaharan African (%)
Ancestries Reported - Swedish (%)
Ancestries Reported - Swiss (%)
Ancestries Reported - Ukrainian (%)
Ancestries Reported - United States (%)
Ancestries Reported - Welsh (%)
Ancestries Reported - West Indian (%)
Ancestries Reported - Other (%)
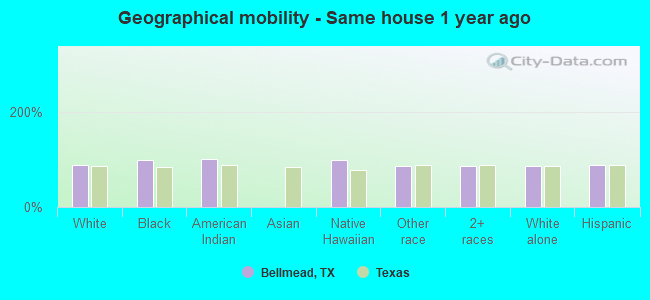
Geographical mobility - Same house 1 year ago (%)
Geographical mobility - Same house 1 year ago (%) - White
Geographical mobility - Same house 1 year ago (%) - Black or African American
Geographical mobility - Same house 1 year ago (%) - Asian
Geographical mobility - Same house 1 year ago (%) - Hispanic or Latino
Geographical mobility - Same house 1 year ago (%) - American Indian and Alaska Native
Geographical mobility - Same house 1 year ago (%) - Multirace
Geographical mobility - Same house 1 year ago (%) - Other Race
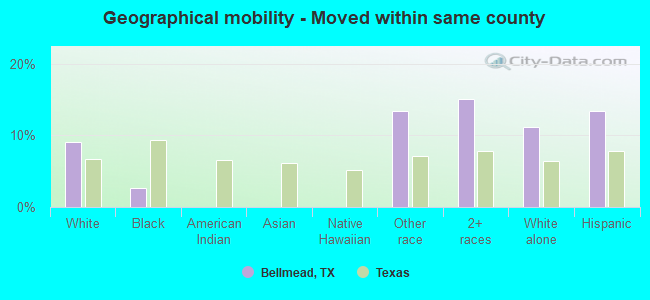
Geographical mobility - Moved within same county (%)
Geographical mobility - Moved within same county (%) - White
Geographical mobility - Moved within same county (%) - Black or African American
Geographical mobility - Moved within same county (%) - Asian
Geographical mobility - Moved within same county (%) - Hispanic or Latino
Geographical mobility - Moved within same county (%) - American Indian and Alaska Native
Geographical mobility - Moved within same county (%) - Multirace
Geographical mobility - Moved within same county (%) - Other Race
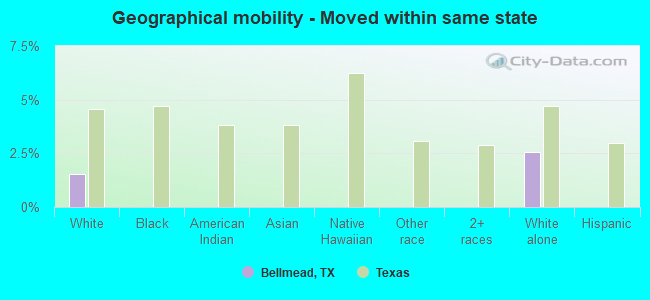
Geographical mobility - Moved from different county within same state (%)
Geographical mobility - Moved from different county within same state (%) - White
Geographical mobility - Moved from different county within same state (%) - Black or African American
Geographical mobility - Moved from different county within same state (%) - Asian
Geographical mobility - Moved from different county within same state (%) - Hispanic or Latino
Geographical mobility - Moved from different county within same state (%) - American Indian and Alaska Native
Geographical mobility - Moved from different county within same state (%) - Multirace
Geographical mobility - Moved from different county within same state (%) - Other Race
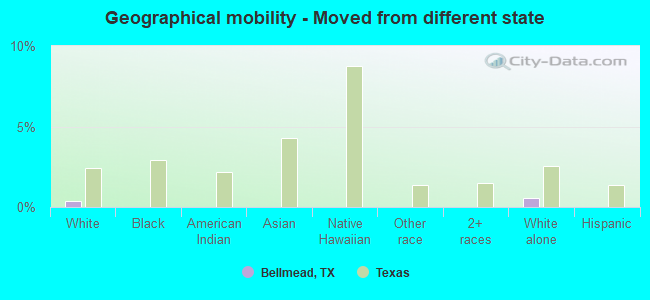
Geographical mobility - Moved from different state (%)
Geographical mobility - Moved from different state (%) - White
Geographical mobility - Moved from different state (%) - Black or African American
Geographical mobility - Moved from different state (%) - Asian
Geographical mobility - Moved from different state (%) - Hispanic or Latino
Geographical mobility - Moved from different state (%) - American Indian and Alaska Native
Geographical mobility - Moved from different state (%) - Multirace
Geographical mobility - Moved from different state (%) - Other Race
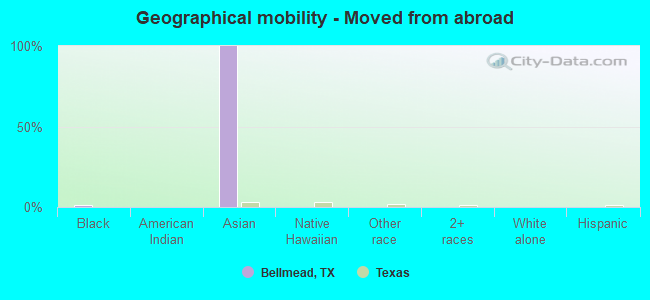
Geographical mobility - Moved from abroad (%)
Geographical mobility - Moved from abroad (%) - White
Geographical mobility - Moved from abroad (%) - Black or African American
Geographical mobility - Moved from abroad (%) - Asian
Geographical mobility - Moved from abroad (%) - Hispanic or Latino
Geographical mobility - Moved from abroad (%) - American Indian and Alaska Native
Geographical mobility - Moved from abroad (%) - Multirace
Geographical mobility - Moved from abroad (%) - Other Race
Place of birth for the foreign-born population - Ireland (%)
Place of birth for the foreign-born population - Denmark (%)
Place of birth for the foreign-born population - Norway (%)
Place of birth for the foreign-born population - Sweden (%)
Place of birth for the foreign-born population - United Kingdom (%)
Place of birth for the foreign-born population - England (%)
Place of birth for the foreign-born population - Scotland (%)
Place of birth for the foreign-born population - Other Northern Europe (%)
Place of birth for the foreign-born population - Austria (%)
Place of birth for the foreign-born population - Belgium (%)
Place of birth for the foreign-born population - France (%)
Place of birth for the foreign-born population - Germany (%)
Place of birth for the foreign-born population - Netherlands (%)
Place of birth for the foreign-born population - Switzerland (%)
Place of birth for the foreign-born population - Other Western Europe (%)
Place of birth for the foreign-born population - Greece (%)
Place of birth for the foreign-born population - Italy (%)
Place of birth for the foreign-born population - Portugal (%)
Place of birth for the foreign-born population - Spain (%)
Place of birth for the foreign-born population - Other Southern Europe (%)
Place of birth for the foreign-born population - Albania (%)
Place of birth for the foreign-born population - Belarus (%)
Place of birth for the foreign-born population - Bosnia and Herzegovina (%)
Place of birth for the foreign-born population - Bulgaria (%)
Place of birth for the foreign-born population - Croatia (%)
Place of birth for the foreign-born population - Czechoslovakia (%)
Place of birth for the foreign-born population - Hungary (%)
Place of birth for the foreign-born population - Latvia (%)
Place of birth for the foreign-born population - Lithuania (%)
Place of birth for the foreign-born population - North Macedonia (Macedonia) (%)
Place of birth for the foreign-born population - Moldova (%)
Place of birth for the foreign-born population - Poland (%)
Place of birth for the foreign-born population - Romania (%)
Place of birth for the foreign-born population - Russia (%)
Place of birth for the foreign-born population - Serbia (%)
Place of birth for the foreign-born population - Ukraine (%)
Place of birth for the foreign-born population - Other Eastern Europe (%)
Place of birth for the foreign-born population - China (%)
Place of birth for the foreign-born population - Hong Kong (%)
Place of birth for the foreign-born population - Taiwan (%)
Place of birth for the foreign-born population - Japan (%)
Place of birth for the foreign-born population - Korea (%)
Place of birth for the foreign-born population - Other Eastern Asia (%)
Place of birth for the foreign-born population - Afghanistan (%)
Place of birth for the foreign-born population - Bangladesh (%)
Place of birth for the foreign-born population - India (%)
Place of birth for the foreign-born population - Iran (%)
Place of birth for the foreign-born population - Kazakhstan (%)
Place of birth for the foreign-born population - Nepal (%)
Place of birth for the foreign-born population - Pakistan (%)
Place of birth for the foreign-born population - Sri Lanka (%)
Place of birth for the foreign-born population - Uzbekistan (%)
Place of birth for the foreign-born population - Other South Central Asia (%)
Place of birth for the foreign-born population - Burma (%)
Place of birth for the foreign-born population - Cambodia (%)
Place of birth for the foreign-born population - Indonesia (%)
Place of birth for the foreign-born population - Laos (%)
Place of birth for the foreign-born population - Malaysia (%)
Place of birth for the foreign-born population - Philippines (%)
Place of birth for the foreign-born population - Singapore (%)
Place of birth for the foreign-born population - Thailand (%)
Place of birth for the foreign-born population - Vietnam (%)
Place of birth for the foreign-born population - Other South Eastern Asia (%)
Place of birth for the foreign-born population - Armenia (%)
Place of birth for the foreign-born population - Iraq (%)
Place of birth for the foreign-born population - Israel (%)
Place of birth for the foreign-born population - Jordan (%)
Place of birth for the foreign-born population - Kuwait (%)
Place of birth for the foreign-born population - Lebanon (%)
Place of birth for the foreign-born population - Saudi Arabia (%)
Place of birth for the foreign-born population - Syria (%)
Place of birth for the foreign-born population - Turkey (%)
Place of birth for the foreign-born population - Yemen (%)
Place of birth for the foreign-born population - Other Western Asia (%)
Place of birth for the foreign-born population - Eritrea (%)
Place of birth for the foreign-born population - Ethiopia (%)
Place of birth for the foreign-born population - Kenya (%)
Place of birth for the foreign-born population - Somalia (%)
Place of birth for the foreign-born population - Uganda (%)
Place of birth for the foreign-born population - Zimbabwe (%)
Place of birth for the foreign-born population - Other Eastern Africa (%)
Place of birth for the foreign-born population - Cameroon (%)
Place of birth for the foreign-born population - Congo (%)
Place of birth for the foreign-born population - Democratic Republic of Congo (Zaire) (%)
Place of birth for the foreign-born population - Other Middle Africa (%)
Place of birth for the foreign-born population - Egypt (%)
Place of birth for the foreign-born population - Morocco (%)
Place of birth for the foreign-born population - Sudan (%)
Place of birth for the foreign-born population - Other Northern Africa (%)
Place of birth for the foreign-born population - South Africa (%)
Place of birth for the foreign-born population - Other Southern Africa (%)
Place of birth for the foreign-born population - Cabo Verde (%)
Place of birth for the foreign-born population - Ghana (%)
Place of birth for the foreign-born population - Liberia (%)
Place of birth for the foreign-born population - Nigeria (%)
Place of birth for the foreign-born population - Senegal (%)
Place of birth for the foreign-born population - Sierra Leone (%)
Place of birth for the foreign-born population - Other Western Africa (%)
Place of birth for the foreign-born population - Australia (%)
Place of birth for the foreign-born population - New Zealand (%)
Place of birth for the foreign-born population - Fiji (%)
Place of birth for the foreign-born population - Micronesia (%)
Place of birth for the foreign-born population - Bahamas (%)
Place of birth for the foreign-born population - Barbados (%)
Place of birth for the foreign-born population - Cuba (%)
Place of birth for the foreign-born population - Dominica (%)
Place of birth for the foreign-born population - Dominican Republic (%)
Place of birth for the foreign-born population - Grenada (%)
Place of birth for the foreign-born population - Haiti (%)
Place of birth for the foreign-born population - Jamaica (%)
Place of birth for the foreign-born population - St. Vincent and the Grenadines (%)
Place of birth for the foreign-born population - Trinidad and Tobago (%)
Place of birth for the foreign-born population - West Indies (%)
Place of birth for the foreign-born population - Other Caribbean (%)
Place of birth for the foreign-born population - Belize (%)
Place of birth for the foreign-born population - Costa Rica (%)
Place of birth for the foreign-born population - El Salvador (%)
Place of birth for the foreign-born population - Guatemala (%)
Place of birth for the foreign-born population - Honduras (%)
Place of birth for the foreign-born population - Mexico (%)
Place of birth for the foreign-born population - Nicaragua (%)
Place of birth for the foreign-born population - Panama (%)
Place of birth for the foreign-born population - Other Central America (%)
Place of birth for the foreign-born population - Argentina (%)
Place of birth for the foreign-born population - Bolivia (%)
Place of birth for the foreign-born population - Brazil (%)
Place of birth for the foreign-born population - Chile (%)
Place of birth for the foreign-born population - Colombia (%)
Place of birth for the foreign-born population - Ecuador (%)
Place of birth for the foreign-born population - Guyana (%)
Place of birth for the foreign-born population - Peru (%)
Place of birth for the foreign-born population - Uruguay (%)
Place of birth for the foreign-born population - Venezuela (%)
Place of birth for the foreign-born population - Other South America (%)
Place of birth for the foreign-born population - Canada (%)
Place of birth for the foreign-born population - Other Northern America (%)
Place of birth for the foreign-born population - Other (%)
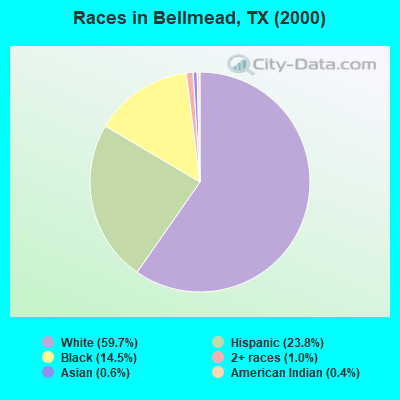
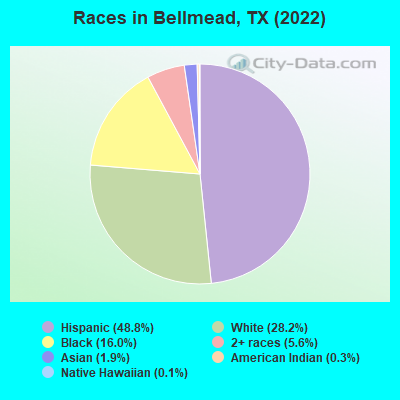
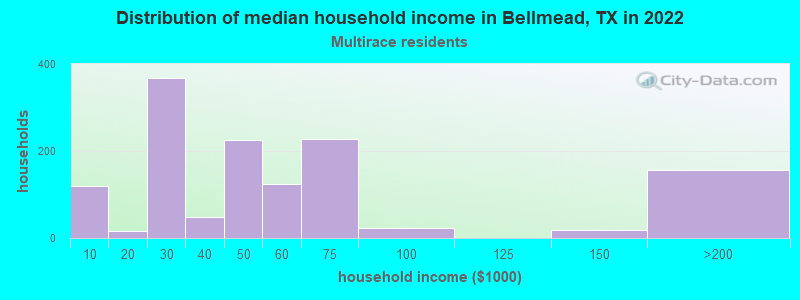
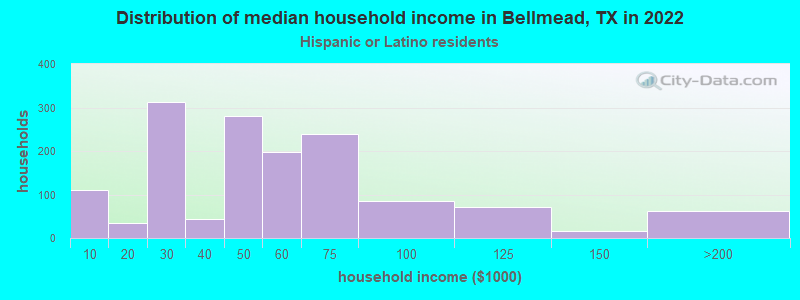
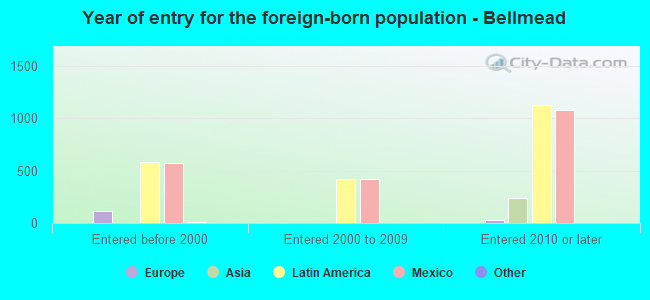
According to 2022 data, the most numerous races in Bellmead, TX are Hispanic (5,230 residents), White alone (3,017 residents), and Black alone (1,714 residents). 58.5% of Bellmead residents speak English at home. 22.1% of Bellmead, TX residents are foreign-born (18.3% born in Latin America), which is 23.1% greater than the foreign-born rate of 17.0% across the entire state of Texas.
Race distribution in Bellmead
2000 2022
10,933,313 52.4% White alone 6,669,666 32.0% Hispanic 2,364,255 11.3% Black alone 554,445 2.7% Asian alone 230,567 1.1% Two or more races 68,859 0.3% American Indian alone 19,958 0.10% Other race alone 10,757 0.05% Native Hawaiian and Other
12,070,642 40.2% Hispanic 11,683,430 38.9% White alone 3,508,706 11.7% Black alone 1,608,173 5.4% Asian alone 956,560 3.2% Two or more races 125,763 0.4% Other race alone 47,023 0.2% American Indian alone 29,275 0.10% Native Hawaiian and Other
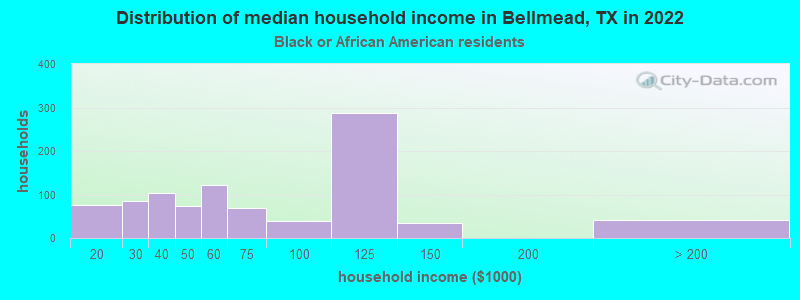
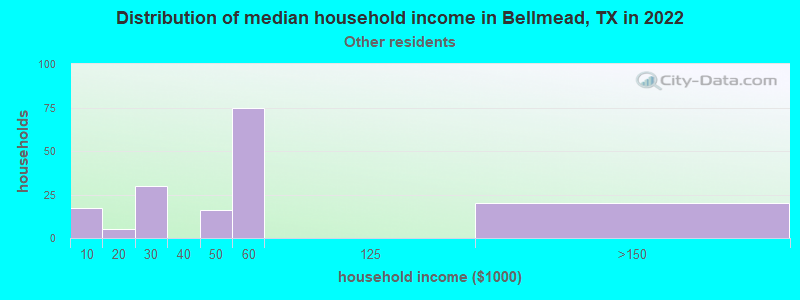
Income and house value in Bellmead Median household income in 2022 $65,254 White non-Hispanic householders$74,821 Black householders$55,401 Some other race householders$43,679 Two or more races householders$52,632 Hispanic or Latino race householdersMedian 2022 house value $146,562 White Non-Hispanic householders$202,128 Black or African American householders$109,268 Some other race householders$132,763 Two or more races householders$108,150 Hispanic or Latino householders
Median age by race in Bellmead
38.8 Median age for White residents36.1 43.7 51.0 Median age for Black or African American residents46.7 56.4 25.3 Median age for American Indian / Alaska Native residents40.1 26.3 39.1 Median age for Asian residents-674,509,803.2 -846,529,813.4 30.6 Median age for Native Hawaiian / Pacific Islander residents32.8 -577,777,777.2 20.9 Median age for Other race residents20.5 18.4 19.0 Median age for Two or more races residents17.8 31.2 54.1 Median age for White alone residents45.8 61.9 22.4 Median age for Hispanic or Latino residents18.6 24.3
Owner/renter occupied households by race in Bellmead
House owners and renters - White residents 942 63.0% Owner occupied552 37.0% Renter occupiedHouse owners and renters - Black or African American residents 418 53.6% Owner occupied361 46.4% Renter occupiedHouse owners and renters - American Indian / Alaska Native residents 31 21.7% Owner occupied112 78.3% Renter occupiedHouse owners and renters - Asian residents 39 100.0% Renter occupiedHouse owners and renters - Native Hawaiian / Pacific Islander residents 28 100.0% Owner occupiedHouse owners and renters - Other race residents 142 88.4% Owner occupied19 11.6% Renter occupiedHouse owners and renters - Two or more races residents 699 53.9% Owner occupied599 46.1% Renter occupiedHouse owners and renters - White alone residents 819 66.9% Owner occupied404 33.1% Renter occupiedHouse owners and renters - Hispanic or Latino residents 725 53.6% Owner occupied626 46.4% Renter occupied
Language usage in Bellmead
English speakers - Total 58.5% of residents of Bellmead speak English at home.
35.6% of residents speak Spanish at home 1,902 52.2% Speak English very well1,745 47.8% Speak English less than very well4.7% of residents speak other language at home 180 37.1% Speak English very well305 62.9% Speak English less than very well
English speakers - Born in the United States 71.5% of residents of Bellmead speak English at home.
21.1% of residents speak Spanish at home 178 49.0% Speak English very well185 51.0% Speak English less than very well1.6% of residents speak other language at home 28 100.0% Speak English very well
English speakers - Native, born elsewhere 97.0% of residents of Bellmead speak English at home.
8.4% of residents speak other language at home 14 100.0% Speak English less than very well
English speakers - Foreign-born 3.3% of residents of Bellmead speak English at home.
80.3% of residents speak Spanish at home 687 38.4% Speak English very well1,103 61.6% Speak English less than very well16.2% of residents speak other language at home 97 26.8% Speak English very well265 73.2% Speak English less than very well
White (Caucasian) - Speak another language Native:
11.7% (427)Foreign-born:
88.3% (271)
American Indian / Alaska Native - Speak another language Native:
70.7% (105)Foreign-born:
98.9% (572)
Native Hawaiian / Pacific Islander - Speak another language Native:
100.0% (106)Foreign-born:
100.0% (12)
Other race - Speak only English Native:
72.5% (245)Foreign-born:
22.7% (48)
Other race - Speak another language Native:
34.0% (115)Foreign-born:
76.3% (163)
Two or more races - Speak only English Native:
49.9% (1,266)Foreign-born:
2.6% (38)
Two or more races - Speak another language Native:
48.8% (1,238)Foreign-born:
97.6% (1,463)
White alone - Speak another language Native:
1.0% (28)Foreign-born:
100.0% (168)
Hispanic or Latino - Speak only English Native:
36.2% (1,096)Foreign-born:
4.1% (75)
Hispanic or Latino - Speak another language Native:
59.3% (1,795)Foreign-born:
95.8% (1,761)
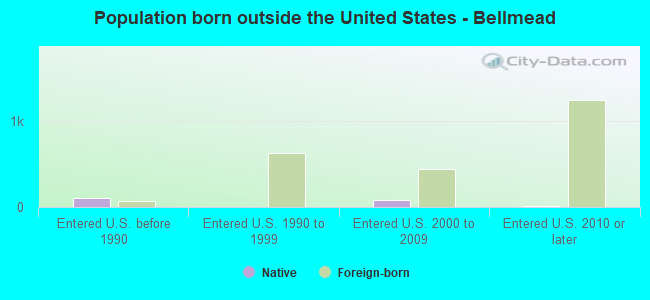
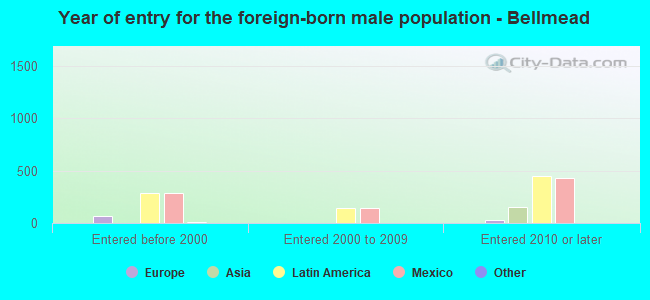
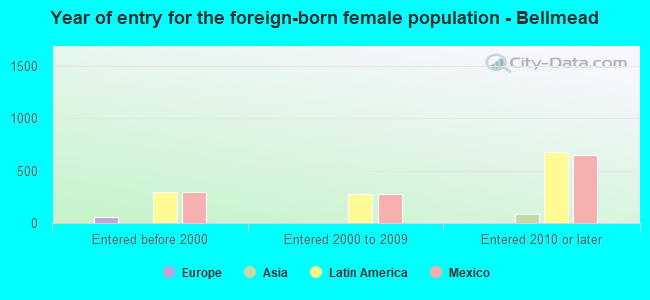
Foreign-born residents in Bellmead 2,368 residents are foreign born (18.3% Latin America ).
This city:
22.1%Texas:
17.1%
Marital status for residents in Bellmead Marital status - White (Caucasian) population 15 years and over
Males 31.8% Never married40.4% Now married13.3% Separated6.2% Widowed8.4% DivorcedFemales 23.4% Never married39.3% Now married14.1% Separated9.3% Widowed13.9% DivorcedWomen who gave birth in the past 12 months Now married:
20.7% (24)Unmarried:
79.3% (93)
Women who did not give birth in the past 12 months Now married:
56.3% (363)Unmarried:
43.7% (282)
Marital status - Black or African American population 15 years and over
Males 21.9% Never married48.3% Now married0.0% Separated6.8% Widowed23.0% DivorcedFemales 35.1% Never married27.4% Now married5.9% Separated17.6% Widowed14.0% DivorcedWomen who did not give birth in the past 12 months Now married:
31.1% (128)Unmarried:
68.9% (284)
Marital status - American Indian / Alaska Native population 15 years and over
Males 0.0% Never married100.0% Now married0.0% Separated0.0% Widowed0.0% DivorcedFemales 62.7% Never married32.5% Now married0.0% Separated0.0% Widowed4.8% DivorcedWomen who did not give birth in the past 12 months Now married:
32.5% (118)Unmarried:
67.5% (244)
Marital status - Asian population 15 years and over
Males 0.0% Never married100.0% Now married0.0% Separated0.0% Widowed0.0% DivorcedFemales 0.0% Never married100.0% Now married0.0% Separated0.0% Widowed0.0% DivorcedWomen who did not give birth in the past 12 months Now married:
100.0% (82)Unmarried:
0.0% (0)
Marital status - Native Hawaiian / Pacific Islander population 15 years and over
Males 0.0% Never married64.3% Now married0.0% Separated0.0% Widowed35.7% DivorcedFemales 61.2% Never married38.8% Now married0.0% Separated0.0% Widowed0.0% DivorcedWomen who did not give birth in the past 12 months Now married:
38.8% (23)Unmarried:
61.2% (36)
Marital status - Other race population 15 years and over
Males 45.9% Never married31.6% Now married0.0% Separated0.0% Widowed22.6% DivorcedFemales 31.2% Never married65.6% Now married0.0% Separated3.1% Widowed0.0% DivorcedWomen who gave birth in the past 12 months Now married:
100.0% (12)Unmarried:
0.0% (0)
Women who did not give birth in the past 12 months Now married:
64.0% (66)Unmarried:
36.0% (37)
Marital status - Two or more races population 15 years and over
Males 61.2% Never married38.8% Now married0.0% Separated0.0% Widowed0.0% DivorcedFemales 34.2% Never married46.3% Now married6.7% Separated0.0% Widowed12.8% DivorcedWomen who did not give birth in the past 12 months Now married:
50.0% (776)Unmarried:
50.0% (776)
Marital status - White alone, not Hispanic / Latino population 15 years and over
Males 28.8% Never married38.5% Now married17.2% Separated7.3% Widowed8.1% DivorcedFemales 16.8% Never married34.4% Now married16.2% Separated13.6% Widowed19.0% DivorcedWomen who gave birth in the past 12 months Now married:
27.7% (13)Unmarried:
72.3% (35)
Women who did not give birth in the past 12 months Now married:
46.4% (144)Unmarried:
53.6% (167)
Marital status - Hispanic or Latino population 15 years and over
Males 46.4% Never married43.5% Now married1.6% Separated1.3% Widowed7.1% DivorcedFemales 43.0% Never married47.7% Now married6.7% Separated0.2% Widowed2.4% DivorcedWomen who gave birth in the past 12 months Now married:
27.7% (29)Unmarried:
72.3% (77)
Women who did not give birth in the past 12 months Now married:
53.4% (827)Unmarried:
46.6% (722)
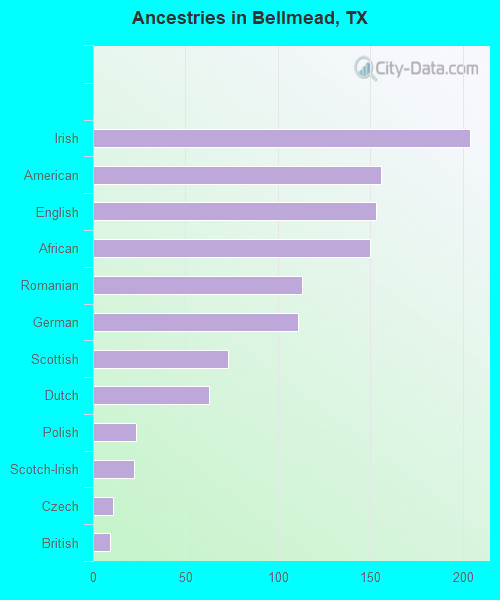
Ancestries in Bellmead
204 2.9% Irish156 2.2% American153 2.2% English150 2.1% African113 1.6% Romanian111 1.6% German73 1.0% Scottish63 0.9% Dutch23 0.3% Polish22 0.3% Scotch-Irish11 0.2% Czech9 0.1% British
Geographical mobility in Bellmead Same house 1 year ago 3,729 88.1% White (Caucasian)1,824 97.6% Black or African American642 100.0% American Indian / Alaska Native115 98.2% Native Hawaiian / Pacific Islander572 85.5% Other race3,755 84.5% Two or more races2,521 85.1% White alone, not Hispanic / Latino4,562 88.0% Hispanic or LatinoMoved within same county 383 9.0% White / Caucasian51 2.7% Black or African American90 13.5% Other race670 15.1% Two or more races333 11.2% White alone, not Hispanic / Latino693 13.4% Hispanic or LatinoMoved within same state 65 1.5% White / Caucasian75 2.5% White alone, not Hispanic / LatinoMoved from different state 16 0.4% White / Caucasian17 0.6% White alone, not Hispanic / LatinoMoved from abroad 6 0.1% White21 1.1% Black or African American258 100.0% Asian8 0.3% White alone, not Hispanic / Latino
Children Nativity (place of birth) in Bellmead
Children under 6 years - Living with two parents Both parents native 178 100.0% NativeBoth parents foreign-born 50 100.0% NativeOne native, one foreign-born parent 8 100.0% NativeChildren under 6 years - Living with one parent Native parent 247 100.0% NativeForeign-born parent 117 81.3% Native27 18.7% Foreign-bornChildren 6 to 17 years - Living with two parents Both parents native 814 99.8% Native1 0.2% Foreign-bornBoth parents foreign-born 711 72.4% Native271 27.6% Foreign-bornOne native, one foreign-born parent 7 100.0% NativeChildren 6 to 17 years - Living with one parent Native parent 351 75.7% Native112 24.3% Foreign-bornForeign-born parent 303 69.3% Native134 30.7% Foreign-born
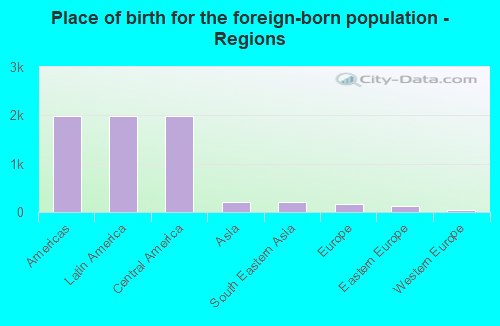
Place of birth for residents in Bellmead 1,982 Americas1,982 Latin America1,982 Central America214 Asia214 South Eastern Asia160 Europe127 Eastern Europe33 Western Europe10 Oceania
Grandparents responsible for own grandchildren in Bellmead
Grandparents (30 to 59 years) White / Caucasian 45 45.5% Responsible for grandchildren54 54.5% Not responsible for grandchildrenBlack or African American 10 100.0% Not responsible for grandchildrenTwo or more races 273 100.0% Responsible for grandchildrenWhite alone, not Hispanic / Latino 27 100.0% Not responsible for grandchildrenHispanic or Latino 246 86.8% Responsible for grandchildren37 13.2% Not responsible for grandchildrenGrandparents (60 years and over) White / Caucasian 59 77.6% Responsible for grandchildren17 22.4% Not responsible for grandchildrenBlack or African American 10 51.1% Responsible for grandchildren10 48.9% Not responsible for grandchildrenWhite alone, not Hispanic / Latino 22 100.0% Not responsible for grandchildrenHispanic or Latino 35 100.0% Responsible for grandchildren