Races in Bellmawr, New Jersey (NJ) Detailed Stats
Data:
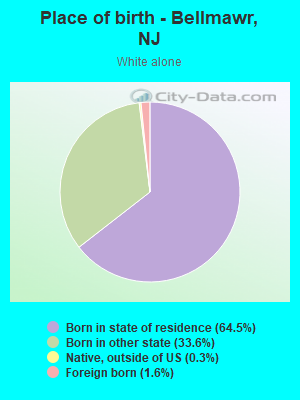
Races - White alone (%)
Races - White alone (% change since 2000)
Races - Black alone (%)
Races - Black alone (% change since 2000)
Races - American Indian alone (%)
Races - American Indian alone (% change since 2000)
Races - Asian alone (%)
Races - Asian alone (% change since 2000)
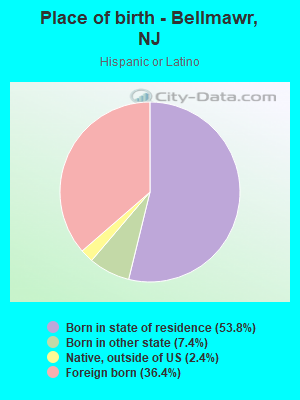
Races - Hispanic (%)
Races - Hispanic (% change since 2000)
Races - Native Hawaiian and Other Pacific Islander alone (%)
Races - Native Hawaiian and Other Pacific Islander alone (% change since 2000)
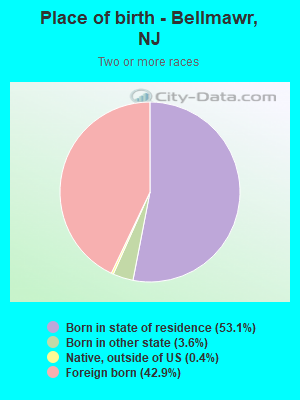
Races - Two or more races(%)
Races - Two or more races(% change since 2000)
Races - Other race alone (%)
Races - Other race alone (% change since 2000)
Racial diversity
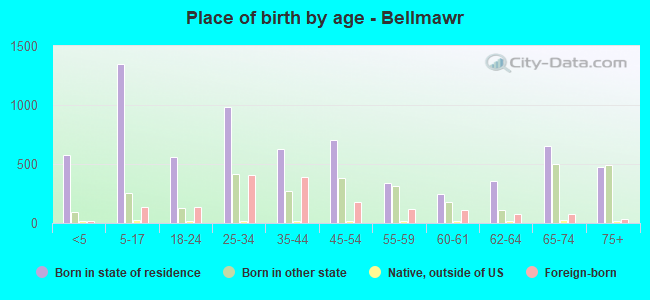
Place of birth - Born in state of residence (%)
Place of birth - Born in state of residence (%) - White
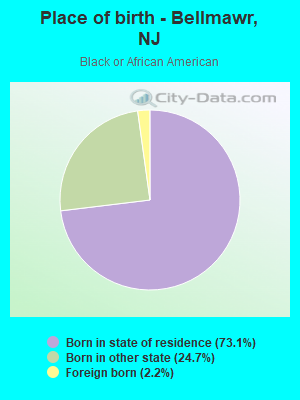
Place of birth - Born in state of residence (%) - Black or African American
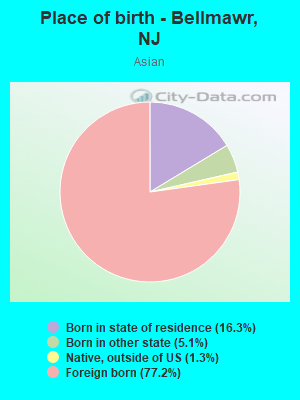
Place of birth - Born in state of residence (%) - Asian
Place of birth - Born in state of residence (%) - Hispanic or Latino
Place of birth - Born in state of residence (%) - American Indian and Alaska Native
Place of birth - Born in state of residence (%) - Multirace
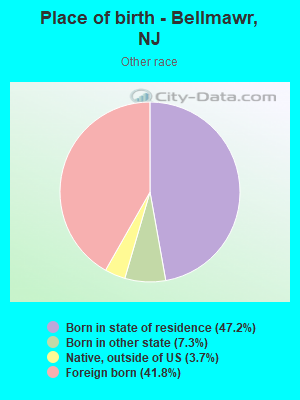
Place of birth - Born in state of residence (%) - Other Race
Place of birth - Born in other state (%)
Place of birth - Born in other state (%) - White
Place of birth - Born in other state (%) - Black or African American
Place of birth - Born in other state (%) - Asian
Place of birth - Born in other state (%) - Hispanic or Latino
Place of birth - Born in other state (%) - American Indian and Alaska Native
Place of birth - Born in other state (%) - Multirace
Place of birth - Born in other state (%) - Other Race
Place of birth - Native, outside of US (%)
Place of birth - Native, outside of US (%) - White
Place of birth - Native, outside of US (%) - Black or African American
Place of birth - Native, outside of US (%) - Asian
Place of birth - Native, outside of US (%) - Hispanic or Latino
Place of birth - Native, outside of US (%) - American Indian and Alaska Native
Place of birth - Native, outside of US (%) - Multirace
Place of birth - Native, outside of US (%) - Other Race
Place of birth - Foreign born (%)
Place of birth - Foreign born (%) - White
Place of birth - Foreign born (%) - Black or African American
Place of birth - Foreign born (%) - Asian
Place of birth - Foreign born (%) - Hispanic or Latino
Place of birth - Foreign born (%) - American Indian and Alaska Native
Place of birth - Foreign born (%) - Multirace
Place of birth - Foreign born (%) - Other Race
Residents speaking English at home (%)
Residents speaking English at home - Born in the United States (%)
Residents speaking English at home - Native, born elsewhere (%)
Residents speaking English at home - Foreign born (%)
Residents speaking Spanish at home (%)
Residents speaking Spanish at home - Born in the United States (%)
Residents speaking Spanish at home - Native, born elsewhere (%)
Residents speaking Spanish at home - Foreign born (%)
Residents speaking other language at home (%)
Residents speaking other language at home - Born in the United States (%)
Residents speaking other language at home - Native, born elsewhere (%)
Residents speaking other language at home - Foreign born (%)
Marital status - Never married (%)
Marital status - Now married (%)
Marital status - Separated (%)
Marital status - Widowed (%)
Marital status - Divorced (%)
Ancestries Reported - Arab (%)
Ancestries Reported - Czech (%)
Ancestries Reported - Danish (%)
Ancestries Reported - Dutch (%)
Ancestries Reported - English (%)
Ancestries Reported - French (%)
Ancestries Reported - French Canadian (%)
Ancestries Reported - German (%)
Ancestries Reported - Greek (%)
Ancestries Reported - Hungarian (%)
Ancestries Reported - Irish (%)
Ancestries Reported - Italian (%)
Ancestries Reported - Lithuanian (%)
Ancestries Reported - Norwegian (%)
Ancestries Reported - Polish (%)
Ancestries Reported - Portuguese (%)
Ancestries Reported - Russian (%)
Ancestries Reported - Scotch-Irish (%)
Ancestries Reported - Scottish (%)
Ancestries Reported - Slovak (%)
Ancestries Reported - Subsaharan African (%)
Ancestries Reported - Swedish (%)
Ancestries Reported - Swiss (%)
Ancestries Reported - Ukrainian (%)
Ancestries Reported - United States (%)
Ancestries Reported - Welsh (%)
Ancestries Reported - West Indian (%)
Ancestries Reported - Other (%)
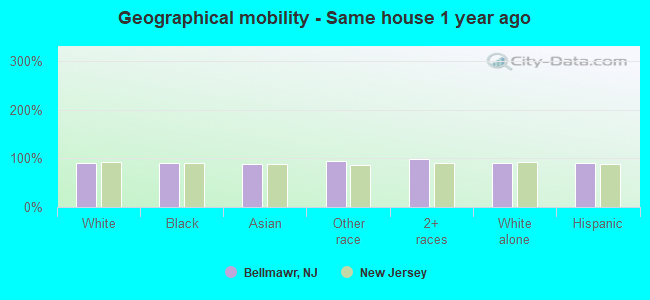
Geographical mobility - Same house 1 year ago (%)
Geographical mobility - Same house 1 year ago (%) - White
Geographical mobility - Same house 1 year ago (%) - Black or African American
Geographical mobility - Same house 1 year ago (%) - Asian
Geographical mobility - Same house 1 year ago (%) - Hispanic or Latino
Geographical mobility - Same house 1 year ago (%) - American Indian and Alaska Native
Geographical mobility - Same house 1 year ago (%) - Multirace
Geographical mobility - Same house 1 year ago (%) - Other Race
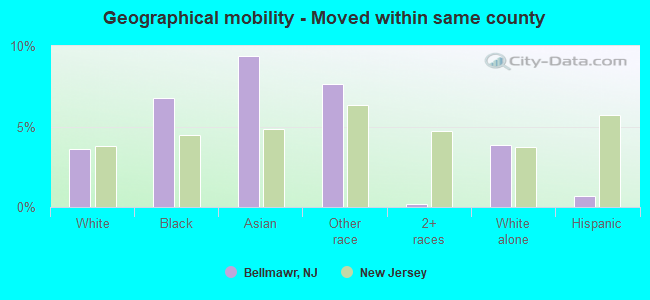
Geographical mobility - Moved within same county (%)
Geographical mobility - Moved within same county (%) - White
Geographical mobility - Moved within same county (%) - Black or African American
Geographical mobility - Moved within same county (%) - Asian
Geographical mobility - Moved within same county (%) - Hispanic or Latino
Geographical mobility - Moved within same county (%) - American Indian and Alaska Native
Geographical mobility - Moved within same county (%) - Multirace
Geographical mobility - Moved within same county (%) - Other Race
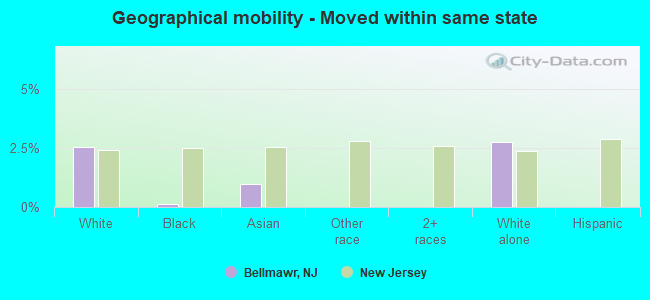
Geographical mobility - Moved from different county within same state (%)
Geographical mobility - Moved from different county within same state (%) - White
Geographical mobility - Moved from different county within same state (%) - Black or African American
Geographical mobility - Moved from different county within same state (%) - Asian
Geographical mobility - Moved from different county within same state (%) - Hispanic or Latino
Geographical mobility - Moved from different county within same state (%) - American Indian and Alaska Native
Geographical mobility - Moved from different county within same state (%) - Multirace
Geographical mobility - Moved from different county within same state (%) - Other Race
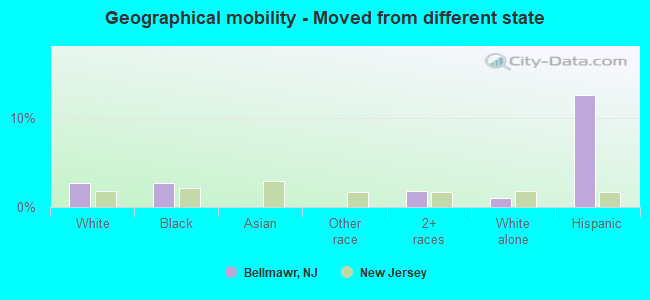
Geographical mobility - Moved from different state (%)
Geographical mobility - Moved from different state (%) - White
Geographical mobility - Moved from different state (%) - Black or African American
Geographical mobility - Moved from different state (%) - Asian
Geographical mobility - Moved from different state (%) - Hispanic or Latino
Geographical mobility - Moved from different state (%) - American Indian and Alaska Native
Geographical mobility - Moved from different state (%) - Multirace
Geographical mobility - Moved from different state (%) - Other Race
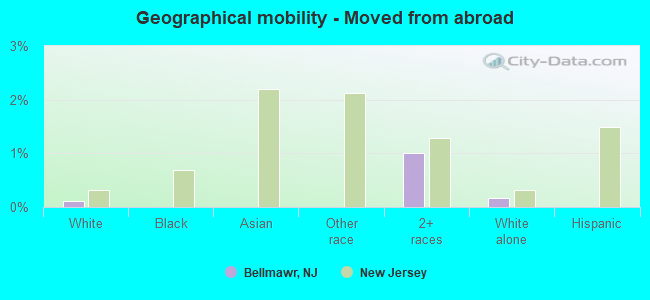
Geographical mobility - Moved from abroad (%)
Geographical mobility - Moved from abroad (%) - White
Geographical mobility - Moved from abroad (%) - Black or African American
Geographical mobility - Moved from abroad (%) - Asian
Geographical mobility - Moved from abroad (%) - Hispanic or Latino
Geographical mobility - Moved from abroad (%) - American Indian and Alaska Native
Geographical mobility - Moved from abroad (%) - Multirace
Geographical mobility - Moved from abroad (%) - Other Race
Place of birth for the foreign-born population - Ireland (%)
Place of birth for the foreign-born population - Denmark (%)
Place of birth for the foreign-born population - Norway (%)
Place of birth for the foreign-born population - Sweden (%)
Place of birth for the foreign-born population - United Kingdom (%)
Place of birth for the foreign-born population - England (%)
Place of birth for the foreign-born population - Scotland (%)
Place of birth for the foreign-born population - Other Northern Europe (%)
Place of birth for the foreign-born population - Austria (%)
Place of birth for the foreign-born population - Belgium (%)
Place of birth for the foreign-born population - France (%)
Place of birth for the foreign-born population - Germany (%)
Place of birth for the foreign-born population - Netherlands (%)
Place of birth for the foreign-born population - Switzerland (%)
Place of birth for the foreign-born population - Other Western Europe (%)
Place of birth for the foreign-born population - Greece (%)
Place of birth for the foreign-born population - Italy (%)
Place of birth for the foreign-born population - Portugal (%)
Place of birth for the foreign-born population - Spain (%)
Place of birth for the foreign-born population - Other Southern Europe (%)
Place of birth for the foreign-born population - Albania (%)
Place of birth for the foreign-born population - Belarus (%)
Place of birth for the foreign-born population - Bosnia and Herzegovina (%)
Place of birth for the foreign-born population - Bulgaria (%)
Place of birth for the foreign-born population - Croatia (%)
Place of birth for the foreign-born population - Czechoslovakia (%)
Place of birth for the foreign-born population - Hungary (%)
Place of birth for the foreign-born population - Latvia (%)
Place of birth for the foreign-born population - Lithuania (%)
Place of birth for the foreign-born population - North Macedonia (Macedonia) (%)
Place of birth for the foreign-born population - Moldova (%)
Place of birth for the foreign-born population - Poland (%)
Place of birth for the foreign-born population - Romania (%)
Place of birth for the foreign-born population - Russia (%)
Place of birth for the foreign-born population - Serbia (%)
Place of birth for the foreign-born population - Ukraine (%)
Place of birth for the foreign-born population - Other Eastern Europe (%)
Place of birth for the foreign-born population - China (%)
Place of birth for the foreign-born population - Hong Kong (%)
Place of birth for the foreign-born population - Taiwan (%)
Place of birth for the foreign-born population - Japan (%)
Place of birth for the foreign-born population - Korea (%)
Place of birth for the foreign-born population - Other Eastern Asia (%)
Place of birth for the foreign-born population - Afghanistan (%)
Place of birth for the foreign-born population - Bangladesh (%)
Place of birth for the foreign-born population - India (%)
Place of birth for the foreign-born population - Iran (%)
Place of birth for the foreign-born population - Kazakhstan (%)
Place of birth for the foreign-born population - Nepal (%)
Place of birth for the foreign-born population - Pakistan (%)
Place of birth for the foreign-born population - Sri Lanka (%)
Place of birth for the foreign-born population - Uzbekistan (%)
Place of birth for the foreign-born population - Other South Central Asia (%)
Place of birth for the foreign-born population - Burma (%)
Place of birth for the foreign-born population - Cambodia (%)
Place of birth for the foreign-born population - Indonesia (%)
Place of birth for the foreign-born population - Laos (%)
Place of birth for the foreign-born population - Malaysia (%)
Place of birth for the foreign-born population - Philippines (%)
Place of birth for the foreign-born population - Singapore (%)
Place of birth for the foreign-born population - Thailand (%)
Place of birth for the foreign-born population - Vietnam (%)
Place of birth for the foreign-born population - Other South Eastern Asia (%)
Place of birth for the foreign-born population - Armenia (%)
Place of birth for the foreign-born population - Iraq (%)
Place of birth for the foreign-born population - Israel (%)
Place of birth for the foreign-born population - Jordan (%)
Place of birth for the foreign-born population - Kuwait (%)
Place of birth for the foreign-born population - Lebanon (%)
Place of birth for the foreign-born population - Saudi Arabia (%)
Place of birth for the foreign-born population - Syria (%)
Place of birth for the foreign-born population - Turkey (%)
Place of birth for the foreign-born population - Yemen (%)
Place of birth for the foreign-born population - Other Western Asia (%)
Place of birth for the foreign-born population - Eritrea (%)
Place of birth for the foreign-born population - Ethiopia (%)
Place of birth for the foreign-born population - Kenya (%)
Place of birth for the foreign-born population - Somalia (%)
Place of birth for the foreign-born population - Uganda (%)
Place of birth for the foreign-born population - Zimbabwe (%)
Place of birth for the foreign-born population - Other Eastern Africa (%)
Place of birth for the foreign-born population - Cameroon (%)
Place of birth for the foreign-born population - Congo (%)
Place of birth for the foreign-born population - Democratic Republic of Congo (Zaire) (%)
Place of birth for the foreign-born population - Other Middle Africa (%)
Place of birth for the foreign-born population - Egypt (%)
Place of birth for the foreign-born population - Morocco (%)
Place of birth for the foreign-born population - Sudan (%)
Place of birth for the foreign-born population - Other Northern Africa (%)
Place of birth for the foreign-born population - South Africa (%)
Place of birth for the foreign-born population - Other Southern Africa (%)
Place of birth for the foreign-born population - Cabo Verde (%)
Place of birth for the foreign-born population - Ghana (%)
Place of birth for the foreign-born population - Liberia (%)
Place of birth for the foreign-born population - Nigeria (%)
Place of birth for the foreign-born population - Senegal (%)
Place of birth for the foreign-born population - Sierra Leone (%)
Place of birth for the foreign-born population - Other Western Africa (%)
Place of birth for the foreign-born population - Australia (%)
Place of birth for the foreign-born population - New Zealand (%)
Place of birth for the foreign-born population - Fiji (%)
Place of birth for the foreign-born population - Micronesia (%)
Place of birth for the foreign-born population - Bahamas (%)
Place of birth for the foreign-born population - Barbados (%)
Place of birth for the foreign-born population - Cuba (%)
Place of birth for the foreign-born population - Dominica (%)
Place of birth for the foreign-born population - Dominican Republic (%)
Place of birth for the foreign-born population - Grenada (%)
Place of birth for the foreign-born population - Haiti (%)
Place of birth for the foreign-born population - Jamaica (%)
Place of birth for the foreign-born population - St. Vincent and the Grenadines (%)
Place of birth for the foreign-born population - Trinidad and Tobago (%)
Place of birth for the foreign-born population - West Indies (%)
Place of birth for the foreign-born population - Other Caribbean (%)
Place of birth for the foreign-born population - Belize (%)
Place of birth for the foreign-born population - Costa Rica (%)
Place of birth for the foreign-born population - El Salvador (%)
Place of birth for the foreign-born population - Guatemala (%)
Place of birth for the foreign-born population - Honduras (%)
Place of birth for the foreign-born population - Mexico (%)
Place of birth for the foreign-born population - Nicaragua (%)
Place of birth for the foreign-born population - Panama (%)
Place of birth for the foreign-born population - Other Central America (%)
Place of birth for the foreign-born population - Argentina (%)
Place of birth for the foreign-born population - Bolivia (%)
Place of birth for the foreign-born population - Brazil (%)
Place of birth for the foreign-born population - Chile (%)
Place of birth for the foreign-born population - Colombia (%)
Place of birth for the foreign-born population - Ecuador (%)
Place of birth for the foreign-born population - Guyana (%)
Place of birth for the foreign-born population - Peru (%)
Place of birth for the foreign-born population - Uruguay (%)
Place of birth for the foreign-born population - Venezuela (%)
Place of birth for the foreign-born population - Other South America (%)
Place of birth for the foreign-born population - Canada (%)
Place of birth for the foreign-born population - Other Northern America (%)
Place of birth for the foreign-born population - Other (%)
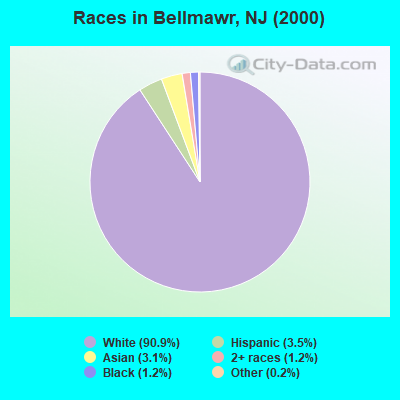
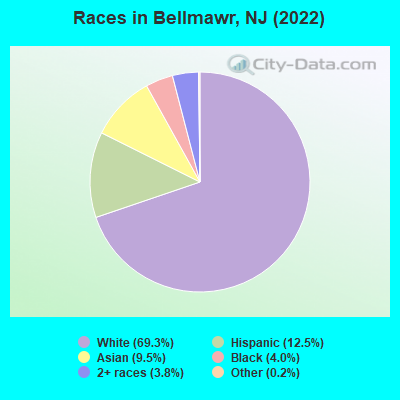
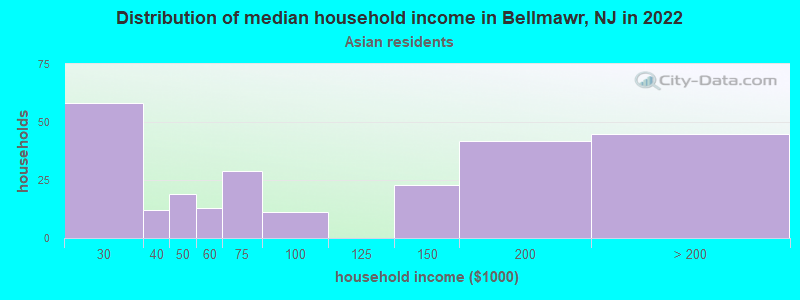
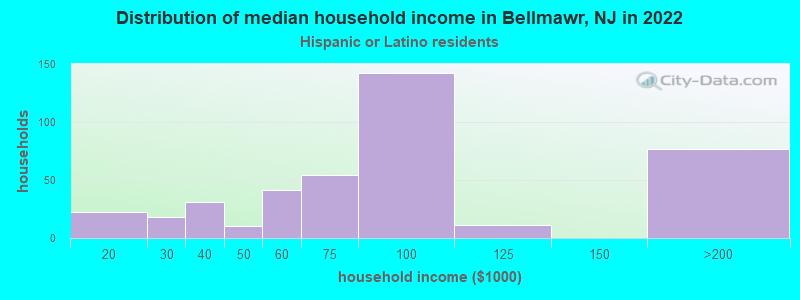
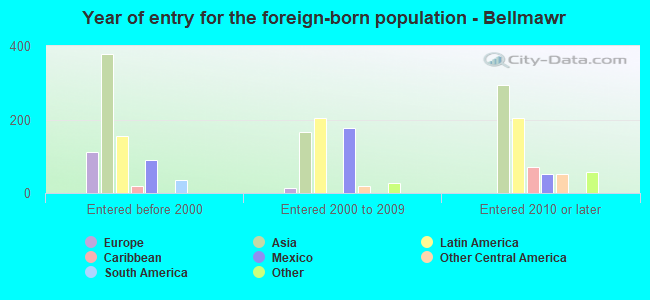
According to 2022 data, the most numerous races in Bellmawr, NJ are White alone (8,126 residents), Hispanic (1,462 residents), and Black alone (469 residents). 80.3% of Bellmawr residents speak English at home. 13.7% of Bellmawr, NJ residents are foreign-born (7.7% born in Asia, 4.0% born in Latin America), which is 67.9% less than the foreign-born rate of 23.0% across the entire state of New Jersey.
Race distribution in Bellmawr
2000 2022
5,557,209 66.0% White alone 1,117,191 13.3% Hispanic 1,096,171 13.0% Black alone 477,012 5.7% Asian alone 133,689 1.6% Two or more races 19,565 0.2% Other race alone 11,338 0.1% American Indian alone 2,175 0.03% Native Hawaiian and Other
4,766,476 51.5% White alone 2,028,470 21.9% Hispanic 1,111,632 12.0% Black alone 923,546 10.0% Asian alone 332,237 3.6% Two or more races 89,847 1.0% Other race alone 8,557 0.09% American Indian alone 934 0.01% Native Hawaiian and Other
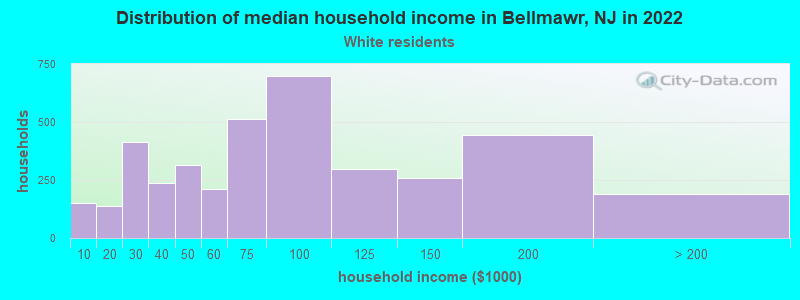
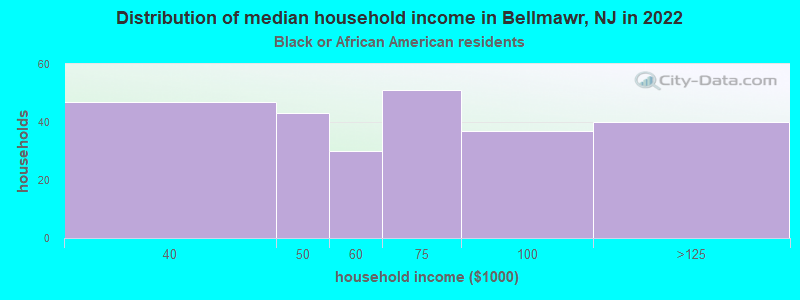
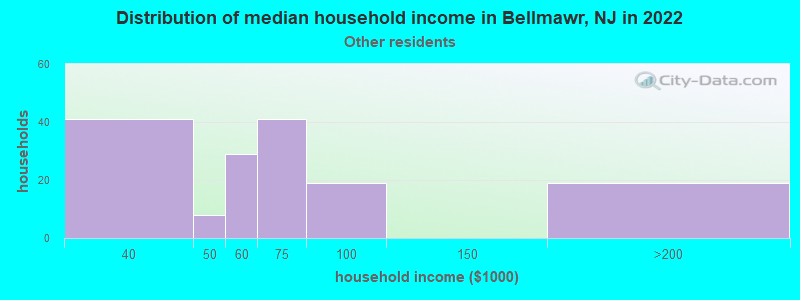
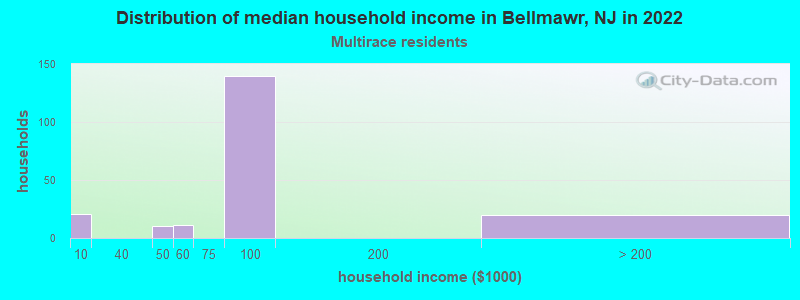
Income and house value in Bellmawr Median household income in 2022 $70,149 White non-Hispanic householders$57,537 Black householders$58,657 Some other race householders$86,246 Two or more races householders$80,078 Hispanic or Latino race householdersMedian 2022 house value $223,946 White Non-Hispanic householders$300,393 Black or African American householders$52,762 American Indian or Alaska Native householders $268,266 Asian householders$222,774 Some other race householders$249,272 Two or more races householders$202,607 Hispanic or Latino householders
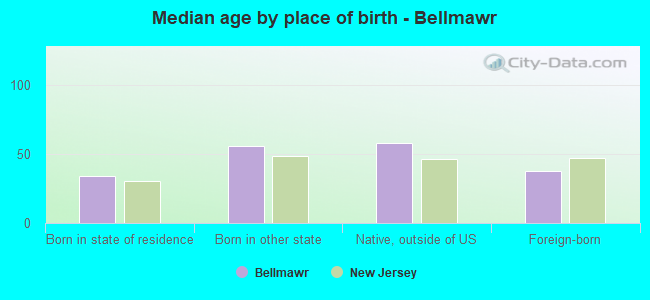
Median age by race in Bellmawr
47.9 Median age for White residents46.8 51.2 30.6 Median age for Black or African American residents29.7 30.3 -676,272,813.9 Median age for American Indian / Alaska Native residents-670,465,336.5 -688,298,917.7 34.2 Median age for Asian residents37.4 34.4 -701,509,871.5 Median age for Native Hawaiian / Pacific Islander residents-860,335,194.7 -668,881,505.4 21.4 Median age for Other race residents22.5 19.6 15.3 Median age for Two or more races residents5.9 40.6 48.9 Median age for White alone residents46.5 52.2 29.5 Median age for Hispanic or Latino residents21.6 29.7
Owner/renter occupied households by race in Bellmawr
House owners and renters - White residents 2,827 71.3% Owner occupied1,139 28.7% Renter occupiedHouse owners and renters - Black or African American residents 268 100.0% Renter occupiedHouse owners and renters - Asian residents 149 61.1% Owner occupied95 38.9% Renter occupiedHouse owners and renters - Other race residents 31 20.6% Owner occupied121 79.4% Renter occupiedHouse owners and renters - Two or more races residents 37 18.2% Owner occupied166 81.8% Renter occupiedHouse owners and renters - White alone residents 2,805 71.3% Owner occupied1,130 28.7% Renter occupiedHouse owners and renters - Hispanic or Latino residents 101 23.6% Owner occupied327 76.4% Renter occupied
Language usage in Bellmawr
English speakers - Total 80.3% of residents of Bellmawr speak English at home.
8.0% of residents speak Spanish at home 414 47.0% Speak English very well467 53.0% Speak English less than very well10.8% of residents speak other language at home 599 50.3% Speak English very well593 49.7% Speak English less than very well
English speakers - Born in the United States 98.6% of residents of Bellmawr speak English at home.
0.6% of residents speak Spanish at home 19 100.0% Speak English very well1.5% of residents speak other language at home 33 73.3% Speak English very well12 26.7% Speak English less than very well
English speakers - Native, born elsewhere 42.2% of residents of Bellmawr speak English at home.
25.3% of residents speak Spanish at home 11 52.4% Speak English very well10 47.6% Speak English less than very well30.1% of residents speak other language at home 25 100.0% Speak English very well
English speakers - Foreign-born 7.1% of residents of Bellmawr speak English at home.
32.6% of residents speak Spanish at home 123 22.9% Speak English very well414 77.1% Speak English less than very well57.0% of residents speak other language at home 355 37.8% Speak English very well583 62.2% Speak English less than very well
White (Caucasian) - Speak only English Native:
97.6% (7,709)Foreign-born:
11.8% (19)
White (Caucasian) - Speak another language Native:
2.6% (207)Foreign-born:
88.9% (141)
Black or African American - Speak another language Native:
9.6% (53)Foreign-born:
86.6% (11)
Asian - Speak only English Native:
55.7% (113)Foreign-born:
3.2% (28)
Asian - Speak another language Native:
43.7% (89)Foreign-born:
95.6% (837)
Other race - Speak only English Native:
29.9% (67)Foreign-born:
20.0% (44)
Other race - Speak another language Native:
69.8% (157)Foreign-born:
80.4% (176)
Two or more races - Speak only English Native:
66.7% (210)Foreign-born:
7.1% (31)
Two or more races - Speak another language Native:
32.3% (102)Foreign-born:
90.5% (400)
White alone - Speak only English Native:
97.6% (7,604)Foreign-born:
16.4% (21)
White alone - Speak another language Native:
2.2% (171)Foreign-born:
85.3% (111)
Hispanic or Latino - Speak only English Native:
46.7% (319)Foreign-born:
5.4% (30)
Hispanic or Latino - Speak another language Native:
53.0% (362)Foreign-born:
94.8% (528)
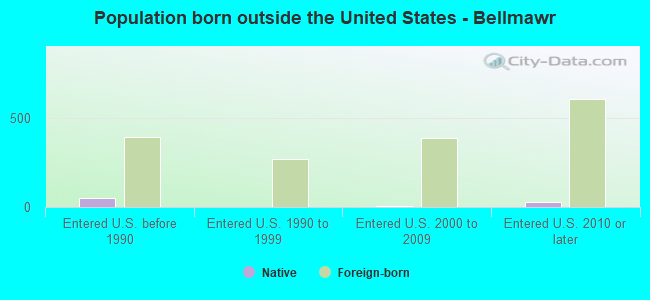
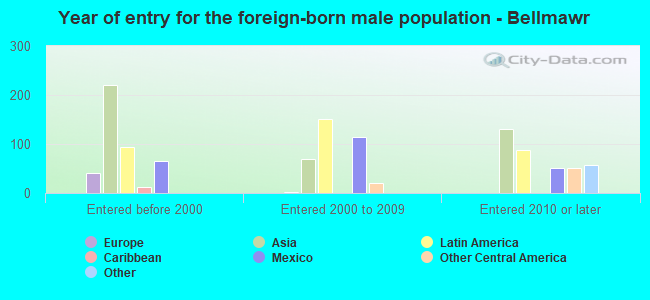
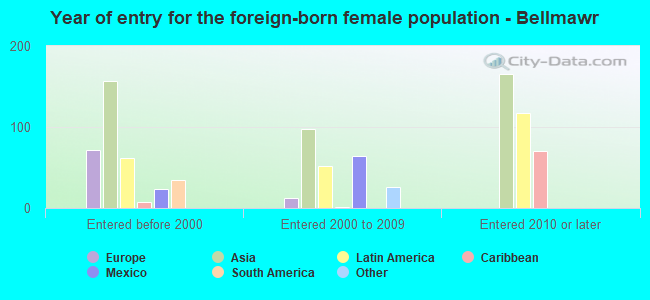
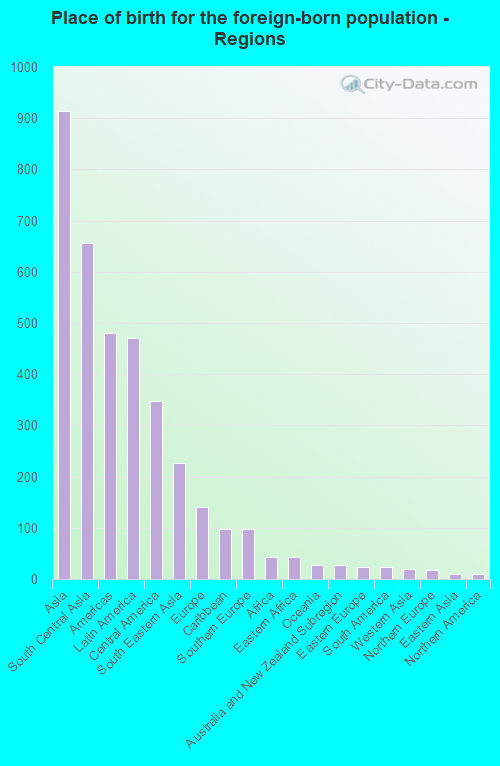
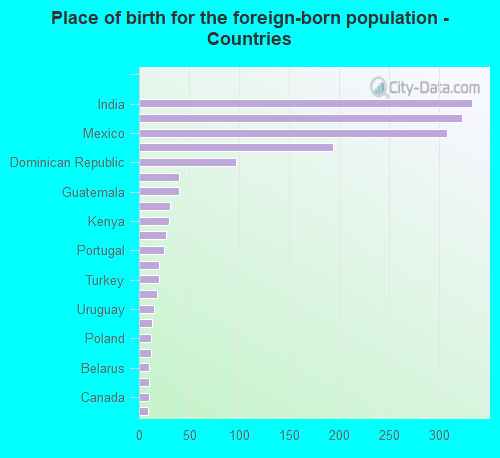
Foreign-born residents in Bellmawr 1,607 residents are foreign born (7.7% Asia , 4.0% Latin America ).
This city:
13.7%New Jersey:
23.2%
Marital status for residents in Bellmawr Marital status - White (Caucasian) population 15 years and over
Males 37.3% Never married41.4% Now married2.5% Separated6.5% Widowed12.2% DivorcedFemales 25.7% Never married39.2% Now married1.3% Separated18.2% Widowed15.6% DivorcedWomen who gave birth in the past 12 months Now married:
13.9% (16)Unmarried:
86.1% (98)
Women who did not give birth in the past 12 months Now married:
35.5% (461)Unmarried:
64.5% (839)
Marital status - Black or African American population 15 years and over
Males 67.8% Never married20.8% Now married0.0% Separated0.0% Widowed11.4% DivorcedFemales 34.9% Never married40.3% Now married6.0% Separated0.0% Widowed18.8% DivorcedWomen who gave birth in the past 12 months Now married:
100.0% (41)Unmarried:
0.0% (0)
Women who did not give birth in the past 12 months Now married:
39.4% (54)Unmarried:
60.6% (83)
Marital status - Asian population 15 years and over
Males 26.7% Never married71.4% Now married0.0% Separated1.8% Widowed0.0% DivorcedFemales 32.3% Never married61.4% Now married0.0% Separated0.0% Widowed6.3% DivorcedWomen who gave birth in the past 12 months Now married:
0.0% (0)Unmarried:
100.0% (36)
Women who did not give birth in the past 12 months Now married:
55.1% (154)Unmarried:
44.9% (126)
Marital status - Other race population 15 years and over
Males 62.8% Never married37.2% Now married0.0% Separated0.0% Widowed0.0% DivorcedFemales 54.9% Never married38.4% Now married0.0% Separated6.7% Widowed0.0% DivorcedWomen who did not give birth in the past 12 months Now married:
36.6% (58)Unmarried:
63.4% (100)
Marital status - Two or more races population 15 years and over
Males 1.4% Never married95.0% Now married0.0% Separated0.0% Widowed3.6% DivorcedFemales 11.6% Never married75.3% Now married5.1% Separated3.5% Widowed4.5% DivorcedWomen who did not give birth in the past 12 months Now married:
83.1% (215)Unmarried:
16.9% (44)
Marital status - White alone, not Hispanic / Latino population 15 years and over
Males 37.7% Never married41.5% Now married1.4% Separated6.8% Widowed12.6% DivorcedFemales 25.6% Never married38.9% Now married1.4% Separated18.3% Widowed15.8% DivorcedWomen who gave birth in the past 12 months Now married:
13.9% (16)Unmarried:
86.1% (101)
Women who did not give birth in the past 12 months Now married:
34.4% (422)Unmarried:
65.6% (803)
Marital status - Hispanic or Latino population 15 years and over
Males 33.4% Never married56.4% Now married10.2% Separated0.0% Widowed0.0% DivorcedFemales 30.2% Never married55.4% Now married1.7% Separated8.3% Widowed4.3% DivorcedWomen who did not give birth in the past 12 months Now married:
59.3% (239)Unmarried:
40.7% (164)
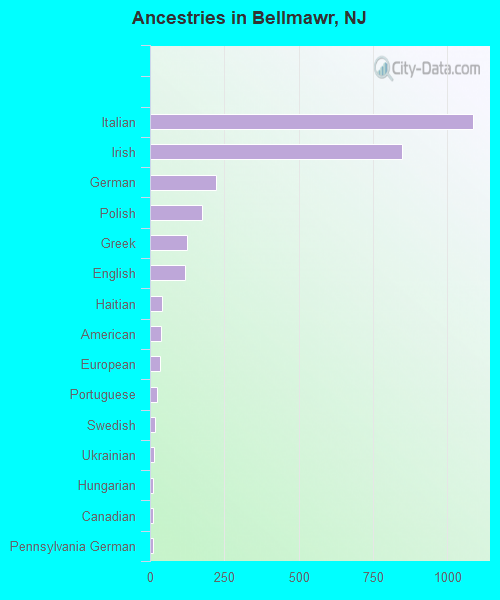
Ancestries in Bellmawr
1,086 21.4% Italian849 16.8% Irish223 4.4% German175 3.5% Polish125 2.5% Greek117 2.3% English41 0.8% Haitian38 0.8% American32 0.6% European22 0.4% Portuguese17 0.3% Swedish13 0.3% Ukrainian11 0.2% Hungarian10 0.2% Canadian10 0.2% Pennsylvania German9 0.2% Brazilian8 0.2% Scottish7 0.1% Eastern European7 0.1% Welsh5 0.10% Danish3 0.06% French Canadian
Children Nativity (place of birth) in Bellmawr
Children under 6 years - Living with two parents Both parents native 261 100.0% NativeBoth parents foreign-born 267 100.0% NativeChildren under 6 years - Living with one parent Native parent 218 100.0% NativeForeign-born parent 21 100.0% NativeChildren 6 to 17 years - Living with two parents Both parents native 690 100.0% NativeBoth parents foreign-born 221 82.9% Native46 17.1% Foreign-bornOne native, one foreign-born parent 83 88.6% Native11 11.4% Foreign-bornChildren 6 to 17 years - Living with one parent Native parent 278 100.0% NativeForeign-born parent 157 58.3% Native112 41.7% Foreign-born
Grandparents responsible for own grandchildren in Bellmawr
Grandparents (30 to 59 years) White / Caucasian 12 33.9% Responsible for grandchildren24 66.1% Not responsible for grandchildrenBlack or African American 32 100.0% Responsible for grandchildrenWhite alone, not Hispanic / Latino 13 36.1% Responsible for grandchildren22 63.9% Not responsible for grandchildrenGrandparents (60 years and over) White / Caucasian 192 65.7% Responsible for grandchildren100 34.3% Not responsible for grandchildrenWhite alone, not Hispanic / Latino 202 65.3% Responsible for grandchildren107 34.7% Not responsible for grandchildren