Races in Belle Isle, Florida (FL) Detailed Stats
Data:
Races - White alone (%)
Races - White alone (% change since 2000)
Races - Black alone (%)
Races - Black alone (% change since 2000)
Races - American Indian alone (%)
Races - American Indian alone (% change since 2000)
Races - Asian alone (%)
Races - Asian alone (% change since 2000)
Races - Hispanic (%)
Races - Hispanic (% change since 2000)
Races - Native Hawaiian and Other Pacific Islander alone (%)
Races - Native Hawaiian and Other Pacific Islander alone (% change since 2000)
Races - Two or more races(%)
Races - Two or more races(% change since 2000)
Races - Other race alone (%)
Races - Other race alone (% change since 2000)
Racial diversity
Place of birth - Born in state of residence (%)
Place of birth - Born in state of residence (%) - White
Place of birth - Born in state of residence (%) - Black or African American
Place of birth - Born in state of residence (%) - Asian
Place of birth - Born in state of residence (%) - Hispanic or Latino
Place of birth - Born in state of residence (%) - American Indian and Alaska Native
Place of birth - Born in state of residence (%) - Multirace
Place of birth - Born in state of residence (%) - Other Race
Place of birth - Born in other state (%)
Place of birth - Born in other state (%) - White
Place of birth - Born in other state (%) - Black or African American
Place of birth - Born in other state (%) - Asian
Place of birth - Born in other state (%) - Hispanic or Latino
Place of birth - Born in other state (%) - American Indian and Alaska Native
Place of birth - Born in other state (%) - Multirace
Place of birth - Born in other state (%) - Other Race
Place of birth - Native, outside of US (%)
Place of birth - Native, outside of US (%) - White
Place of birth - Native, outside of US (%) - Black or African American
Place of birth - Native, outside of US (%) - Asian
Place of birth - Native, outside of US (%) - Hispanic or Latino
Place of birth - Native, outside of US (%) - American Indian and Alaska Native
Place of birth - Native, outside of US (%) - Multirace
Place of birth - Native, outside of US (%) - Other Race
Place of birth - Foreign born (%)
Place of birth - Foreign born (%) - White
Place of birth - Foreign born (%) - Black or African American
Place of birth - Foreign born (%) - Asian
Place of birth - Foreign born (%) - Hispanic or Latino
Place of birth - Foreign born (%) - American Indian and Alaska Native
Place of birth - Foreign born (%) - Multirace
Place of birth - Foreign born (%) - Other Race
Residents speaking English at home (%)
Residents speaking English at home - Born in the United States (%)
Residents speaking English at home - Native, born elsewhere (%)
Residents speaking English at home - Foreign born (%)
Residents speaking Spanish at home (%)
Residents speaking Spanish at home - Born in the United States (%)
Residents speaking Spanish at home - Native, born elsewhere (%)
Residents speaking Spanish at home - Foreign born (%)
Residents speaking other language at home (%)
Residents speaking other language at home - Born in the United States (%)
Residents speaking other language at home - Native, born elsewhere (%)
Residents speaking other language at home - Foreign born (%)
Marital status - Never married (%)
Marital status - Now married (%)
Marital status - Separated (%)
Marital status - Widowed (%)
Marital status - Divorced (%)
Ancestries Reported - Arab (%)
Ancestries Reported - Czech (%)
Ancestries Reported - Danish (%)
Ancestries Reported - Dutch (%)
Ancestries Reported - English (%)
Ancestries Reported - French (%)
Ancestries Reported - French Canadian (%)
Ancestries Reported - German (%)
Ancestries Reported - Greek (%)
Ancestries Reported - Hungarian (%)
Ancestries Reported - Irish (%)
Ancestries Reported - Italian (%)
Ancestries Reported - Lithuanian (%)
Ancestries Reported - Norwegian (%)
Ancestries Reported - Polish (%)
Ancestries Reported - Portuguese (%)
Ancestries Reported - Russian (%)
Ancestries Reported - Scotch-Irish (%)
Ancestries Reported - Scottish (%)
Ancestries Reported - Slovak (%)
Ancestries Reported - Subsaharan African (%)
Ancestries Reported - Swedish (%)
Ancestries Reported - Swiss (%)
Ancestries Reported - Ukrainian (%)
Ancestries Reported - United States (%)
Ancestries Reported - Welsh (%)
Ancestries Reported - West Indian (%)
Ancestries Reported - Other (%)
Geographical mobility - Same house 1 year ago (%)
Geographical mobility - Same house 1 year ago (%) - White
Geographical mobility - Same house 1 year ago (%) - Black or African American
Geographical mobility - Same house 1 year ago (%) - Asian
Geographical mobility - Same house 1 year ago (%) - Hispanic or Latino
Geographical mobility - Same house 1 year ago (%) - American Indian and Alaska Native
Geographical mobility - Same house 1 year ago (%) - Multirace
Geographical mobility - Same house 1 year ago (%) - Other Race
Geographical mobility - Moved within same county (%)
Geographical mobility - Moved within same county (%) - White
Geographical mobility - Moved within same county (%) - Black or African American
Geographical mobility - Moved within same county (%) - Asian
Geographical mobility - Moved within same county (%) - Hispanic or Latino
Geographical mobility - Moved within same county (%) - American Indian and Alaska Native
Geographical mobility - Moved within same county (%) - Multirace
Geographical mobility - Moved within same county (%) - Other Race
Geographical mobility - Moved from different county within same state (%)
Geographical mobility - Moved from different county within same state (%) - White
Geographical mobility - Moved from different county within same state (%) - Black or African American
Geographical mobility - Moved from different county within same state (%) - Asian
Geographical mobility - Moved from different county within same state (%) - Hispanic or Latino
Geographical mobility - Moved from different county within same state (%) - American Indian and Alaska Native
Geographical mobility - Moved from different county within same state (%) - Multirace
Geographical mobility - Moved from different county within same state (%) - Other Race
Geographical mobility - Moved from different state (%)
Geographical mobility - Moved from different state (%) - White
Geographical mobility - Moved from different state (%) - Black or African American
Geographical mobility - Moved from different state (%) - Asian
Geographical mobility - Moved from different state (%) - Hispanic or Latino
Geographical mobility - Moved from different state (%) - American Indian and Alaska Native
Geographical mobility - Moved from different state (%) - Multirace
Geographical mobility - Moved from different state (%) - Other Race
Geographical mobility - Moved from abroad (%)
Geographical mobility - Moved from abroad (%) - White
Geographical mobility - Moved from abroad (%) - Black or African American
Geographical mobility - Moved from abroad (%) - Asian
Geographical mobility - Moved from abroad (%) - Hispanic or Latino
Geographical mobility - Moved from abroad (%) - American Indian and Alaska Native
Geographical mobility - Moved from abroad (%) - Multirace
Geographical mobility - Moved from abroad (%) - Other Race
Place of birth for the foreign-born population - Ireland (%)
Place of birth for the foreign-born population - Denmark (%)
Place of birth for the foreign-born population - Norway (%)
Place of birth for the foreign-born population - Sweden (%)
Place of birth for the foreign-born population - United Kingdom (%)
Place of birth for the foreign-born population - England (%)
Place of birth for the foreign-born population - Scotland (%)
Place of birth for the foreign-born population - Other Northern Europe (%)
Place of birth for the foreign-born population - Austria (%)
Place of birth for the foreign-born population - Belgium (%)
Place of birth for the foreign-born population - France (%)
Place of birth for the foreign-born population - Germany (%)
Place of birth for the foreign-born population - Netherlands (%)
Place of birth for the foreign-born population - Switzerland (%)
Place of birth for the foreign-born population - Other Western Europe (%)
Place of birth for the foreign-born population - Greece (%)
Place of birth for the foreign-born population - Italy (%)
Place of birth for the foreign-born population - Portugal (%)
Place of birth for the foreign-born population - Spain (%)
Place of birth for the foreign-born population - Other Southern Europe (%)
Place of birth for the foreign-born population - Albania (%)
Place of birth for the foreign-born population - Belarus (%)
Place of birth for the foreign-born population - Bosnia and Herzegovina (%)
Place of birth for the foreign-born population - Bulgaria (%)
Place of birth for the foreign-born population - Croatia (%)
Place of birth for the foreign-born population - Czechoslovakia (%)
Place of birth for the foreign-born population - Hungary (%)
Place of birth for the foreign-born population - Latvia (%)
Place of birth for the foreign-born population - Lithuania (%)
Place of birth for the foreign-born population - North Macedonia (Macedonia) (%)
Place of birth for the foreign-born population - Moldova (%)
Place of birth for the foreign-born population - Poland (%)
Place of birth for the foreign-born population - Romania (%)
Place of birth for the foreign-born population - Russia (%)
Place of birth for the foreign-born population - Serbia (%)
Place of birth for the foreign-born population - Ukraine (%)
Place of birth for the foreign-born population - Other Eastern Europe (%)
Place of birth for the foreign-born population - China (%)
Place of birth for the foreign-born population - Hong Kong (%)
Place of birth for the foreign-born population - Taiwan (%)
Place of birth for the foreign-born population - Japan (%)
Place of birth for the foreign-born population - Korea (%)
Place of birth for the foreign-born population - Other Eastern Asia (%)
Place of birth for the foreign-born population - Afghanistan (%)
Place of birth for the foreign-born population - Bangladesh (%)
Place of birth for the foreign-born population - India (%)
Place of birth for the foreign-born population - Iran (%)
Place of birth for the foreign-born population - Kazakhstan (%)
Place of birth for the foreign-born population - Nepal (%)
Place of birth for the foreign-born population - Pakistan (%)
Place of birth for the foreign-born population - Sri Lanka (%)
Place of birth for the foreign-born population - Uzbekistan (%)
Place of birth for the foreign-born population - Other South Central Asia (%)
Place of birth for the foreign-born population - Burma (%)
Place of birth for the foreign-born population - Cambodia (%)
Place of birth for the foreign-born population - Indonesia (%)
Place of birth for the foreign-born population - Laos (%)
Place of birth for the foreign-born population - Malaysia (%)
Place of birth for the foreign-born population - Philippines (%)
Place of birth for the foreign-born population - Singapore (%)
Place of birth for the foreign-born population - Thailand (%)
Place of birth for the foreign-born population - Vietnam (%)
Place of birth for the foreign-born population - Other South Eastern Asia (%)
Place of birth for the foreign-born population - Armenia (%)
Place of birth for the foreign-born population - Iraq (%)
Place of birth for the foreign-born population - Israel (%)
Place of birth for the foreign-born population - Jordan (%)
Place of birth for the foreign-born population - Kuwait (%)
Place of birth for the foreign-born population - Lebanon (%)
Place of birth for the foreign-born population - Saudi Arabia (%)
Place of birth for the foreign-born population - Syria (%)
Place of birth for the foreign-born population - Turkey (%)
Place of birth for the foreign-born population - Yemen (%)
Place of birth for the foreign-born population - Other Western Asia (%)
Place of birth for the foreign-born population - Eritrea (%)
Place of birth for the foreign-born population - Ethiopia (%)
Place of birth for the foreign-born population - Kenya (%)
Place of birth for the foreign-born population - Somalia (%)
Place of birth for the foreign-born population - Uganda (%)
Place of birth for the foreign-born population - Zimbabwe (%)
Place of birth for the foreign-born population - Other Eastern Africa (%)
Place of birth for the foreign-born population - Cameroon (%)
Place of birth for the foreign-born population - Congo (%)
Place of birth for the foreign-born population - Democratic Republic of Congo (Zaire) (%)
Place of birth for the foreign-born population - Other Middle Africa (%)
Place of birth for the foreign-born population - Egypt (%)
Place of birth for the foreign-born population - Morocco (%)
Place of birth for the foreign-born population - Sudan (%)
Place of birth for the foreign-born population - Other Northern Africa (%)
Place of birth for the foreign-born population - South Africa (%)
Place of birth for the foreign-born population - Other Southern Africa (%)
Place of birth for the foreign-born population - Cabo Verde (%)
Place of birth for the foreign-born population - Ghana (%)
Place of birth for the foreign-born population - Liberia (%)
Place of birth for the foreign-born population - Nigeria (%)
Place of birth for the foreign-born population - Senegal (%)
Place of birth for the foreign-born population - Sierra Leone (%)
Place of birth for the foreign-born population - Other Western Africa (%)
Place of birth for the foreign-born population - Australia (%)
Place of birth for the foreign-born population - New Zealand (%)
Place of birth for the foreign-born population - Fiji (%)
Place of birth for the foreign-born population - Micronesia (%)
Place of birth for the foreign-born population - Bahamas (%)
Place of birth for the foreign-born population - Barbados (%)
Place of birth for the foreign-born population - Cuba (%)
Place of birth for the foreign-born population - Dominica (%)
Place of birth for the foreign-born population - Dominican Republic (%)
Place of birth for the foreign-born population - Grenada (%)
Place of birth for the foreign-born population - Haiti (%)
Place of birth for the foreign-born population - Jamaica (%)
Place of birth for the foreign-born population - St. Vincent and the Grenadines (%)
Place of birth for the foreign-born population - Trinidad and Tobago (%)
Place of birth for the foreign-born population - West Indies (%)
Place of birth for the foreign-born population - Other Caribbean (%)
Place of birth for the foreign-born population - Belize (%)
Place of birth for the foreign-born population - Costa Rica (%)
Place of birth for the foreign-born population - El Salvador (%)
Place of birth for the foreign-born population - Guatemala (%)
Place of birth for the foreign-born population - Honduras (%)
Place of birth for the foreign-born population - Mexico (%)
Place of birth for the foreign-born population - Nicaragua (%)
Place of birth for the foreign-born population - Panama (%)
Place of birth for the foreign-born population - Other Central America (%)
Place of birth for the foreign-born population - Argentina (%)
Place of birth for the foreign-born population - Bolivia (%)
Place of birth for the foreign-born population - Brazil (%)
Place of birth for the foreign-born population - Chile (%)
Place of birth for the foreign-born population - Colombia (%)
Place of birth for the foreign-born population - Ecuador (%)
Place of birth for the foreign-born population - Guyana (%)
Place of birth for the foreign-born population - Peru (%)
Place of birth for the foreign-born population - Uruguay (%)
Place of birth for the foreign-born population - Venezuela (%)
Place of birth for the foreign-born population - Other South America (%)
Place of birth for the foreign-born population - Canada (%)
Place of birth for the foreign-born population - Other Northern America (%)
Place of birth for the foreign-born population - Other (%)
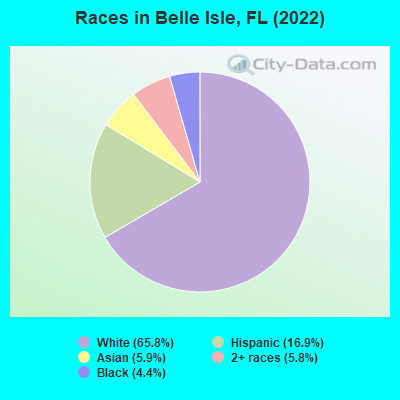
According to 2022 data, the most numerous races in Belle Isle, FL are White alone (4,704 residents), Hispanic (1,210 residents), and Black alone (312 residents). 80.4% of Belle Isle residents speak English at home. 11.2% of Belle Isle, FL residents are foreign-born (6.9% born in Latin America, 2.0% born in Asia, 1.2% born in Oceania), which is 87.6% less than the foreign-born rate of 21.0% across the entire state of Florida.
Race distribution in Belle Isle
2000 2022
10,458,509 65.4% White alone 2,682,715 16.8% Hispanic 2,264,268 14.2% Black alone 261,693 1.6% Asian alone 236,954 1.5% Two or more races 42,358 0.3% American Indian alone 28,994 0.2% Other race alone 6,887 0.04% Native Hawaiian and Other
11,309,403 50.8% White alone 6,025,039 27.1% Hispanic 3,241,015 14.6% Black alone 861,630 3.9% Two or more races 623,692 2.8% Asian alone 152,054 0.7% Other race alone 22,504 0.1% American Indian alone 9,486 0.04% Native Hawaiian and Other
Income and house value in Belle Isle Median household income in 2022 $105,114 White non-Hispanic householdersover $200,000 Black householders$175,223 Two or more races householders$98,807 Hispanic or Latino race householdersMedian 2022 house value $490,740 White Non-Hispanic householders$413,917 Black or African American householders$884,458 Hispanic or Latino householders
Median age by race in Belle Isle
48.6 Median age for White residents47.3 51.1 33.2 Median age for Black or African American residents7.0 38.1 -614,300,100.1 Median age for American Indian / Alaska Native residents-735,632,183.2 -529,680,364.8 34.8 Median age for Asian residents28.7 41.2 -679,790,025.6 Median age for Native Hawaiian / Pacific Islander residents-1,327,635,326.3 -611,111,110.5 37.6 Median age for Other race residents34.8 58.1 28.4 Median age for Two or more races residents43.2 18.8 51.2 Median age for White alone residents50.3 52.0 35.3 Median age for Hispanic or Latino residents35.0 44.4
Owner/renter occupied households by race in Belle Isle
House owners and renters - White residents 1,763 90.7% Owner occupied181 9.3% Renter occupiedHouse owners and renters - Black or African American residents 55 100.0% Owner occupiedHouse owners and renters - Asian residents 133 100.0% Owner occupiedHouse owners and renters - Other race residents 199 100.0% Owner occupiedHouse owners and renters - Two or more races residents 211 100.0% Owner occupiedHouse owners and renters - White alone residents 1,866 91.6% Owner occupied172 8.4% Renter occupiedHouse owners and renters - Hispanic or Latino residents 303 85.5% Owner occupied51 14.5% Renter occupied
Language usage in Belle Isle
English speakers - Total 80.4% of residents of Belle Isle speak English at home.
13.5% of residents speak Spanish at home 633 72.2% Speak English very well244 27.8% Speak English less than very well5.9% of residents speak other language at home 218 56.8% Speak English very well166 43.2% Speak English less than very well
English speakers - Born in the United States 94.6% of residents of Belle Isle speak English at home.
3.7% of residents speak Spanish at home 108 100.0% Speak English very well1.5% of residents speak other language at home 45 100.0% Speak English very well
English speakers - Native, born elsewhere 35.5% of residents of Belle Isle speak English at home.
40.7% of residents speak Spanish at home 70 100.0% Speak English very well26.2% of residents speak other language at home 45 100.0% Speak English very well
English speakers - Foreign-born 19.8% of residents of Belle Isle speak English at home.
57.9% of residents speak Spanish at home 193 42.0% Speak English very well267 58.0% Speak English less than very well21.9% of residents speak other language at home 49 28.2% Speak English very well125 71.8% Speak English less than very well
White (Caucasian) - Speak only English Native:
100.0% (3,942)Foreign-born:
44.7% (83)
White (Caucasian) - Speak another language Native:
4.2% (165)Foreign-born:
60.4% (113)
Asian - Speak only English Native:
73.4% (197)Foreign-born:
17.5% (33)
Asian - Speak another language Native:
28.4% (76)Foreign-born:
81.6% (152)
Other race - Speak another language Native:
80.9% (144)Foreign-born:
100.0% (297)
Two or more races - Speak another language Native:
19.7% (134)Foreign-born:
100.0% (58)
White alone - Speak only English Native:
96.9% (4,056)Foreign-born:
60.7% (69)
White alone - Speak another language Native:
3.2% (135)Foreign-born:
28.5% (33)
Hispanic or Latino - Speak only English Native:
34.1% (197)Foreign-born:
6.8% (32)
Hispanic or Latino - Speak another language Native:
65.5% (379)Foreign-born:
93.0% (444)
Foreign-born residents in Belle Isle 800 residents are foreign born (6.9% Latin America , 2.0% Asia , 1.2% Oceania ).
This city:
11.2%Florida:
21.1%
Marital status for residents in Belle Isle Marital status - White (Caucasian) population 15 years and over
Males 27.6% Never married61.8% Now married0.7% Separated1.0% Widowed8.9% DivorcedFemales 15.7% Never married60.9% Now married2.4% Separated6.7% Widowed14.3% DivorcedWomen who gave birth in the past 12 months Now married:
79.7% (86)Unmarried:
20.3% (22)
Women who did not give birth in the past 12 months Now married:
58.3% (392)Unmarried:
41.7% (281)
Marital status - Black or African American population 15 years and over
Males 13.5% Never married55.1% Now married0.0% Separated0.0% Widowed31.5% DivorcedFemales 17.5% Never married61.2% Now married0.0% Separated20.0% Widowed1.2% DivorcedWomen who gave birth in the past 12 months Now married:
0.0% (0)Unmarried:
100.0% (14)
Women who did not give birth in the past 12 months Now married:
98.0% (49)Unmarried:
2.0% (1)
Marital status - Asian population 15 years and over
Males 43.6% Never married26.0% Now married0.0% Separated0.0% Widowed30.4% DivorcedFemales 17.5% Never married62.5% Now married0.0% Separated0.0% Widowed20.0% DivorcedWomen who did not give birth in the past 12 months Now married:
66.9% (106)Unmarried:
33.1% (53)
Marital status - Other race population 15 years and over
Males 15.6% Never married44.4% Now married0.0% Separated0.0% Widowed40.0% DivorcedFemales 35.4% Never married37.6% Now married0.0% Separated27.1% Widowed0.0% DivorcedWomen who did not give birth in the past 12 months Now married:
23.8% (28)Unmarried:
76.2% (88)
Marital status - Two or more races population 15 years and over
Males 18.9% Never married72.6% Now married0.0% Separated0.0% Widowed8.5% DivorcedFemales 69.1% Never married29.4% Now married0.0% Separated1.5% Widowed0.0% DivorcedWomen who gave birth in the past 12 months Now married:
100.0% (21)Unmarried:
0.0% (0)
Women who did not give birth in the past 12 months Now married:
12.1% (19)Unmarried:
87.9% (135)
Marital status - White alone, not Hispanic / Latino population 15 years and over
Males 22.0% Never married70.6% Now married0.8% Separated1.3% Widowed5.3% DivorcedFemales 16.3% Never married60.1% Now married2.5% Separated7.0% Widowed14.2% DivorcedWomen who gave birth in the past 12 months Now married:
79.7% (102)Unmarried:
20.3% (26)
Women who did not give birth in the past 12 months Now married:
57.5% (433)Unmarried:
42.5% (321)
Marital status - Hispanic or Latino population 15 years and over
Males 42.6% Never married29.9% Now married0.0% Separated0.0% Widowed27.5% DivorcedFemales 30.5% Never married50.6% Now married0.0% Separated14.8% Widowed4.1% DivorcedWomen who did not give birth in the past 12 months Now married:
44.4% (96)Unmarried:
55.6% (120)
Ancestries in Belle Isle
525 20.9% English267 10.6% Irish217 8.7% American160 6.4% German121 4.8% Italian103 4.1% European57 2.3% French46 1.8% Dutch46 1.8% Scandinavian44 1.8% Russian38 1.5% Norwegian35 1.4% Polish34 1.4% Australian25 1.0% Lebanese23 0.9% Scottish21 0.8% Canadian17 0.7% Danish14 0.6% Ukrainian13 0.5% Haitian7 0.3% British
Children Nativity (place of birth) in Belle Isle
Children under 6 years - Living with two parents Both parents native 549 100.0% NativeOne native, one foreign-born parent 13 100.0% NativeChildren under 6 years - Living with one parent Native parent 86 100.0% NativeForeign-born parent 16 100.0% NativeChildren 6 to 17 years - Living with two parents Both parents native 362 100.0% NativeOne native, one foreign-born parent 78 100.0% NativeChildren 6 to 17 years - Living with one parent Native parent 221 100.0% NativeForeign-born parent 49 49.1% Native50 50.9% Foreign-born
Grandparents responsible for own grandchildren in Belle Isle
Grandparents (30 to 59 years) White / Caucasian 16 100.0% Not responsible for grandchildrenWhite alone, not Hispanic / Latino 23 100.0% Not responsible for grandchildren
Grandparents (60 years and over) White / Caucasian 16 100.0% Not responsible for grandchildrenWhite alone, not Hispanic / Latino 22 100.0% Not responsible for grandchildren