Races in Beardstown, Illinois (IL) Detailed Stats
Data:
Races - White alone (%)
Races - White alone (% change since 2000)
Races - Black alone (%)
Races - Black alone (% change since 2000)
Races - American Indian alone (%)
Races - American Indian alone (% change since 2000)
Races - Asian alone (%)
Races - Asian alone (% change since 2000)
Races - Hispanic (%)
Races - Hispanic (% change since 2000)
Races - Native Hawaiian and Other Pacific Islander alone (%)
Races - Native Hawaiian and Other Pacific Islander alone (% change since 2000)
Races - Two or more races(%)
Races - Two or more races(% change since 2000)
Races - Other race alone (%)
Races - Other race alone (% change since 2000)
Racial diversity
Place of birth - Born in state of residence (%)
Place of birth - Born in state of residence (%) - White
Place of birth - Born in state of residence (%) - Black or African American
Place of birth - Born in state of residence (%) - Asian
Place of birth - Born in state of residence (%) - Hispanic or Latino
Place of birth - Born in state of residence (%) - American Indian and Alaska Native
Place of birth - Born in state of residence (%) - Multirace
Place of birth - Born in state of residence (%) - Other Race
Place of birth - Born in other state (%)
Place of birth - Born in other state (%) - White
Place of birth - Born in other state (%) - Black or African American
Place of birth - Born in other state (%) - Asian
Place of birth - Born in other state (%) - Hispanic or Latino
Place of birth - Born in other state (%) - American Indian and Alaska Native
Place of birth - Born in other state (%) - Multirace
Place of birth - Born in other state (%) - Other Race
Place of birth - Native, outside of US (%)
Place of birth - Native, outside of US (%) - White
Place of birth - Native, outside of US (%) - Black or African American
Place of birth - Native, outside of US (%) - Asian
Place of birth - Native, outside of US (%) - Hispanic or Latino
Place of birth - Native, outside of US (%) - American Indian and Alaska Native
Place of birth - Native, outside of US (%) - Multirace
Place of birth - Native, outside of US (%) - Other Race
Place of birth - Foreign born (%)
Place of birth - Foreign born (%) - White
Place of birth - Foreign born (%) - Black or African American
Place of birth - Foreign born (%) - Asian
Place of birth - Foreign born (%) - Hispanic or Latino
Place of birth - Foreign born (%) - American Indian and Alaska Native
Place of birth - Foreign born (%) - Multirace
Place of birth - Foreign born (%) - Other Race
Residents speaking English at home (%)
Residents speaking English at home - Born in the United States (%)
Residents speaking English at home - Native, born elsewhere (%)
Residents speaking English at home - Foreign born (%)
Residents speaking Spanish at home (%)
Residents speaking Spanish at home - Born in the United States (%)
Residents speaking Spanish at home - Native, born elsewhere (%)
Residents speaking Spanish at home - Foreign born (%)
Residents speaking other language at home (%)
Residents speaking other language at home - Born in the United States (%)
Residents speaking other language at home - Native, born elsewhere (%)
Residents speaking other language at home - Foreign born (%)
Marital status - Never married (%)
Marital status - Now married (%)
Marital status - Separated (%)
Marital status - Widowed (%)
Marital status - Divorced (%)
Ancestries Reported - Arab (%)
Ancestries Reported - Czech (%)
Ancestries Reported - Danish (%)
Ancestries Reported - Dutch (%)
Ancestries Reported - English (%)
Ancestries Reported - French (%)
Ancestries Reported - French Canadian (%)
Ancestries Reported - German (%)
Ancestries Reported - Greek (%)
Ancestries Reported - Hungarian (%)
Ancestries Reported - Irish (%)
Ancestries Reported - Italian (%)
Ancestries Reported - Lithuanian (%)
Ancestries Reported - Norwegian (%)
Ancestries Reported - Polish (%)
Ancestries Reported - Portuguese (%)
Ancestries Reported - Russian (%)
Ancestries Reported - Scotch-Irish (%)
Ancestries Reported - Scottish (%)
Ancestries Reported - Slovak (%)
Ancestries Reported - Subsaharan African (%)
Ancestries Reported - Swedish (%)
Ancestries Reported - Swiss (%)
Ancestries Reported - Ukrainian (%)
Ancestries Reported - United States (%)
Ancestries Reported - Welsh (%)
Ancestries Reported - West Indian (%)
Ancestries Reported - Other (%)
Geographical mobility - Same house 1 year ago (%)
Geographical mobility - Same house 1 year ago (%) - White
Geographical mobility - Same house 1 year ago (%) - Black or African American
Geographical mobility - Same house 1 year ago (%) - Asian
Geographical mobility - Same house 1 year ago (%) - Hispanic or Latino
Geographical mobility - Same house 1 year ago (%) - American Indian and Alaska Native
Geographical mobility - Same house 1 year ago (%) - Multirace
Geographical mobility - Same house 1 year ago (%) - Other Race
Geographical mobility - Moved within same county (%)
Geographical mobility - Moved within same county (%) - White
Geographical mobility - Moved within same county (%) - Black or African American
Geographical mobility - Moved within same county (%) - Asian
Geographical mobility - Moved within same county (%) - Hispanic or Latino
Geographical mobility - Moved within same county (%) - American Indian and Alaska Native
Geographical mobility - Moved within same county (%) - Multirace
Geographical mobility - Moved within same county (%) - Other Race
Geographical mobility - Moved from different county within same state (%)
Geographical mobility - Moved from different county within same state (%) - White
Geographical mobility - Moved from different county within same state (%) - Black or African American
Geographical mobility - Moved from different county within same state (%) - Asian
Geographical mobility - Moved from different county within same state (%) - Hispanic or Latino
Geographical mobility - Moved from different county within same state (%) - American Indian and Alaska Native
Geographical mobility - Moved from different county within same state (%) - Multirace
Geographical mobility - Moved from different county within same state (%) - Other Race
Geographical mobility - Moved from different state (%)
Geographical mobility - Moved from different state (%) - White
Geographical mobility - Moved from different state (%) - Black or African American
Geographical mobility - Moved from different state (%) - Asian
Geographical mobility - Moved from different state (%) - Hispanic or Latino
Geographical mobility - Moved from different state (%) - American Indian and Alaska Native
Geographical mobility - Moved from different state (%) - Multirace
Geographical mobility - Moved from different state (%) - Other Race
Geographical mobility - Moved from abroad (%)
Geographical mobility - Moved from abroad (%) - White
Geographical mobility - Moved from abroad (%) - Black or African American
Geographical mobility - Moved from abroad (%) - Asian
Geographical mobility - Moved from abroad (%) - Hispanic or Latino
Geographical mobility - Moved from abroad (%) - American Indian and Alaska Native
Geographical mobility - Moved from abroad (%) - Multirace
Geographical mobility - Moved from abroad (%) - Other Race
Place of birth for the foreign-born population - Ireland (%)
Place of birth for the foreign-born population - Denmark (%)
Place of birth for the foreign-born population - Norway (%)
Place of birth for the foreign-born population - Sweden (%)
Place of birth for the foreign-born population - United Kingdom (%)
Place of birth for the foreign-born population - England (%)
Place of birth for the foreign-born population - Scotland (%)
Place of birth for the foreign-born population - Other Northern Europe (%)
Place of birth for the foreign-born population - Austria (%)
Place of birth for the foreign-born population - Belgium (%)
Place of birth for the foreign-born population - France (%)
Place of birth for the foreign-born population - Germany (%)
Place of birth for the foreign-born population - Netherlands (%)
Place of birth for the foreign-born population - Switzerland (%)
Place of birth for the foreign-born population - Other Western Europe (%)
Place of birth for the foreign-born population - Greece (%)
Place of birth for the foreign-born population - Italy (%)
Place of birth for the foreign-born population - Portugal (%)
Place of birth for the foreign-born population - Spain (%)
Place of birth for the foreign-born population - Other Southern Europe (%)
Place of birth for the foreign-born population - Albania (%)
Place of birth for the foreign-born population - Belarus (%)
Place of birth for the foreign-born population - Bosnia and Herzegovina (%)
Place of birth for the foreign-born population - Bulgaria (%)
Place of birth for the foreign-born population - Croatia (%)
Place of birth for the foreign-born population - Czechoslovakia (%)
Place of birth for the foreign-born population - Hungary (%)
Place of birth for the foreign-born population - Latvia (%)
Place of birth for the foreign-born population - Lithuania (%)
Place of birth for the foreign-born population - North Macedonia (Macedonia) (%)
Place of birth for the foreign-born population - Moldova (%)
Place of birth for the foreign-born population - Poland (%)
Place of birth for the foreign-born population - Romania (%)
Place of birth for the foreign-born population - Russia (%)
Place of birth for the foreign-born population - Serbia (%)
Place of birth for the foreign-born population - Ukraine (%)
Place of birth for the foreign-born population - Other Eastern Europe (%)
Place of birth for the foreign-born population - China (%)
Place of birth for the foreign-born population - Hong Kong (%)
Place of birth for the foreign-born population - Taiwan (%)
Place of birth for the foreign-born population - Japan (%)
Place of birth for the foreign-born population - Korea (%)
Place of birth for the foreign-born population - Other Eastern Asia (%)
Place of birth for the foreign-born population - Afghanistan (%)
Place of birth for the foreign-born population - Bangladesh (%)
Place of birth for the foreign-born population - India (%)
Place of birth for the foreign-born population - Iran (%)
Place of birth for the foreign-born population - Kazakhstan (%)
Place of birth for the foreign-born population - Nepal (%)
Place of birth for the foreign-born population - Pakistan (%)
Place of birth for the foreign-born population - Sri Lanka (%)
Place of birth for the foreign-born population - Uzbekistan (%)
Place of birth for the foreign-born population - Other South Central Asia (%)
Place of birth for the foreign-born population - Burma (%)
Place of birth for the foreign-born population - Cambodia (%)
Place of birth for the foreign-born population - Indonesia (%)
Place of birth for the foreign-born population - Laos (%)
Place of birth for the foreign-born population - Malaysia (%)
Place of birth for the foreign-born population - Philippines (%)
Place of birth for the foreign-born population - Singapore (%)
Place of birth for the foreign-born population - Thailand (%)
Place of birth for the foreign-born population - Vietnam (%)
Place of birth for the foreign-born population - Other South Eastern Asia (%)
Place of birth for the foreign-born population - Armenia (%)
Place of birth for the foreign-born population - Iraq (%)
Place of birth for the foreign-born population - Israel (%)
Place of birth for the foreign-born population - Jordan (%)
Place of birth for the foreign-born population - Kuwait (%)
Place of birth for the foreign-born population - Lebanon (%)
Place of birth for the foreign-born population - Saudi Arabia (%)
Place of birth for the foreign-born population - Syria (%)
Place of birth for the foreign-born population - Turkey (%)
Place of birth for the foreign-born population - Yemen (%)
Place of birth for the foreign-born population - Other Western Asia (%)
Place of birth for the foreign-born population - Eritrea (%)
Place of birth for the foreign-born population - Ethiopia (%)
Place of birth for the foreign-born population - Kenya (%)
Place of birth for the foreign-born population - Somalia (%)
Place of birth for the foreign-born population - Uganda (%)
Place of birth for the foreign-born population - Zimbabwe (%)
Place of birth for the foreign-born population - Other Eastern Africa (%)
Place of birth for the foreign-born population - Cameroon (%)
Place of birth for the foreign-born population - Congo (%)
Place of birth for the foreign-born population - Democratic Republic of Congo (Zaire) (%)
Place of birth for the foreign-born population - Other Middle Africa (%)
Place of birth for the foreign-born population - Egypt (%)
Place of birth for the foreign-born population - Morocco (%)
Place of birth for the foreign-born population - Sudan (%)
Place of birth for the foreign-born population - Other Northern Africa (%)
Place of birth for the foreign-born population - South Africa (%)
Place of birth for the foreign-born population - Other Southern Africa (%)
Place of birth for the foreign-born population - Cabo Verde (%)
Place of birth for the foreign-born population - Ghana (%)
Place of birth for the foreign-born population - Liberia (%)
Place of birth for the foreign-born population - Nigeria (%)
Place of birth for the foreign-born population - Senegal (%)
Place of birth for the foreign-born population - Sierra Leone (%)
Place of birth for the foreign-born population - Other Western Africa (%)
Place of birth for the foreign-born population - Australia (%)
Place of birth for the foreign-born population - New Zealand (%)
Place of birth for the foreign-born population - Fiji (%)
Place of birth for the foreign-born population - Micronesia (%)
Place of birth for the foreign-born population - Bahamas (%)
Place of birth for the foreign-born population - Barbados (%)
Place of birth for the foreign-born population - Cuba (%)
Place of birth for the foreign-born population - Dominica (%)
Place of birth for the foreign-born population - Dominican Republic (%)
Place of birth for the foreign-born population - Grenada (%)
Place of birth for the foreign-born population - Haiti (%)
Place of birth for the foreign-born population - Jamaica (%)
Place of birth for the foreign-born population - St. Vincent and the Grenadines (%)
Place of birth for the foreign-born population - Trinidad and Tobago (%)
Place of birth for the foreign-born population - West Indies (%)
Place of birth for the foreign-born population - Other Caribbean (%)
Place of birth for the foreign-born population - Belize (%)
Place of birth for the foreign-born population - Costa Rica (%)
Place of birth for the foreign-born population - El Salvador (%)
Place of birth for the foreign-born population - Guatemala (%)
Place of birth for the foreign-born population - Honduras (%)
Place of birth for the foreign-born population - Mexico (%)
Place of birth for the foreign-born population - Nicaragua (%)
Place of birth for the foreign-born population - Panama (%)
Place of birth for the foreign-born population - Other Central America (%)
Place of birth for the foreign-born population - Argentina (%)
Place of birth for the foreign-born population - Bolivia (%)
Place of birth for the foreign-born population - Brazil (%)
Place of birth for the foreign-born population - Chile (%)
Place of birth for the foreign-born population - Colombia (%)
Place of birth for the foreign-born population - Ecuador (%)
Place of birth for the foreign-born population - Guyana (%)
Place of birth for the foreign-born population - Peru (%)
Place of birth for the foreign-born population - Uruguay (%)
Place of birth for the foreign-born population - Venezuela (%)
Place of birth for the foreign-born population - Other South America (%)
Place of birth for the foreign-born population - Canada (%)
Place of birth for the foreign-born population - Other Northern America (%)
Place of birth for the foreign-born population - Other (%)
Latest news about races in Beardstown, IL collected exclusively by city-data.com from local newspapers, TV, and radio stations
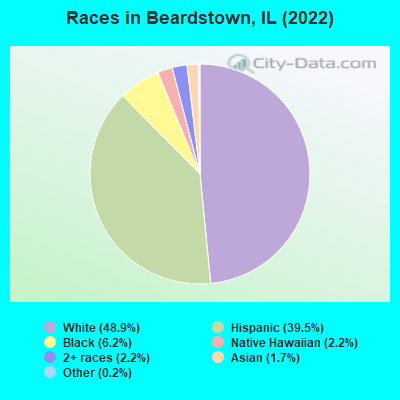
According to 2022 data, the most numerous races in Beardstown, IL are White alone (2,837 residents), Hispanic (2,292 residents), and Black alone (359 residents). 60.4% of Beardstown residents speak English at home. 22.1% of Beardstown, IL residents are foreign-born (14.4% born in Latin America, 4.4% born in Africa), which is 36.6% greater than the foreign-born rate of 14.0% across the entire state of Illinois.
Race distribution in Beardstown
2000 2022
8,424,140 67.8% White alone 1,856,152 14.9% Black alone 1,530,262 12.3% Hispanic 419,916 3.4% Asian alone 153,996 1.2% Two or more races 13,479 0.1% Other race alone 18,232 0.1% American Indian alone 3,116 0.03% Native Hawaiian and Other
7,356,301 58.5% White alone 2,299,726 18.3% Hispanic 1,660,423 13.2% Black alone 747,296 5.9% Asian alone 458,599 3.6% Two or more races 45,386 0.4% Other race alone 10,405 0.08% American Indian alone 3,896 0.03% Native Hawaiian and Other
Income and house value in Beardstown Median household income in 2022 $52,905 White non-Hispanic householders$73,134 Black householders$67,461 Asian householders$83,538 Two or more races householders$77,044 Hispanic or Latino race householdersMedian 2022 house value $83,788 White Non-Hispanic householders$146,143 American Indian or Alaska Native householders $365,357 Asian householders$87,685 Some other race householders$219,214 Two or more races householders$96,064 Hispanic or Latino householders
Median age by race in Beardstown
40.5 Median age for White residents37.2 47.2 29.7 Median age for Black or African American residents26.2 30.6 21.3 Median age for American Indian / Alaska Native residents22.1 -688,956,432.9 40.9 Median age for Asian residents40.5 56.4 26.8 Median age for Native Hawaiian / Pacific Islander residents-658,536,584.7 -576,015,108.0 28.2 Median age for Other race residents30.2 28.0 20.7 Median age for Two or more races residents15.7 21.5 46.2 Median age for White alone residents38.0 52.4 23.2 Median age for Hispanic or Latino residents22.2 25.3
Owner/renter occupied households by race in Beardstown
House owners and renters - White residents 1,078 74.1% Owner occupied376 25.9% Renter occupiedHouse owners and renters - Black or African American residents 59 63.2% Owner occupied34 36.8% Renter occupiedHouse owners and renters - American Indian / Alaska Native residents 32 100.0% Owner occupiedHouse owners and renters - Asian residents 5 10.9% Owner occupied37 89.1% Renter occupiedHouse owners and renters - Native Hawaiian / Pacific Islander residents 20 100.0% Renter occupiedHouse owners and renters - Other race residents 75 50.9% Owner occupied73 49.1% Renter occupiedHouse owners and renters - Two or more races residents 183 63.9% Owner occupied104 36.1% Renter occupiedHouse owners and renters - White alone residents 979 74.0% Owner occupied344 26.0% Renter occupiedHouse owners and renters - Hispanic or Latino residents 348 61.2% Owner occupied220 38.8% Renter occupied
Language usage in Beardstown
English speakers - Total 60.4% of residents of Beardstown speak English at home.
33.2% of residents speak Spanish at home 830 45.2% Speak English very well1,006 54.8% Speak English less than very well6.8% of residents speak other language at home 130 34.8% Speak English very well244 65.2% Speak English less than very well
English speakers - Born in the United States 54.1% of residents of Beardstown speak English at home.
47.5% of residents speak Spanish at home 173 59.7% Speak English very well117 40.3% Speak English less than very well
English speakers - Native, born elsewhere 31.2% of residents of Beardstown speak English at home.
65.4% of residents speak Spanish at home 67 39.4% Speak English very well103 60.6% Speak English less than very well
English speakers - Foreign-born 13.4% of residents of Beardstown speak English at home.
60.7% of residents speak Spanish at home 247 31.7% Speak English very well531 68.3% Speak English less than very well25.5% of residents speak other language at home 83 25.4% Speak English very well244 74.6% Speak English less than very well
White (Caucasian) - Speak only English Native:
89.4% (2,841)Foreign-born:
29.7% (59)
White (Caucasian) - Speak another language Native:
9.0% (286)Foreign-born:
71.8% (142)
Black or African American - Speak only English Native:
58.4% (60)Foreign-born:
2.1% (5)
Black or African American - Speak another language Native:
41.0% (43)Foreign-born:
93.3% (228)
Asian - Speak another language Native:
82.0% (23)Foreign-born:
100.0% (72)
Other race - Speak only English Native:
24.1% (73)Foreign-born:
3.9% (14)
Other race - Speak another language Native:
75.4% (229)Foreign-born:
96.1% (356)
Two or more races - Speak another language Native:
92.4% (605)Foreign-born:
100.0% (333)
White alone - Speak only English Native:
98.3% (2,678)Foreign-born:
92.8% (5)
Hispanic or Latino - Speak only English Native:
26.1% (357)Foreign-born:
8.9% (76)
Hispanic or Latino - Speak another language Native:
73.3% (1,004)Foreign-born:
91.0% (780)
Foreign-born residents in Beardstown 1,282 residents are foreign born (14.4% Latin America , 4.4% Africa ).
This city:
22.1%Illinois:
14.1%
Marital status for residents in Beardstown Marital status - White (Caucasian) population 15 years and over
Males 49.4% Never married40.4% Now married0.0% Separated2.7% Widowed7.6% DivorcedFemales 23.2% Never married44.1% Now married0.7% Separated20.9% Widowed11.2% DivorcedWomen who gave birth in the past 12 months Now married:
78.8% (56)Unmarried:
21.3% (15)
Women who did not give birth in the past 12 months Now married:
44.6% (236)Unmarried:
55.4% (294)
Marital status - Black or African American population 15 years and over
Males 27.1% Never married68.1% Now married0.0% Separated0.0% Widowed4.8% DivorcedFemales 9.6% Never married77.7% Now married4.3% Separated5.3% Widowed3.2% DivorcedWomen who gave birth in the past 12 months Now married:
100.0% (38)Unmarried:
0.0% (0)
Women who did not give birth in the past 12 months Now married:
66.0% (31)Unmarried:
34.0% (16)
Marital status - American Indian / Alaska Native population 15 years and over
Males 63.3% Never married36.7% Now married0.0% Separated0.0% Widowed0.0% DivorcedFemales 0.0% Never married100.0% Now married0.0% Separated0.0% Widowed0.0% DivorcedWomen who did not give birth in the past 12 months Now married:
100.0% (32)Unmarried:
0.0% (0)
Marital status - Asian population 15 years and over
Males 58.1% Never married27.0% Now married0.0% Separated0.0% Widowed14.9% DivorcedFemales 0.0% Never married100.0% Now married0.0% Separated0.0% Widowed0.0% DivorcedWomen who did not give birth in the past 12 months Now married:
100.0% (8)Unmarried:
0.0% (0)
Marital status - Native Hawaiian / Pacific Islander population 15 years and over
Males 42.1% Never married57.9% Now married0.0% Separated0.0% Widowed0.0% DivorcedFemales 0.0% Never married100.0% Now married0.0% Separated0.0% Widowed0.0% DivorcedWomen who gave birth in the past 12 months Now married:
100.0% (87)Unmarried:
0.0% (0)
Marital status - Other race population 15 years and over
Males 24.6% Never married65.6% Now married0.5% Separated0.0% Widowed9.2% DivorcedFemales 62.5% Never married31.0% Now married0.0% Separated0.0% Widowed6.5% DivorcedWomen who did not give birth in the past 12 months Now married:
20.1% (50)Unmarried:
79.9% (199)
Marital status - Two or more races population 15 years and over
Males 35.6% Never married38.4% Now married0.0% Separated0.0% Widowed26.0% DivorcedFemales 41.7% Never married23.6% Now married6.6% Separated0.0% Widowed28.1% DivorcedWomen who did not give birth in the past 12 months Now married:
30.7% (106)Unmarried:
69.3% (240)
Marital status - White alone, not Hispanic / Latino population 15 years and over
Males 48.5% Never married38.6% Now married0.0% Separated3.4% Widowed9.5% DivorcedFemales 24.5% Never married39.2% Now married0.8% Separated24.4% Widowed11.1% DivorcedWomen who gave birth in the past 12 months Now married:
67.9% (34)Unmarried:
32.1% (16)
Women who did not give birth in the past 12 months Now married:
38.3% (174)Unmarried:
61.7% (280)
Marital status - Hispanic or Latino population 15 years and over
Males 40.5% Never married50.1% Now married0.0% Separated0.0% Widowed9.4% DivorcedFemales 39.8% Never married43.4% Now married2.2% Separated0.0% Widowed14.6% DivorcedWomen who gave birth in the past 12 months Now married:
100.0% (27)Unmarried:
0.0% (0)
Women who did not give birth in the past 12 months Now married:
36.9% (220)Unmarried:
63.1% (376)
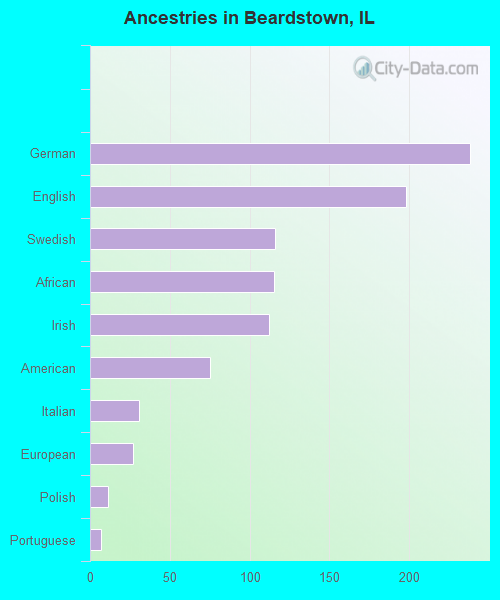
Ancestries in Beardstown
238 7.4% German198 6.2% English116 3.6% Swedish115 3.6% African112 3.5% Irish75 2.3% American31 1.0% Italian27 0.8% European11 0.3% Polish7 0.2% Portuguese
Children Nativity (place of birth) in Beardstown
Children under 6 years - Living with two parents Both parents native 188 100.0% NativeBoth parents foreign-born 48 100.0% NativeChildren under 6 years - Living with one parent Native parent 130 100.0% NativeForeign-born parent 30 91.5% Native3 8.5% Foreign-bornChildren 6 to 17 years - Living with two parents Both parents native 293 100.0% NativeBoth parents foreign-born 305 82.1% Native67 17.9% Foreign-bornOne native, one foreign-born parent 98 100.0% NativeChildren 6 to 17 years - Living with one parent Native parent 292 100.0% NativeForeign-born parent 109 54.3% Native92 45.7% Foreign-born
Grandparents responsible for own grandchildren in Beardstown
Grandparents (30 to 59 years) White / Caucasian 13 100.0% Not responsible for grandchildrenBlack or African American 6 100.0% Not responsible for grandchildrenOther race 35 100.0% Responsible for grandchildrenWhite alone, not Hispanic / Latino 16 100.0% Not responsible for grandchildrenHispanic or Latino 23 100.0% Responsible for grandchildren
Grandparents (60 years and over) White / Caucasian 24 100.0% Not responsible for grandchildrenBlack or African American 7 100.0% Not responsible for grandchildrenWhite alone, not Hispanic / Latino 27 100.0% Not responsible for grandchildren