Races in Bear, Delaware (DE) Detailed Stats
Data:
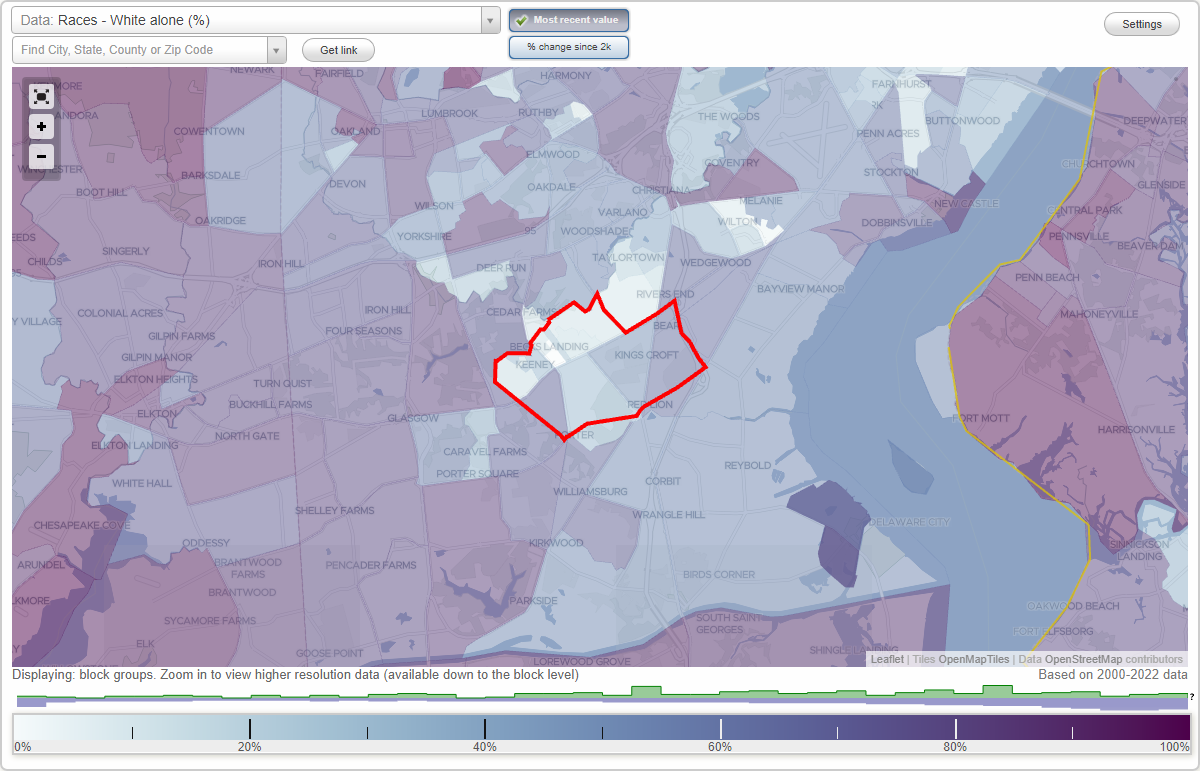
Races - White alone (%)
Races - White alone (% change since 2000)
Races - Black alone (%)
Races - Black alone (% change since 2000)
Races - American Indian alone (%)
Races - American Indian alone (% change since 2000)
Races - Asian alone (%)
Races - Asian alone (% change since 2000)
Races - Hispanic (%)
Races - Hispanic (% change since 2000)
Races - Native Hawaiian and Other Pacific Islander alone (%)
Races - Native Hawaiian and Other Pacific Islander alone (% change since 2000)
Races - Two or more races(%)
Races - Two or more races(% change since 2000)
Races - Other race alone (%)
Races - Other race alone (% change since 2000)
Racial diversity
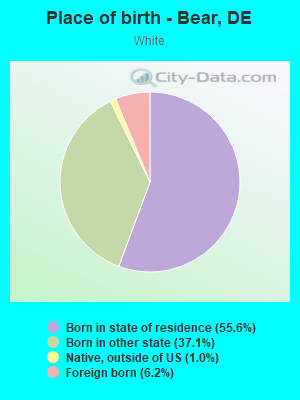
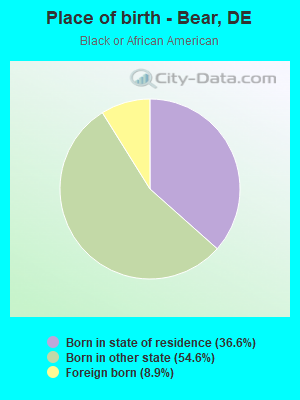
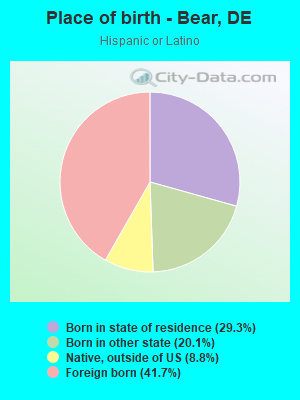
Place of birth - Born in state of residence (%)
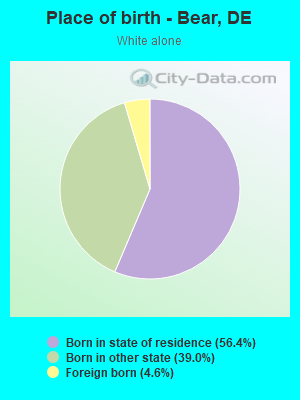
Place of birth - Born in state of residence (%) - White
Place of birth - Born in state of residence (%) - Black or African American
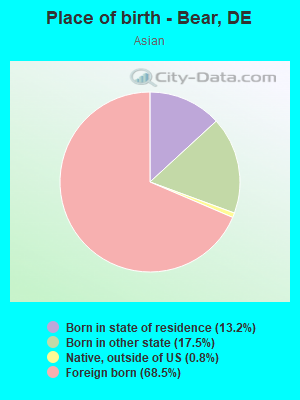
Place of birth - Born in state of residence (%) - Asian
Place of birth - Born in state of residence (%) - Hispanic or Latino
Place of birth - Born in state of residence (%) - American Indian and Alaska Native
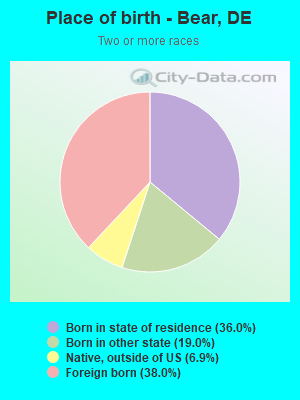
Place of birth - Born in state of residence (%) - Multirace
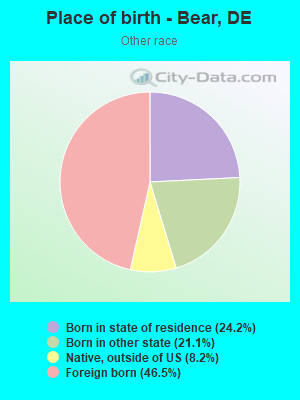
Place of birth - Born in state of residence (%) - Other Race
Place of birth - Born in other state (%)
Place of birth - Born in other state (%) - White
Place of birth - Born in other state (%) - Black or African American
Place of birth - Born in other state (%) - Asian
Place of birth - Born in other state (%) - Hispanic or Latino
Place of birth - Born in other state (%) - American Indian and Alaska Native
Place of birth - Born in other state (%) - Multirace
Place of birth - Born in other state (%) - Other Race
Place of birth - Native, outside of US (%)
Place of birth - Native, outside of US (%) - White
Place of birth - Native, outside of US (%) - Black or African American
Place of birth - Native, outside of US (%) - Asian
Place of birth - Native, outside of US (%) - Hispanic or Latino
Place of birth - Native, outside of US (%) - American Indian and Alaska Native
Place of birth - Native, outside of US (%) - Multirace
Place of birth - Native, outside of US (%) - Other Race
Place of birth - Foreign born (%)
Place of birth - Foreign born (%) - White
Place of birth - Foreign born (%) - Black or African American
Place of birth - Foreign born (%) - Asian
Place of birth - Foreign born (%) - Hispanic or Latino
Place of birth - Foreign born (%) - American Indian and Alaska Native
Place of birth - Foreign born (%) - Multirace
Place of birth - Foreign born (%) - Other Race
Residents speaking English at home (%)
Residents speaking English at home - Born in the United States (%)
Residents speaking English at home - Native, born elsewhere (%)
Residents speaking English at home - Foreign born (%)
Residents speaking Spanish at home (%)
Residents speaking Spanish at home - Born in the United States (%)
Residents speaking Spanish at home - Native, born elsewhere (%)
Residents speaking Spanish at home - Foreign born (%)
Residents speaking other language at home (%)
Residents speaking other language at home - Born in the United States (%)
Residents speaking other language at home - Native, born elsewhere (%)
Residents speaking other language at home - Foreign born (%)
Marital status - Never married (%)
Marital status - Now married (%)
Marital status - Separated (%)
Marital status - Widowed (%)
Marital status - Divorced (%)
Ancestries Reported - Arab (%)
Ancestries Reported - Czech (%)
Ancestries Reported - Danish (%)
Ancestries Reported - Dutch (%)
Ancestries Reported - English (%)
Ancestries Reported - French (%)
Ancestries Reported - French Canadian (%)
Ancestries Reported - German (%)
Ancestries Reported - Greek (%)
Ancestries Reported - Hungarian (%)
Ancestries Reported - Irish (%)
Ancestries Reported - Italian (%)
Ancestries Reported - Lithuanian (%)
Ancestries Reported - Norwegian (%)
Ancestries Reported - Polish (%)
Ancestries Reported - Portuguese (%)
Ancestries Reported - Russian (%)
Ancestries Reported - Scotch-Irish (%)
Ancestries Reported - Scottish (%)
Ancestries Reported - Slovak (%)
Ancestries Reported - Subsaharan African (%)
Ancestries Reported - Swedish (%)
Ancestries Reported - Swiss (%)
Ancestries Reported - Ukrainian (%)
Ancestries Reported - United States (%)
Ancestries Reported - Welsh (%)
Ancestries Reported - West Indian (%)
Ancestries Reported - Other (%)
Geographical mobility - Same house 1 year ago (%)
Geographical mobility - Same house 1 year ago (%) - White
Geographical mobility - Same house 1 year ago (%) - Black or African American
Geographical mobility - Same house 1 year ago (%) - Asian
Geographical mobility - Same house 1 year ago (%) - Hispanic or Latino
Geographical mobility - Same house 1 year ago (%) - American Indian and Alaska Native
Geographical mobility - Same house 1 year ago (%) - Multirace
Geographical mobility - Same house 1 year ago (%) - Other Race
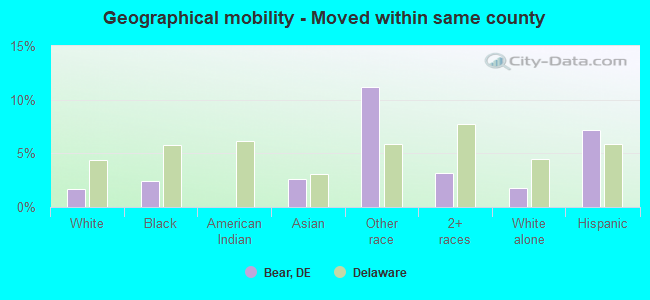
Geographical mobility - Moved within same county (%)
Geographical mobility - Moved within same county (%) - White
Geographical mobility - Moved within same county (%) - Black or African American
Geographical mobility - Moved within same county (%) - Asian
Geographical mobility - Moved within same county (%) - Hispanic or Latino
Geographical mobility - Moved within same county (%) - American Indian and Alaska Native
Geographical mobility - Moved within same county (%) - Multirace
Geographical mobility - Moved within same county (%) - Other Race
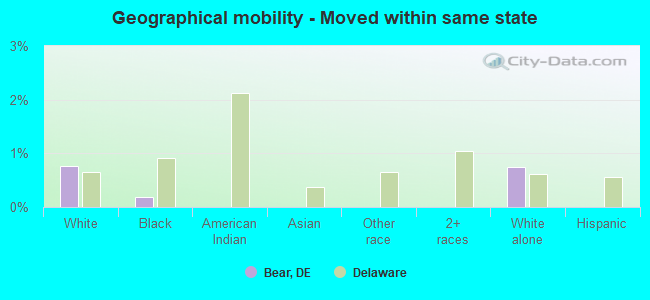
Geographical mobility - Moved from different county within same state (%)
Geographical mobility - Moved from different county within same state (%) - White
Geographical mobility - Moved from different county within same state (%) - Black or African American
Geographical mobility - Moved from different county within same state (%) - Asian
Geographical mobility - Moved from different county within same state (%) - Hispanic or Latino
Geographical mobility - Moved from different county within same state (%) - American Indian and Alaska Native
Geographical mobility - Moved from different county within same state (%) - Multirace
Geographical mobility - Moved from different county within same state (%) - Other Race
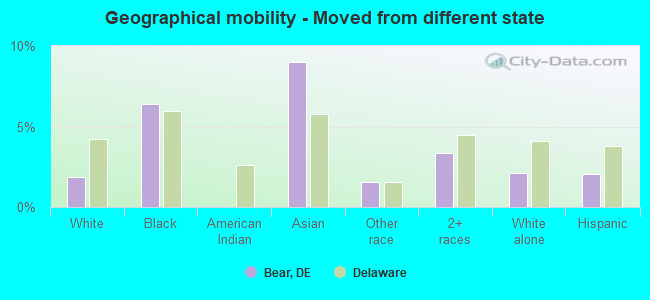
Geographical mobility - Moved from different state (%)
Geographical mobility - Moved from different state (%) - White
Geographical mobility - Moved from different state (%) - Black or African American
Geographical mobility - Moved from different state (%) - Asian
Geographical mobility - Moved from different state (%) - Hispanic or Latino
Geographical mobility - Moved from different state (%) - American Indian and Alaska Native
Geographical mobility - Moved from different state (%) - Multirace
Geographical mobility - Moved from different state (%) - Other Race
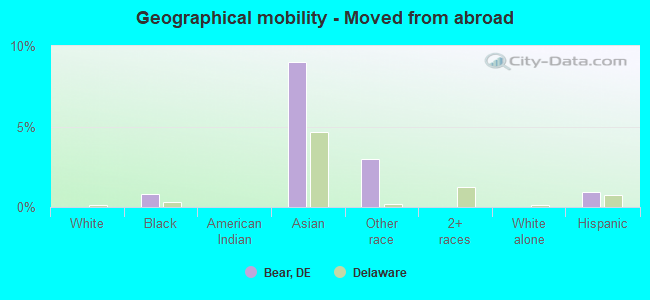
Geographical mobility - Moved from abroad (%)
Geographical mobility - Moved from abroad (%) - White
Geographical mobility - Moved from abroad (%) - Black or African American
Geographical mobility - Moved from abroad (%) - Asian
Geographical mobility - Moved from abroad (%) - Hispanic or Latino
Geographical mobility - Moved from abroad (%) - American Indian and Alaska Native
Geographical mobility - Moved from abroad (%) - Multirace
Geographical mobility - Moved from abroad (%) - Other Race
Place of birth for the foreign-born population - Ireland (%)
Place of birth for the foreign-born population - Denmark (%)
Place of birth for the foreign-born population - Norway (%)
Place of birth for the foreign-born population - Sweden (%)
Place of birth for the foreign-born population - United Kingdom (%)
Place of birth for the foreign-born population - England (%)
Place of birth for the foreign-born population - Scotland (%)
Place of birth for the foreign-born population - Other Northern Europe (%)
Place of birth for the foreign-born population - Austria (%)
Place of birth for the foreign-born population - Belgium (%)
Place of birth for the foreign-born population - France (%)
Place of birth for the foreign-born population - Germany (%)
Place of birth for the foreign-born population - Netherlands (%)
Place of birth for the foreign-born population - Switzerland (%)
Place of birth for the foreign-born population - Other Western Europe (%)
Place of birth for the foreign-born population - Greece (%)
Place of birth for the foreign-born population - Italy (%)
Place of birth for the foreign-born population - Portugal (%)
Place of birth for the foreign-born population - Spain (%)
Place of birth for the foreign-born population - Other Southern Europe (%)
Place of birth for the foreign-born population - Albania (%)
Place of birth for the foreign-born population - Belarus (%)
Place of birth for the foreign-born population - Bosnia and Herzegovina (%)
Place of birth for the foreign-born population - Bulgaria (%)
Place of birth for the foreign-born population - Croatia (%)
Place of birth for the foreign-born population - Czechoslovakia (%)
Place of birth for the foreign-born population - Hungary (%)
Place of birth for the foreign-born population - Latvia (%)
Place of birth for the foreign-born population - Lithuania (%)
Place of birth for the foreign-born population - North Macedonia (Macedonia) (%)
Place of birth for the foreign-born population - Moldova (%)
Place of birth for the foreign-born population - Poland (%)
Place of birth for the foreign-born population - Romania (%)
Place of birth for the foreign-born population - Russia (%)
Place of birth for the foreign-born population - Serbia (%)
Place of birth for the foreign-born population - Ukraine (%)
Place of birth for the foreign-born population - Other Eastern Europe (%)
Place of birth for the foreign-born population - China (%)
Place of birth for the foreign-born population - Hong Kong (%)
Place of birth for the foreign-born population - Taiwan (%)
Place of birth for the foreign-born population - Japan (%)
Place of birth for the foreign-born population - Korea (%)
Place of birth for the foreign-born population - Other Eastern Asia (%)
Place of birth for the foreign-born population - Afghanistan (%)
Place of birth for the foreign-born population - Bangladesh (%)
Place of birth for the foreign-born population - India (%)
Place of birth for the foreign-born population - Iran (%)
Place of birth for the foreign-born population - Kazakhstan (%)
Place of birth for the foreign-born population - Nepal (%)
Place of birth for the foreign-born population - Pakistan (%)
Place of birth for the foreign-born population - Sri Lanka (%)
Place of birth for the foreign-born population - Uzbekistan (%)
Place of birth for the foreign-born population - Other South Central Asia (%)
Place of birth for the foreign-born population - Burma (%)
Place of birth for the foreign-born population - Cambodia (%)
Place of birth for the foreign-born population - Indonesia (%)
Place of birth for the foreign-born population - Laos (%)
Place of birth for the foreign-born population - Malaysia (%)
Place of birth for the foreign-born population - Philippines (%)
Place of birth for the foreign-born population - Singapore (%)
Place of birth for the foreign-born population - Thailand (%)
Place of birth for the foreign-born population - Vietnam (%)
Place of birth for the foreign-born population - Other South Eastern Asia (%)
Place of birth for the foreign-born population - Armenia (%)
Place of birth for the foreign-born population - Iraq (%)
Place of birth for the foreign-born population - Israel (%)
Place of birth for the foreign-born population - Jordan (%)
Place of birth for the foreign-born population - Kuwait (%)
Place of birth for the foreign-born population - Lebanon (%)
Place of birth for the foreign-born population - Saudi Arabia (%)
Place of birth for the foreign-born population - Syria (%)
Place of birth for the foreign-born population - Turkey (%)
Place of birth for the foreign-born population - Yemen (%)
Place of birth for the foreign-born population - Other Western Asia (%)
Place of birth for the foreign-born population - Eritrea (%)
Place of birth for the foreign-born population - Ethiopia (%)
Place of birth for the foreign-born population - Kenya (%)
Place of birth for the foreign-born population - Somalia (%)
Place of birth for the foreign-born population - Uganda (%)
Place of birth for the foreign-born population - Zimbabwe (%)
Place of birth for the foreign-born population - Other Eastern Africa (%)
Place of birth for the foreign-born population - Cameroon (%)
Place of birth for the foreign-born population - Congo (%)
Place of birth for the foreign-born population - Democratic Republic of Congo (Zaire) (%)
Place of birth for the foreign-born population - Other Middle Africa (%)
Place of birth for the foreign-born population - Egypt (%)
Place of birth for the foreign-born population - Morocco (%)
Place of birth for the foreign-born population - Sudan (%)
Place of birth for the foreign-born population - Other Northern Africa (%)
Place of birth for the foreign-born population - South Africa (%)
Place of birth for the foreign-born population - Other Southern Africa (%)
Place of birth for the foreign-born population - Cabo Verde (%)
Place of birth for the foreign-born population - Ghana (%)
Place of birth for the foreign-born population - Liberia (%)
Place of birth for the foreign-born population - Nigeria (%)
Place of birth for the foreign-born population - Senegal (%)
Place of birth for the foreign-born population - Sierra Leone (%)
Place of birth for the foreign-born population - Other Western Africa (%)
Place of birth for the foreign-born population - Australia (%)
Place of birth for the foreign-born population - New Zealand (%)
Place of birth for the foreign-born population - Fiji (%)
Place of birth for the foreign-born population - Micronesia (%)
Place of birth for the foreign-born population - Bahamas (%)
Place of birth for the foreign-born population - Barbados (%)
Place of birth for the foreign-born population - Cuba (%)
Place of birth for the foreign-born population - Dominica (%)
Place of birth for the foreign-born population - Dominican Republic (%)
Place of birth for the foreign-born population - Grenada (%)
Place of birth for the foreign-born population - Haiti (%)
Place of birth for the foreign-born population - Jamaica (%)
Place of birth for the foreign-born population - St. Vincent and the Grenadines (%)
Place of birth for the foreign-born population - Trinidad and Tobago (%)
Place of birth for the foreign-born population - West Indies (%)
Place of birth for the foreign-born population - Other Caribbean (%)
Place of birth for the foreign-born population - Belize (%)
Place of birth for the foreign-born population - Costa Rica (%)
Place of birth for the foreign-born population - El Salvador (%)
Place of birth for the foreign-born population - Guatemala (%)
Place of birth for the foreign-born population - Honduras (%)
Place of birth for the foreign-born population - Mexico (%)
Place of birth for the foreign-born population - Nicaragua (%)
Place of birth for the foreign-born population - Panama (%)
Place of birth for the foreign-born population - Other Central America (%)
Place of birth for the foreign-born population - Argentina (%)
Place of birth for the foreign-born population - Bolivia (%)
Place of birth for the foreign-born population - Brazil (%)
Place of birth for the foreign-born population - Chile (%)
Place of birth for the foreign-born population - Colombia (%)
Place of birth for the foreign-born population - Ecuador (%)
Place of birth for the foreign-born population - Guyana (%)
Place of birth for the foreign-born population - Peru (%)
Place of birth for the foreign-born population - Uruguay (%)
Place of birth for the foreign-born population - Venezuela (%)
Place of birth for the foreign-born population - Other South America (%)
Place of birth for the foreign-born population - Canada (%)
Place of birth for the foreign-born population - Other Northern America (%)
Place of birth for the foreign-born population - Other (%)
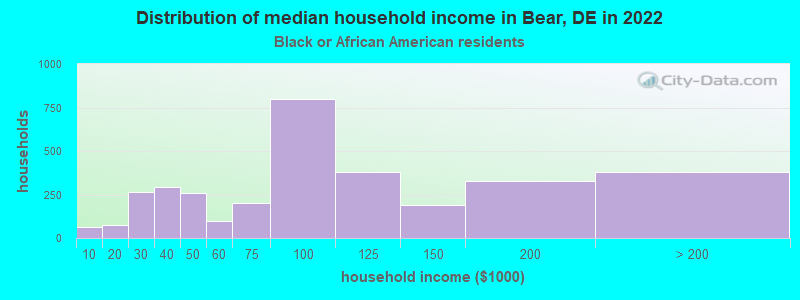
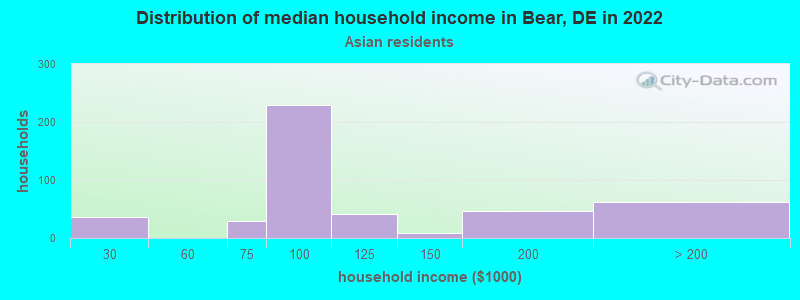
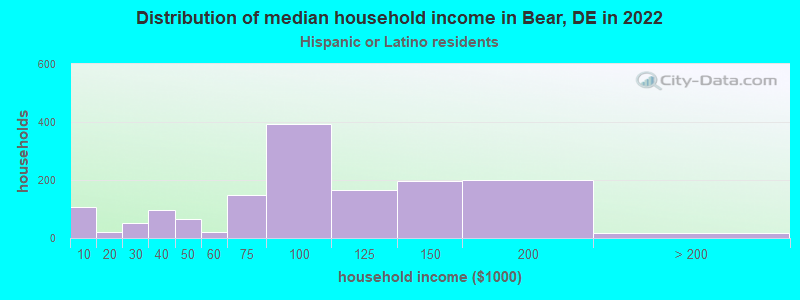
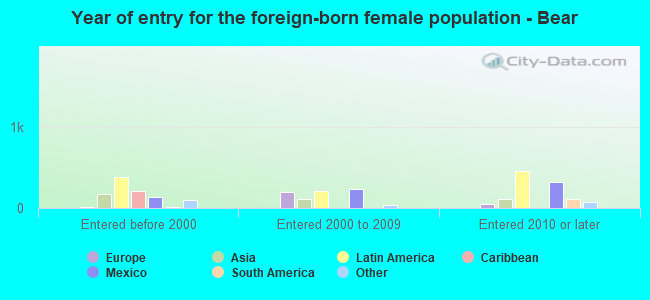
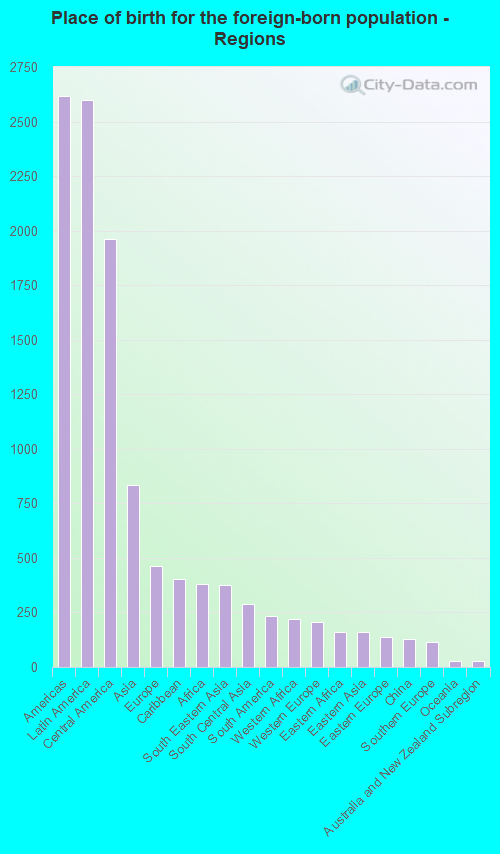
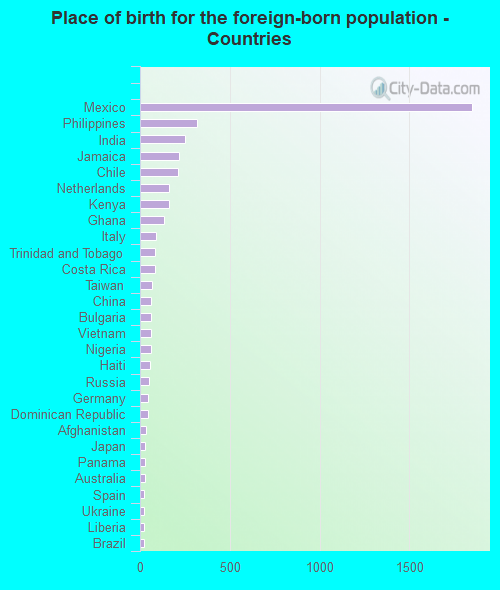
According to 2022 data, the most numerous races in Bear, DE are White alone (6,950 residents), Black alone (8,929 residents), and Hispanic (5,636 residents). 74.2% of Bear residents speak English at home. 18.6% of Bear, DE residents are foreign-born (11.1% born in Latin America, 3.5% born in Asia, 2.0% born in Europe), which is 51.6% greater than the foreign-born rate of 9.0% across the entire state of Delaware.
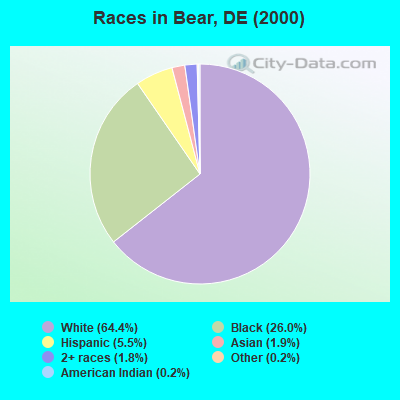
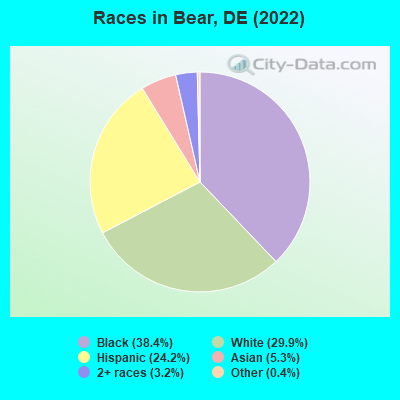
Race distribution in Bear
2000 2022
567,973 72.5% White alone 148,435 18.9% Black alone 37,277 4.8% Hispanic 16,110 2.1% Asian alone 10,222 1.3% Two or more races 2,324 0.3% American Indian alone 1,025 0.1% Other race alone 234 0.03% Native Hawaiian and Other
599,347 58.9% White alone 220,010 21.6% Black alone 105,300 10.3% Hispanic 46,016 4.5% Two or more races 41,350 4.1% Asian alone 5,097 0.5% Other race alone 1,276 0.1% American Indian alone
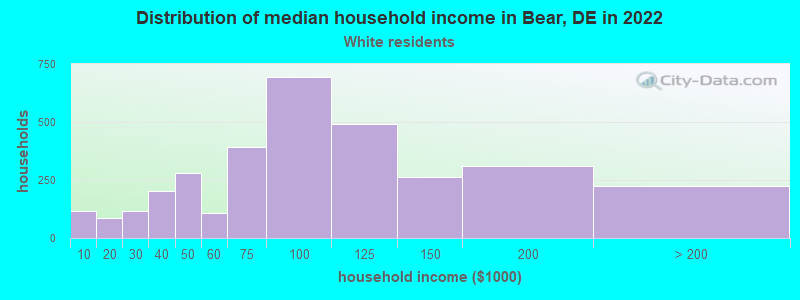
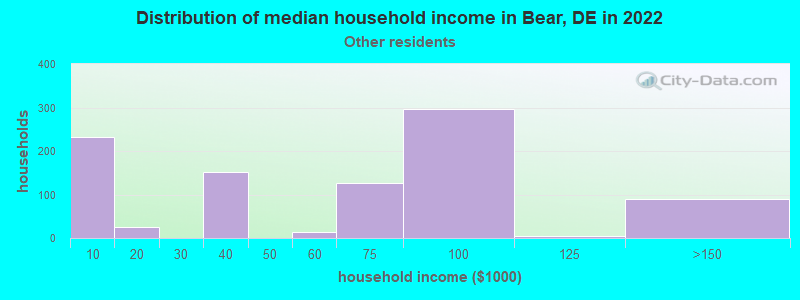
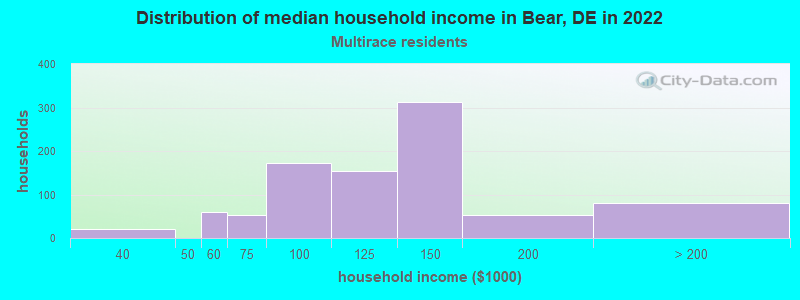
Income and house value in Bear Median household income in 2022 $83,994 White non-Hispanic householders$81,115 Black householders$76,441 Asian householders$78,764 Some other race householders$119,841 Two or more races householders$85,256 Hispanic or Latino race householdersMedian 2022 house value $348,318 White Non-Hispanic householders$314,246 Black or African American householders$294,852 American Indian or Alaska Native householders $412,792 Asian householders$240,337 Some other race householders$247,413 Two or more races householders$278,078 Hispanic or Latino householders
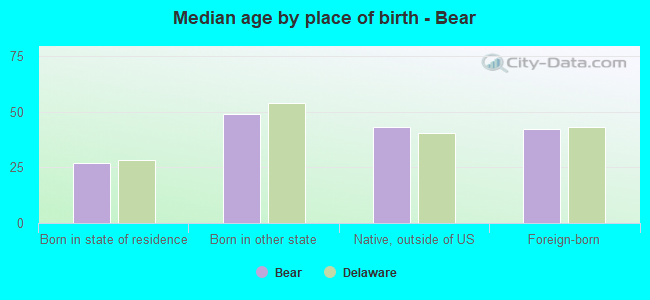
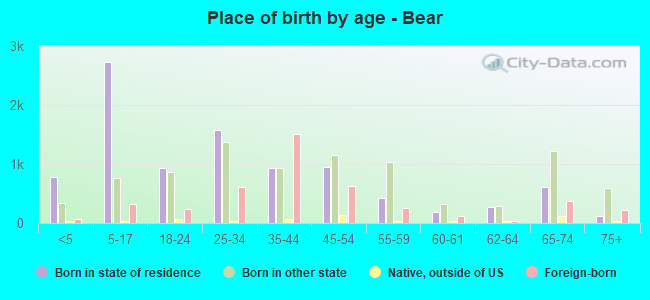
Median age by race in Bear
41.4 Median age for White residents40.8 43.5 34.6 Median age for Black or African American residents32.4 39.7 -592,964,823.5 Median age for American Indian / Alaska Native residents-639,393,938.8 -659,673,659.0 39.6 Median age for Asian residents38.5 49.3 -666,666,666.0 Median age for Native Hawaiian / Pacific Islander residents-668,724,279.2 -670,599,802.7 36.8 Median age for Other race residents40.1 25.1 29.6 Median age for Two or more races residents36.5 32.7 45.7 Median age for White alone residents41.9 50.2 30.2 Median age for Hispanic or Latino residents35.0 23.9
Owner/renter occupied households by race in Bear
House owners and renters - White residents 2,697 81.8% Owner occupied599 18.2% Renter occupiedHouse owners and renters - Black or African American residents 1,896 54.0% Owner occupied1,617 46.0% Renter occupiedHouse owners and renters - Asian residents 118 30.7% Owner occupied265 69.3% Renter occupiedHouse owners and renters - Other race residents 455 55.9% Owner occupied360 44.1% Renter occupiedHouse owners and renters - Two or more races residents 717 78.4% Owner occupied198 21.6% Renter occupiedHouse owners and renters - White alone residents 2,626 83.7% Owner occupied513 16.3% Renter occupiedHouse owners and renters - Hispanic or Latino residents 827 54.4% Owner occupied693 45.6% Renter occupied
Language usage in Bear
English speakers - Total 74.2% of residents of Bear speak English at home.
17.3% of residents speak Spanish at home 2,255 58.9% Speak English very well1,571 41.1% Speak English less than very well7.9% of residents speak other language at home 1,343 76.9% Speak English very well404 23.1% Speak English less than very well
English speakers - Born in the United States 90.6% of residents of Bear speak English at home.
6.8% of residents speak Spanish at home 412 70.7% Speak English very well171 29.3% Speak English less than very well2.4% of residents speak other language at home 210 100.0% Speak English very well
English speakers - Native, born elsewhere 25.8% of residents of Bear speak English at home.
69.0% of residents speak Spanish at home 206 59.2% Speak English very well142 40.8% Speak English less than very well1.4% of residents speak other language at home 7 100.0% Speak English very well
English speakers - Foreign-born 16.9% of residents of Bear speak English at home.
48.3% of residents speak Spanish at home 902 43.4% Speak English very well1,174 56.6% Speak English less than very well31.9% of residents speak other language at home 989 72.2% Speak English very well381 27.8% Speak English less than very well
White (Caucasian) - Speak only English Native:
96.6% (6,785)Foreign-born:
31.0% (134)
White (Caucasian) - Speak another language Native:
2.7% (190)Foreign-born:
67.2% (290)
Black or African American - Speak only English Native:
96.5% (7,752)Foreign-born:
44.0% (357)
Black or African American - Speak another language Native:
3.4% (271)Foreign-born:
55.8% (453)
Asian - Speak another language Native:
28.6% (90)Foreign-born:
94.7% (796)
Other race - Speak only English Native:
18.3% (253)Foreign-born:
11.6% (173)
Other race - Speak another language Native:
77.7% (1,077)Foreign-born:
85.4% (1,276)
Two or more races - Speak only English Native:
57.1% (874)Foreign-born:
4.1% (48)
Two or more races - Speak another language Native:
49.7% (761)Foreign-born:
94.9% (1,118)
White alone - Speak only English Native:
98.2% (6,368)Foreign-born:
45.6% (147)
White alone - Speak another language Native:
1.7% (111)Foreign-born:
54.7% (175)
Hispanic or Latino - Speak only English Native:
35.9% (1,021)Foreign-born:
5.2% (117)
Hispanic or Latino - Speak another language Native:
63.5% (1,808)Foreign-born:
91.2% (2,066)
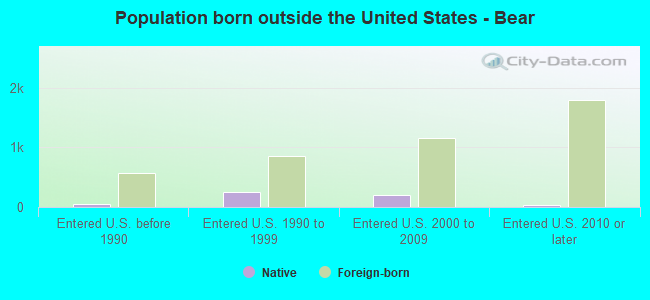
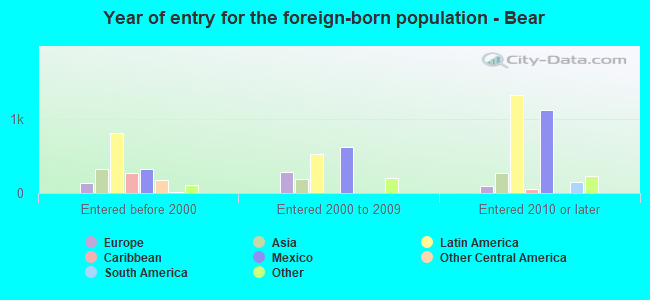
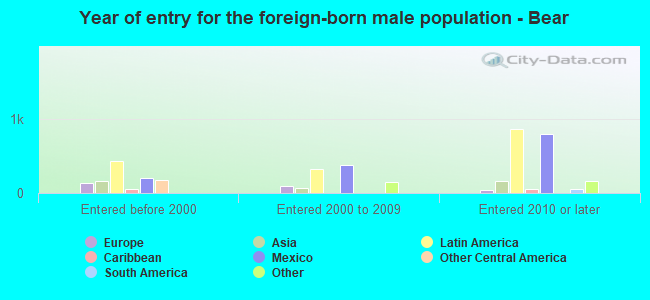
Foreign-born residents in Bear 4,323 residents are foreign born (11.1% Latin America , 3.5% Asia , 2.0% Europe ).
This city:
18.6%Delaware:
9.8%
Marital status for residents in Bear Marital status - White (Caucasian) population 15 years and over
Males 39.1% Never married43.9% Now married1.1% Separated5.8% Widowed10.1% DivorcedFemales 33.2% Never married41.8% Now married0.4% Separated9.9% Widowed14.6% DivorcedWomen who gave birth in the past 12 months Now married:
87.4% (69)Unmarried:
12.6% (10)
Women who did not give birth in the past 12 months Now married:
34.2% (541)Unmarried:
65.8% (1,040)
Marital status - Black or African American population 15 years and over
Males 49.8% Never married31.5% Now married1.4% Separated2.1% Widowed15.2% DivorcedFemales 44.2% Never married25.6% Now married2.7% Separated8.8% Widowed18.6% DivorcedWomen who gave birth in the past 12 months Now married:
100.0% (37)Unmarried:
0.0% (0)
Women who did not give birth in the past 12 months Now married:
23.3% (561)Unmarried:
76.7% (1,847)
Marital status - Asian population 15 years and over
Males 43.8% Never married40.7% Now married0.0% Separated10.4% Widowed5.0% DivorcedFemales 17.8% Never married55.1% Now married0.0% Separated13.5% Widowed13.5% DivorcedWomen who gave birth in the past 12 months Now married:
100.0% (9)Unmarried:
0.0% (0)
Women who did not give birth in the past 12 months Now married:
69.3% (136)Unmarried:
30.7% (60)
Marital status - Other race population 15 years and over
Males 47.9% Never married40.7% Now married11.2% Separated0.0% Widowed0.2% DivorcedFemales 60.9% Never married34.7% Now married0.0% Separated0.0% Widowed4.4% DivorcedWomen who gave birth in the past 12 months Now married:
100.0% (71)Unmarried:
0.0% (0)
Women who did not give birth in the past 12 months Now married:
22.4% (229)Unmarried:
77.6% (792)
Marital status - Two or more races population 15 years and over
Males 32.8% Never married59.7% Now married0.0% Separated0.0% Widowed7.4% DivorcedFemales 39.3% Never married37.8% Now married8.0% Separated2.0% Widowed12.9% DivorcedWomen who did not give birth in the past 12 months Now married:
50.9% (445)Unmarried:
49.1% (428)
Marital status - White alone, not Hispanic / Latino population 15 years and over
Males 39.7% Never married40.4% Now married1.3% Separated6.8% Widowed11.8% DivorcedFemales 33.2% Never married40.1% Now married0.5% Separated10.6% Widowed15.6% DivorcedWomen who gave birth in the past 12 months Now married:
85.5% (63)Unmarried:
14.5% (11)
Women who did not give birth in the past 12 months Now married:
29.8% (440)Unmarried:
70.2% (1,033)
Marital status - Hispanic or Latino population 15 years and over
Males 43.0% Never married47.7% Now married5.8% Separated0.0% Widowed3.5% DivorcedFemales 54.5% Never married37.4% Now married5.0% Separated0.0% Widowed3.1% DivorcedWomen who gave birth in the past 12 months Now married:
100.0% (70)Unmarried:
0.0% (0)
Women who did not give birth in the past 12 months Now married:
39.8% (665)Unmarried:
60.2% (1,005)
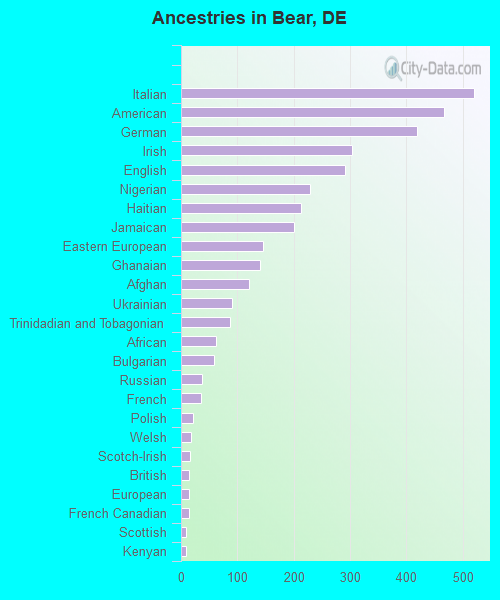
Ancestries in Bear
521 4.5% Italian468 4.1% American420 3.7% German304 2.7% Irish292 2.5% English229 2.0% Nigerian213 1.9% Haitian200 1.7% Jamaican145 1.3% Eastern European140 1.2% Ghanaian121 1.1% Afghan91 0.8% Ukrainian87 0.8% Trinidadian and Tobagonian62 0.5% African59 0.5% Bulgarian37 0.3% Russian36 0.3% French21 0.2% Polish18 0.2% Welsh16 0.1% Scotch-Irish14 0.1% British14 0.1% European14 0.1% French Canadian9 0.08% Scottish8 0.07% Kenyan7 0.06% Pennsylvania German
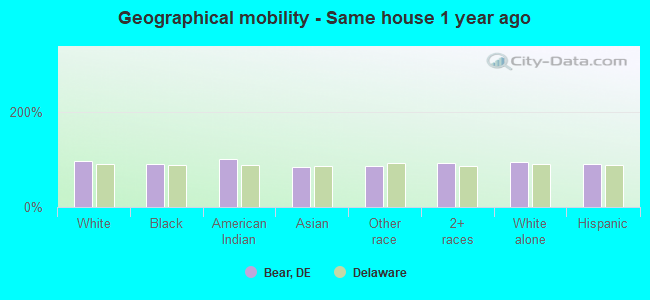
Geographical mobility in Bear Same house 1 year ago 7,344 95.8% White (Caucasian)8,347 91.5% Black or African American1 100.0% American Indian / Alaska Native1,016 83.3% Asian2,758 86.4% Other race2,682 93.2% Two or more races6,529 95.1% White alone, not Hispanic / Latino5,022 89.9% Hispanic or LatinoMoved within same county 127 1.7% White / Caucasian217 2.4% Black or African American32 2.7% Asian358 11.2% Other race90 3.1% Two or more races120 1.8% White alone, not Hispanic / Latino401 7.2% Hispanic or LatinoMoved within same state 59 0.8% White / Caucasian17 0.2% Black or African American51 0.7% White alone, not Hispanic / LatinoMoved from different state 141 1.8% White / Caucasian582 6.4% Black or African American110 9.0% Asian50 1.6% Other race97 3.4% Two or more races144 2.1% White alone, not Hispanic / Latino115 2.1% Hispanic or LatinoMoved from abroad 74 0.8% Black or African American110 9.0% Asian95 3.0% Other race51 0.9% Hispanic or Latino
Children Nativity (place of birth) in Bear
Children under 6 years - Living with two parents Both parents native 467 100.0% NativeBoth parents foreign-born 214 60.8% Native138 39.2% Foreign-bornOne native, one foreign-born parent 85 100.0% NativeChildren under 6 years - Living with one parent Native parent 472 100.0% NativeForeign-born parent 81 43.0% Native108 57.0% Foreign-bornChildren 6 to 17 years - Living with two parents Both parents native 1,014 100.0% NativeBoth parents foreign-born 620 82.0% Native136 18.0% Foreign-bornOne native, one foreign-born parent 32 100.0% NativeChildren 6 to 17 years - Living with one parent Native parent 1,171 100.0% NativeForeign-born parent 351 57.4% Native260 42.6% Foreign-born
Grandparents responsible for own grandchildren in Bear
Grandparents (30 to 59 years) White / Caucasian 45 100.0% Not responsible for grandchildrenBlack or African American 221 68.1% Responsible for grandchildren103 31.9% Not responsible for grandchildrenOther race 106 100.0% Not responsible for grandchildrenWhite alone, not Hispanic / Latino 37 100.0% Not responsible for grandchildrenHispanic or Latino 81 100.0% Not responsible for grandchildrenGrandparents (60 years and over) White / Caucasian 23 23.8% Responsible for grandchildren75 76.2% Not responsible for grandchildrenBlack or African American 116 100.0% Not responsible for grandchildrenOther race 143 100.0% Not responsible for grandchildrenWhite alone, not Hispanic / Latino 25 30.4% Responsible for grandchildren56 69.6% Not responsible for grandchildrenHispanic or Latino 117 100.0% Not responsible for grandchildren