Races in Bean Station, Tennessee (TN) Detailed Stats
Ancestries, Foreign-born residents, place of birth

Data:
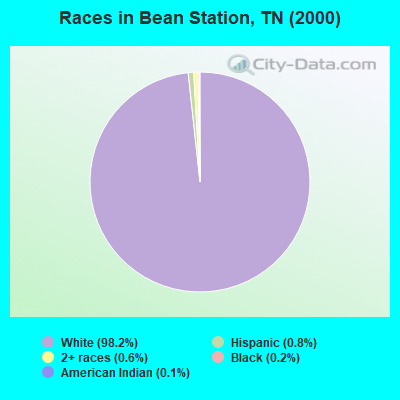
Race distribution in Bean Station

- 7,03998.2%White alone
- 570.8%Hispanic
- 400.6%Two or more races
- 140.2%Black alone
- 70.10%Asian alone
- 100.1%American Indian alone
- 30.04%Native Hawaiian and Other
Pacific Islander alone
- 10.01%Other race alone
2000
2022
-
- 4,505,93079.2%White alone
- 928,20416.3%Black alone
- 123,8382.2%Hispanic
- 54,8241.0%Two or more races
- 56,0771.0%Asian alone
- 13,8200.2%American Indian alone
- 4,7800.08%Other race alone
- 1,8100.03%Native Hawaiian and Other
Pacific Islander alone
-
- 5,070,02671.9%White alone
- 1,089,73815.5%Black alone
- 442,6296.3%Hispanic
- 279,3814.0%Two or more races
- 131,8171.9%Asian alone
- 26,9720.4%Other race alone
- 6,3870.09%American Indian alone
- 4,3890.06%Native Hawaiian and Other
Pacific Islander alone
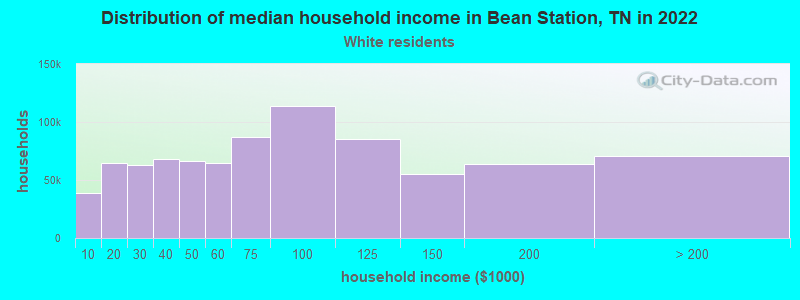
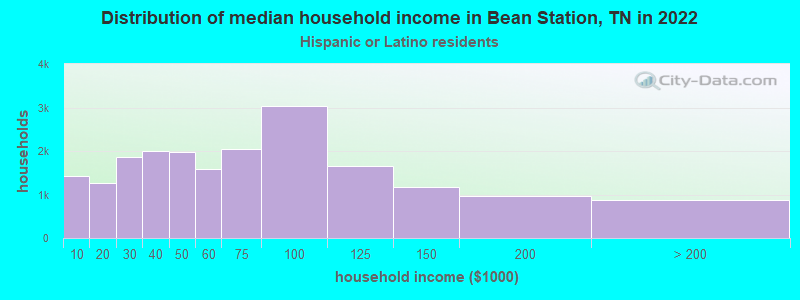
Income and house value in Bean Station
- Median household income in 2022
- $52,682White non-Hispanic householders
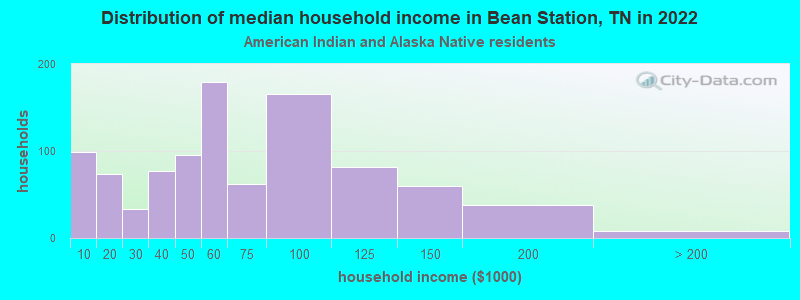
- $11,064American Indian and Alaska Native householders
- $19,375Some other race householders
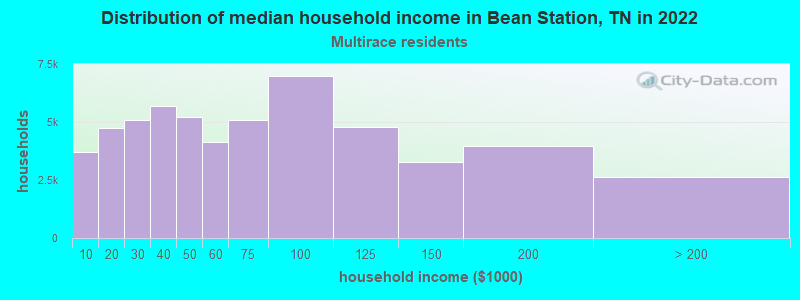
- $43,488Two or more races householders
- $25,660Hispanic or Latino race householders
- Median 2022 house value
- $216,832White Non-Hispanic householders
- $156,506Some other race householders
- $156,506Hispanic or Latino householders