Races in Bayou Blue, Louisiana (LA) Detailed Stats
Data:
Races - White alone (%)
Races - White alone (% change since 2000)
Races - Black alone (%)
Races - Black alone (% change since 2000)
Races - American Indian alone (%)
Races - American Indian alone (% change since 2000)
Races - Asian alone (%)
Races - Asian alone (% change since 2000)
Races - Hispanic (%)
Races - Hispanic (% change since 2000)
Races - Native Hawaiian and Other Pacific Islander alone (%)
Races - Native Hawaiian and Other Pacific Islander alone (% change since 2000)
Races - Two or more races(%)
Races - Two or more races(% change since 2000)
Races - Other race alone (%)
Races - Other race alone (% change since 2000)
Racial diversity
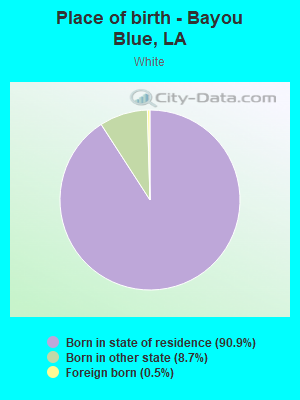
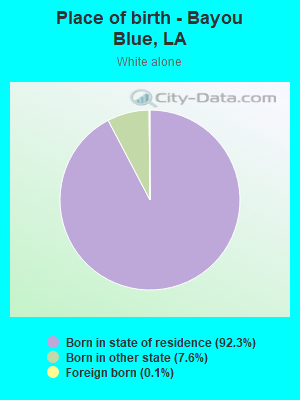
Place of birth - Born in state of residence (%)
Place of birth - Born in state of residence (%) - White
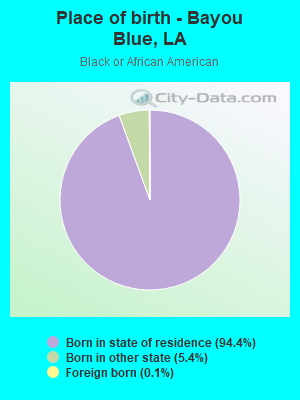
Place of birth - Born in state of residence (%) - Black or African American
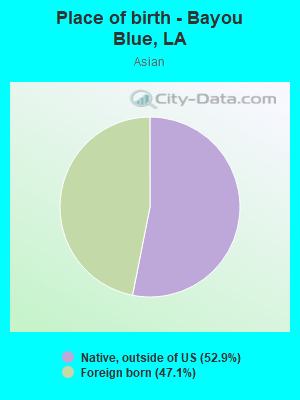
Place of birth - Born in state of residence (%) - Asian
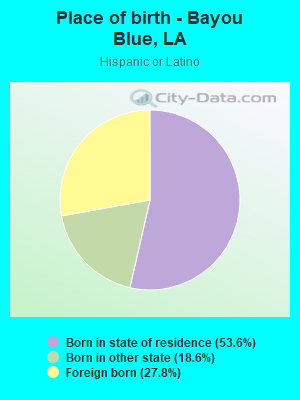
Place of birth - Born in state of residence (%) - Hispanic or Latino
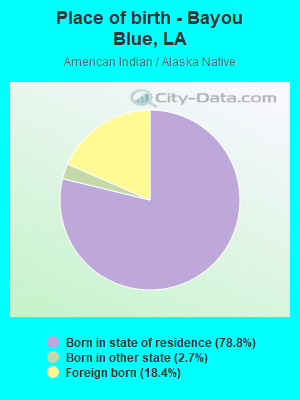
Place of birth - Born in state of residence (%) - American Indian and Alaska Native
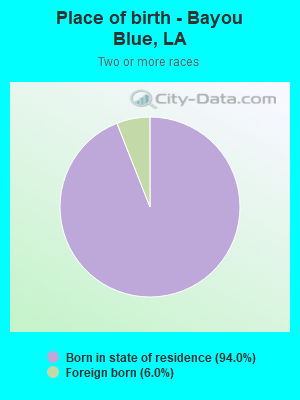
Place of birth - Born in state of residence (%) - Multirace
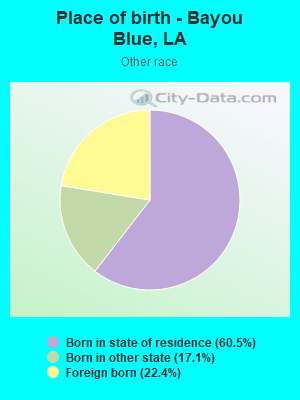
Place of birth - Born in state of residence (%) - Other Race
Place of birth - Born in other state (%)
Place of birth - Born in other state (%) - White
Place of birth - Born in other state (%) - Black or African American
Place of birth - Born in other state (%) - Asian
Place of birth - Born in other state (%) - Hispanic or Latino
Place of birth - Born in other state (%) - American Indian and Alaska Native
Place of birth - Born in other state (%) - Multirace
Place of birth - Born in other state (%) - Other Race
Place of birth - Native, outside of US (%)
Place of birth - Native, outside of US (%) - White
Place of birth - Native, outside of US (%) - Black or African American
Place of birth - Native, outside of US (%) - Asian
Place of birth - Native, outside of US (%) - Hispanic or Latino
Place of birth - Native, outside of US (%) - American Indian and Alaska Native
Place of birth - Native, outside of US (%) - Multirace
Place of birth - Native, outside of US (%) - Other Race
Place of birth - Foreign born (%)
Place of birth - Foreign born (%) - White
Place of birth - Foreign born (%) - Black or African American
Place of birth - Foreign born (%) - Asian
Place of birth - Foreign born (%) - Hispanic or Latino
Place of birth - Foreign born (%) - American Indian and Alaska Native
Place of birth - Foreign born (%) - Multirace
Place of birth - Foreign born (%) - Other Race
Residents speaking English at home (%)
Residents speaking English at home - Born in the United States (%)
Residents speaking English at home - Native, born elsewhere (%)
Residents speaking English at home - Foreign born (%)
Residents speaking Spanish at home (%)
Residents speaking Spanish at home - Born in the United States (%)
Residents speaking Spanish at home - Native, born elsewhere (%)
Residents speaking Spanish at home - Foreign born (%)
Residents speaking other language at home (%)
Residents speaking other language at home - Born in the United States (%)
Residents speaking other language at home - Native, born elsewhere (%)
Residents speaking other language at home - Foreign born (%)
Marital status - Never married (%)
Marital status - Now married (%)
Marital status - Separated (%)
Marital status - Widowed (%)
Marital status - Divorced (%)
Ancestries Reported - Arab (%)
Ancestries Reported - Czech (%)
Ancestries Reported - Danish (%)
Ancestries Reported - Dutch (%)
Ancestries Reported - English (%)
Ancestries Reported - French (%)
Ancestries Reported - French Canadian (%)
Ancestries Reported - German (%)
Ancestries Reported - Greek (%)
Ancestries Reported - Hungarian (%)
Ancestries Reported - Irish (%)
Ancestries Reported - Italian (%)
Ancestries Reported - Lithuanian (%)
Ancestries Reported - Norwegian (%)
Ancestries Reported - Polish (%)
Ancestries Reported - Portuguese (%)
Ancestries Reported - Russian (%)
Ancestries Reported - Scotch-Irish (%)
Ancestries Reported - Scottish (%)
Ancestries Reported - Slovak (%)
Ancestries Reported - Subsaharan African (%)
Ancestries Reported - Swedish (%)
Ancestries Reported - Swiss (%)
Ancestries Reported - Ukrainian (%)
Ancestries Reported - United States (%)
Ancestries Reported - Welsh (%)
Ancestries Reported - West Indian (%)
Ancestries Reported - Other (%)
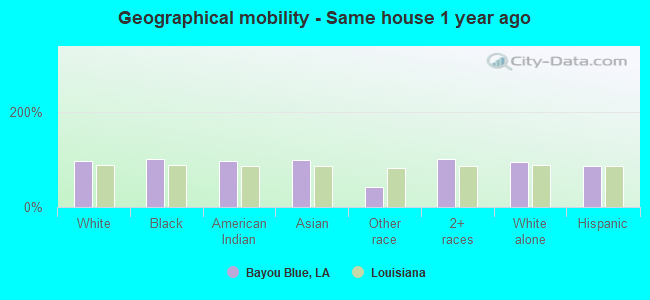
Geographical mobility - Same house 1 year ago (%)
Geographical mobility - Same house 1 year ago (%) - White
Geographical mobility - Same house 1 year ago (%) - Black or African American
Geographical mobility - Same house 1 year ago (%) - Asian
Geographical mobility - Same house 1 year ago (%) - Hispanic or Latino
Geographical mobility - Same house 1 year ago (%) - American Indian and Alaska Native
Geographical mobility - Same house 1 year ago (%) - Multirace
Geographical mobility - Same house 1 year ago (%) - Other Race
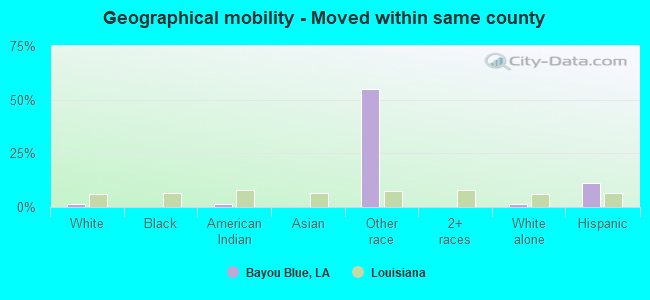
Geographical mobility - Moved within same county (%)
Geographical mobility - Moved within same county (%) - White
Geographical mobility - Moved within same county (%) - Black or African American
Geographical mobility - Moved within same county (%) - Asian
Geographical mobility - Moved within same county (%) - Hispanic or Latino
Geographical mobility - Moved within same county (%) - American Indian and Alaska Native
Geographical mobility - Moved within same county (%) - Multirace
Geographical mobility - Moved within same county (%) - Other Race
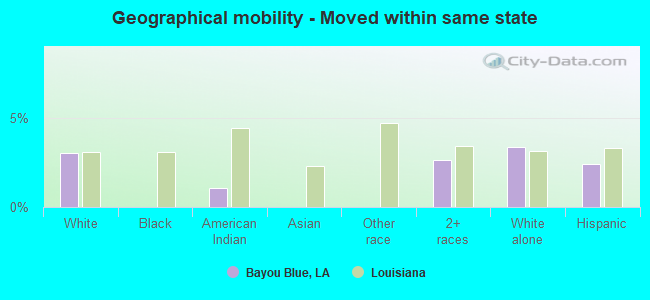
Geographical mobility - Moved from different county within same state (%)
Geographical mobility - Moved from different county within same state (%) - White
Geographical mobility - Moved from different county within same state (%) - Black or African American
Geographical mobility - Moved from different county within same state (%) - Asian
Geographical mobility - Moved from different county within same state (%) - Hispanic or Latino
Geographical mobility - Moved from different county within same state (%) - American Indian and Alaska Native
Geographical mobility - Moved from different county within same state (%) - Multirace
Geographical mobility - Moved from different county within same state (%) - Other Race
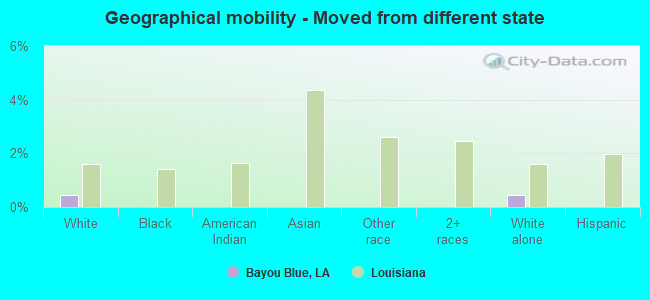
Geographical mobility - Moved from different state (%)
Geographical mobility - Moved from different state (%) - White
Geographical mobility - Moved from different state (%) - Black or African American
Geographical mobility - Moved from different state (%) - Asian
Geographical mobility - Moved from different state (%) - Hispanic or Latino
Geographical mobility - Moved from different state (%) - American Indian and Alaska Native
Geographical mobility - Moved from different state (%) - Multirace
Geographical mobility - Moved from different state (%) - Other Race
Geographical mobility - Moved from abroad (%)
Geographical mobility - Moved from abroad (%) - White
Geographical mobility - Moved from abroad (%) - Black or African American
Geographical mobility - Moved from abroad (%) - Asian
Geographical mobility - Moved from abroad (%) - Hispanic or Latino
Geographical mobility - Moved from abroad (%) - American Indian and Alaska Native
Geographical mobility - Moved from abroad (%) - Multirace
Geographical mobility - Moved from abroad (%) - Other Race
Place of birth for the foreign-born population - Ireland (%)
Place of birth for the foreign-born population - Denmark (%)
Place of birth for the foreign-born population - Norway (%)
Place of birth for the foreign-born population - Sweden (%)
Place of birth for the foreign-born population - United Kingdom (%)
Place of birth for the foreign-born population - England (%)
Place of birth for the foreign-born population - Scotland (%)
Place of birth for the foreign-born population - Other Northern Europe (%)
Place of birth for the foreign-born population - Austria (%)
Place of birth for the foreign-born population - Belgium (%)
Place of birth for the foreign-born population - France (%)
Place of birth for the foreign-born population - Germany (%)
Place of birth for the foreign-born population - Netherlands (%)
Place of birth for the foreign-born population - Switzerland (%)
Place of birth for the foreign-born population - Other Western Europe (%)
Place of birth for the foreign-born population - Greece (%)
Place of birth for the foreign-born population - Italy (%)
Place of birth for the foreign-born population - Portugal (%)
Place of birth for the foreign-born population - Spain (%)
Place of birth for the foreign-born population - Other Southern Europe (%)
Place of birth for the foreign-born population - Albania (%)
Place of birth for the foreign-born population - Belarus (%)
Place of birth for the foreign-born population - Bosnia and Herzegovina (%)
Place of birth for the foreign-born population - Bulgaria (%)
Place of birth for the foreign-born population - Croatia (%)
Place of birth for the foreign-born population - Czechoslovakia (%)
Place of birth for the foreign-born population - Hungary (%)
Place of birth for the foreign-born population - Latvia (%)
Place of birth for the foreign-born population - Lithuania (%)
Place of birth for the foreign-born population - North Macedonia (Macedonia) (%)
Place of birth for the foreign-born population - Moldova (%)
Place of birth for the foreign-born population - Poland (%)
Place of birth for the foreign-born population - Romania (%)
Place of birth for the foreign-born population - Russia (%)
Place of birth for the foreign-born population - Serbia (%)
Place of birth for the foreign-born population - Ukraine (%)
Place of birth for the foreign-born population - Other Eastern Europe (%)
Place of birth for the foreign-born population - China (%)
Place of birth for the foreign-born population - Hong Kong (%)
Place of birth for the foreign-born population - Taiwan (%)
Place of birth for the foreign-born population - Japan (%)
Place of birth for the foreign-born population - Korea (%)
Place of birth for the foreign-born population - Other Eastern Asia (%)
Place of birth for the foreign-born population - Afghanistan (%)
Place of birth for the foreign-born population - Bangladesh (%)
Place of birth for the foreign-born population - India (%)
Place of birth for the foreign-born population - Iran (%)
Place of birth for the foreign-born population - Kazakhstan (%)
Place of birth for the foreign-born population - Nepal (%)
Place of birth for the foreign-born population - Pakistan (%)
Place of birth for the foreign-born population - Sri Lanka (%)
Place of birth for the foreign-born population - Uzbekistan (%)
Place of birth for the foreign-born population - Other South Central Asia (%)
Place of birth for the foreign-born population - Burma (%)
Place of birth for the foreign-born population - Cambodia (%)
Place of birth for the foreign-born population - Indonesia (%)
Place of birth for the foreign-born population - Laos (%)
Place of birth for the foreign-born population - Malaysia (%)
Place of birth for the foreign-born population - Philippines (%)
Place of birth for the foreign-born population - Singapore (%)
Place of birth for the foreign-born population - Thailand (%)
Place of birth for the foreign-born population - Vietnam (%)
Place of birth for the foreign-born population - Other South Eastern Asia (%)
Place of birth for the foreign-born population - Armenia (%)
Place of birth for the foreign-born population - Iraq (%)
Place of birth for the foreign-born population - Israel (%)
Place of birth for the foreign-born population - Jordan (%)
Place of birth for the foreign-born population - Kuwait (%)
Place of birth for the foreign-born population - Lebanon (%)
Place of birth for the foreign-born population - Saudi Arabia (%)
Place of birth for the foreign-born population - Syria (%)
Place of birth for the foreign-born population - Turkey (%)
Place of birth for the foreign-born population - Yemen (%)
Place of birth for the foreign-born population - Other Western Asia (%)
Place of birth for the foreign-born population - Eritrea (%)
Place of birth for the foreign-born population - Ethiopia (%)
Place of birth for the foreign-born population - Kenya (%)
Place of birth for the foreign-born population - Somalia (%)
Place of birth for the foreign-born population - Uganda (%)
Place of birth for the foreign-born population - Zimbabwe (%)
Place of birth for the foreign-born population - Other Eastern Africa (%)
Place of birth for the foreign-born population - Cameroon (%)
Place of birth for the foreign-born population - Congo (%)
Place of birth for the foreign-born population - Democratic Republic of Congo (Zaire) (%)
Place of birth for the foreign-born population - Other Middle Africa (%)
Place of birth for the foreign-born population - Egypt (%)
Place of birth for the foreign-born population - Morocco (%)
Place of birth for the foreign-born population - Sudan (%)
Place of birth for the foreign-born population - Other Northern Africa (%)
Place of birth for the foreign-born population - South Africa (%)
Place of birth for the foreign-born population - Other Southern Africa (%)
Place of birth for the foreign-born population - Cabo Verde (%)
Place of birth for the foreign-born population - Ghana (%)
Place of birth for the foreign-born population - Liberia (%)
Place of birth for the foreign-born population - Nigeria (%)
Place of birth for the foreign-born population - Senegal (%)
Place of birth for the foreign-born population - Sierra Leone (%)
Place of birth for the foreign-born population - Other Western Africa (%)
Place of birth for the foreign-born population - Australia (%)
Place of birth for the foreign-born population - New Zealand (%)
Place of birth for the foreign-born population - Fiji (%)
Place of birth for the foreign-born population - Micronesia (%)
Place of birth for the foreign-born population - Bahamas (%)
Place of birth for the foreign-born population - Barbados (%)
Place of birth for the foreign-born population - Cuba (%)
Place of birth for the foreign-born population - Dominica (%)
Place of birth for the foreign-born population - Dominican Republic (%)
Place of birth for the foreign-born population - Grenada (%)
Place of birth for the foreign-born population - Haiti (%)
Place of birth for the foreign-born population - Jamaica (%)
Place of birth for the foreign-born population - St. Vincent and the Grenadines (%)
Place of birth for the foreign-born population - Trinidad and Tobago (%)
Place of birth for the foreign-born population - West Indies (%)
Place of birth for the foreign-born population - Other Caribbean (%)
Place of birth for the foreign-born population - Belize (%)
Place of birth for the foreign-born population - Costa Rica (%)
Place of birth for the foreign-born population - El Salvador (%)
Place of birth for the foreign-born population - Guatemala (%)
Place of birth for the foreign-born population - Honduras (%)
Place of birth for the foreign-born population - Mexico (%)
Place of birth for the foreign-born population - Nicaragua (%)
Place of birth for the foreign-born population - Panama (%)
Place of birth for the foreign-born population - Other Central America (%)
Place of birth for the foreign-born population - Argentina (%)
Place of birth for the foreign-born population - Bolivia (%)
Place of birth for the foreign-born population - Brazil (%)
Place of birth for the foreign-born population - Chile (%)
Place of birth for the foreign-born population - Colombia (%)
Place of birth for the foreign-born population - Ecuador (%)
Place of birth for the foreign-born population - Guyana (%)
Place of birth for the foreign-born population - Peru (%)
Place of birth for the foreign-born population - Uruguay (%)
Place of birth for the foreign-born population - Venezuela (%)
Place of birth for the foreign-born population - Other South America (%)
Place of birth for the foreign-born population - Canada (%)
Place of birth for the foreign-born population - Other Northern America (%)
Place of birth for the foreign-born population - Other (%)
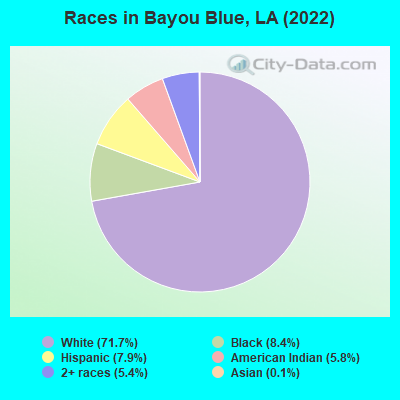
According to 2022 data, the most numerous races in Bayou Blue, LA are White alone (8,221 residents), Black alone (967 residents), and Hispanic (900 residents). 95.6% of Bayou Blue residents speak English at home.
Race distribution in Bayou Blue 8,221 71.7% White alone 967 8.4% Black alone 900 7.9% Hispanic 664 5.8% American Indian alone 619 5.4% Two or more races 13 0.1% Asian alone
2000 2022
2,794,391 62.5% White alone 1,443,390 32.3% Black alone 107,738 2.4% Hispanic 54,256 1.2% Asian alone 39,260 0.9% Two or more races 24,129 0.5% American Indian alone 4,736 0.1% Other race alone 1,076 0.02% Native Hawaiian and Other
2,603,221 56.7% White alone 1,420,055 30.9% Black alone 262,213 5.7% Hispanic 183,270 4.0% Two or more races 81,169 1.8% Asian alone 19,991 0.4% American Indian alone 18,043 0.4% Other race alone 2,279 0.05% Native Hawaiian and Other
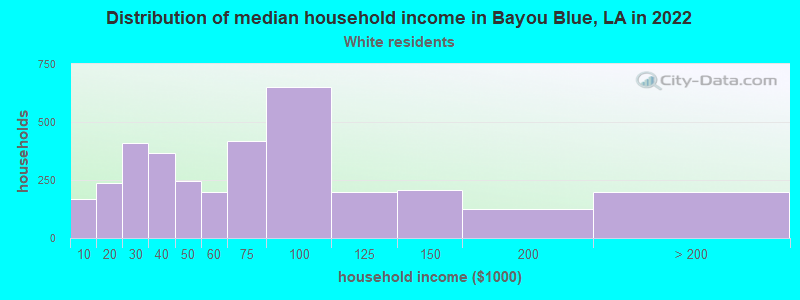
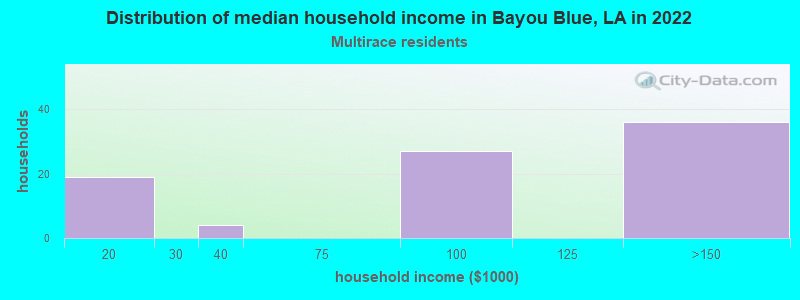
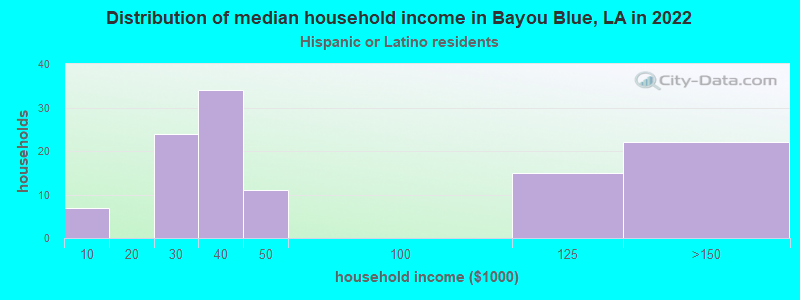
Income and house value in Bayou Blue Median household income in 2022 $62,109 White non-Hispanic householders$81,748 Two or more races householders
Median age by race in Bayou Blue
37.2 Median age for White residents36.6 38.1 43.6 Median age for Black or African American residents39.9 45.0 34.3 Median age for American Indian / Alaska Native residents47.6 28.7 -1,092,896,173.8 Median age for Asian residents-1,194,931,772.7 -854,814,814.0 -666,666,666.0 Median age for Native Hawaiian / Pacific Islander residents-666,666,666.0 -666,666,666.0 5.5 Median age for Other race residents4.5 -356,871,677.7 22.2 Median age for Two or more races residents14.9 34.7 38.9 Median age for White alone residents38.7 39.1 20.8 Median age for Hispanic or Latino residents16.9 8.3
Owner/renter occupied households by race in Bayou Blue
House owners and renters - White residents 3,066 89.9% Owner occupied343 10.1% Renter occupiedHouse owners and renters - Black or African American residents 387 100.0% Owner occupiedHouse owners and renters - American Indian / Alaska Native residents 146 39.0% Owner occupied228 61.0% Renter occupiedHouse owners and renters - Other race residents 31 100.0% Owner occupiedHouse owners and renters - Two or more races residents 43 47.8% Owner occupied47 52.2% Renter occupiedHouse owners and renters - White alone residents 3,055 90.2% Owner occupied330 9.8% Renter occupiedHouse owners and renters - Hispanic or Latino residents 60 65.4% Owner occupied32 34.6% Renter occupied
Language usage in Bayou Blue
English speakers - Total 95.6% of residents of Bayou Blue speak English at home.
2.7% of residents speak Spanish at home 138 47.9% Speak English very well150 52.1% Speak English less than very well2.3% of residents speak other language at home 221 86.7% Speak English very well34 13.3% Speak English less than very well
All residents speak only English at home
All residents speak only English at home
English speakers - Foreign-born 12.8% of residents of Bayou Blue speak English at home.
61.0% of residents speak Spanish at home 46 24.7% Speak English very well140 75.3% Speak English less than very well5.2% of residents speak other language at home 10 62.5% Speak English very well6 37.5% Speak English less than very well
White (Caucasian) - Speak another language Native:
1.9% (155)Foreign-born:
100.0% (40)
Black or African American - Speak only English Native:
90.5% (820)Foreign-born:
97.5% (1)
American Indian / Alaska Native - Speak another language Native:
18.7% (118)Foreign-born:
100.0% (157)
Other race - Speak only English Native:
100.0% (125)Foreign-born:
85.5% (38)
Two or more races - Speak another language Native:
4.9% (38)Foreign-born:
98.6% (45)
White alone - Speak another language Native:
1.8% (138)Foreign-born:
100.0% (12)
Hispanic or Latino - Speak only English Native:
79.0% (342)Foreign-born:
24.3% (63)
Hispanic or Latino - Speak another language Native:
15.3% (66)Foreign-born:
80.6% (208)
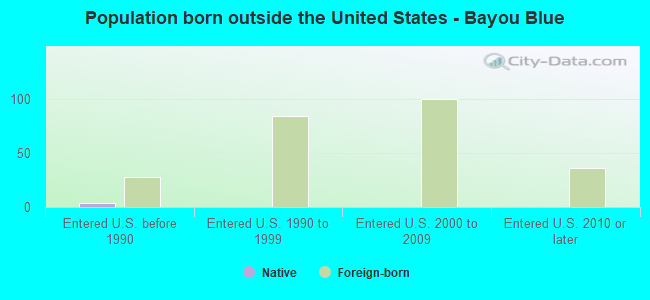
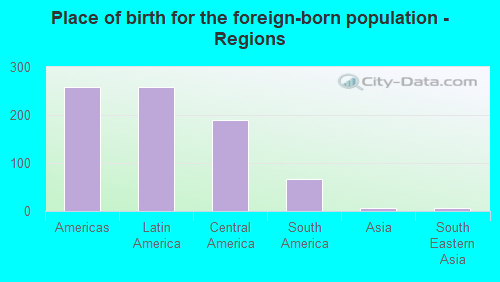
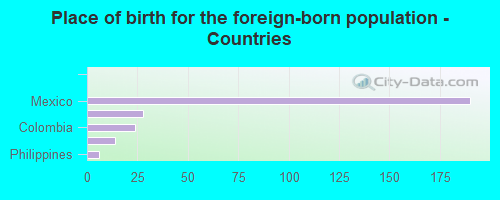
Foreign-born residents in Bayou Blue
Marital status for residents in Bayou Blue Marital status - White (Caucasian) population 15 years and over
Males 30.2% Never married58.4% Now married0.3% Separated6.3% Widowed4.7% DivorcedFemales 21.5% Never married56.5% Now married1.2% Separated7.0% Widowed13.8% DivorcedWomen who gave birth in the past 12 months Now married:
100.0% (133)Unmarried:
0.0% (0)
Women who did not give birth in the past 12 months Now married:
58.1% (995)Unmarried:
41.9% (718)
Marital status - Black or African American population 15 years and over
Males 58.0% Never married34.0% Now married0.0% Separated8.0% Widowed0.0% DivorcedFemales 53.0% Never married12.7% Now married0.0% Separated16.3% Widowed18.0% DivorcedWomen who did not give birth in the past 12 months Now married:
0.5% (1)Unmarried:
99.5% (213)
Marital status - American Indian / Alaska Native population 15 years and over
Males 21.8% Never married72.6% Now married0.0% Separated5.6% Widowed0.0% DivorcedFemales 53.4% Never married32.3% Now married0.0% Separated0.0% Widowed14.3% DivorcedWomen who gave birth in the past 12 months Now married:
25.0% (4)Unmarried:
75.0% (12)
Women who did not give birth in the past 12 months Now married:
29.9% (81)Unmarried:
70.1% (191)
Marital status - Other race population 15 years and over
Males 0.0% Never married100.0% Now married0.0% Separated0.0% Widowed0.0% DivorcedFemales 0.0% Never married100.0% Now married0.0% Separated0.0% Widowed0.0% DivorcedWomen who did not give birth in the past 12 months Now married:
100.0% (13)Unmarried:
0.0% (0)
Marital status - Two or more races population 15 years and over
Males 76.2% Never married2.9% Now married0.0% Separated21.0% Widowed0.0% DivorcedFemales 86.1% Never married10.5% Now married0.0% Separated3.4% Widowed0.0% DivorcedWomen who did not give birth in the past 12 months Now married:
4.6% (25)Unmarried:
95.4% (526)
Marital status - White alone, not Hispanic / Latino population 15 years and over
Males 31.8% Never married56.3% Now married0.4% Separated6.6% Widowed4.9% DivorcedFemales 21.8% Never married56.0% Now married1.0% Separated7.2% Widowed14.0% DivorcedWomen who gave birth in the past 12 months Now married:
100.0% (134)Unmarried:
0.0% (0)
Women who did not give birth in the past 12 months Now married:
57.2% (972)Unmarried:
42.8% (728)
Marital status - Hispanic or Latino population 15 years and over
Males 10.8% Never married82.8% Now married0.0% Separated6.4% Widowed0.0% DivorcedFemales 0.0% Never married93.1% Now married6.9% Separated0.0% Widowed0.0% DivorcedWomen who gave birth in the past 12 months Now married:
100.0% (5)Unmarried:
0.0% (0)
Women who did not give birth in the past 12 months Now married:
100.0% (50)Unmarried:
0.0% (0)
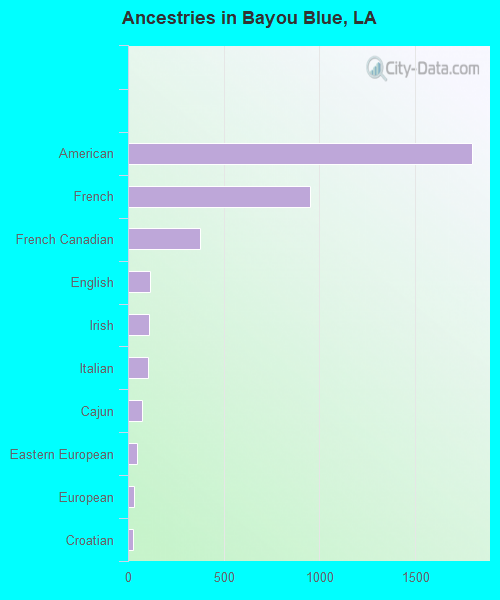
Ancestries in Bayou Blue
1,796 33.2% American952 17.6% French377 7.0% French Canadian114 2.1% English111 2.1% Irish107 2.0% Italian71 1.3% Cajun49 0.9% Eastern European31 0.6% European26 0.5% Croatian16 0.3% Scottish14 0.3% Portuguese11 0.2% Norwegian10 0.2% German7 0.1% Canadian6 0.1% Swiss
Children Nativity (place of birth) in Bayou Blue
Children under 6 years - Living with two parents Both parents native 711 100.0% NativeBoth parents foreign-born 96 100.0% NativeOne native, one foreign-born parent 10 100.0% NativeChildren under 6 years - Living with one parent Native parent 105 100.0% Native
Children 6 to 17 years - Living with two parents Both parents native 941 100.0% NativeBoth parents foreign-born 26 100.0% NativeOne native, one foreign-born parent 18 100.0% NativeChildren 6 to 17 years - Living with one parent Native parent 681 100.0% Native
Grandparents responsible for own grandchildren in Bayou Blue
Grandparents (30 to 59 years) White / Caucasian 22 36.8% Responsible for grandchildren38 63.2% Not responsible for grandchildrenBlack or African American 98 100.0% Responsible for grandchildrenAmerican Indian / Alaska Native 22 100.0% Not responsible for grandchildrenWhite alone, not Hispanic / Latino 23 37.4% Responsible for grandchildren38 62.6% Not responsible for grandchildrenGrandparents (60 years and over) White / Caucasian 63 37.3% Responsible for grandchildren106 62.7% Not responsible for grandchildrenBlack or African American 26 100.0% Not responsible for grandchildrenAmerican Indian / Alaska Native 4 5.6% Responsible for grandchildren66 94.4% Not responsible for grandchildrenWhite alone, not Hispanic / Latino 64 37.6% Responsible for grandchildren106 62.4% Not responsible for grandchildren