Races in Bay Shore, New York (NY) Detailed Stats
Data:
Races - White alone (%)
Races - White alone (% change since 2000)
Races - Black alone (%)
Races - Black alone (% change since 2000)
Races - American Indian alone (%)
Races - American Indian alone (% change since 2000)
Races - Asian alone (%)
Races - Asian alone (% change since 2000)
Races - Hispanic (%)
Races - Hispanic (% change since 2000)
Races - Native Hawaiian and Other Pacific Islander alone (%)
Races - Native Hawaiian and Other Pacific Islander alone (% change since 2000)
Races - Two or more races(%)
Races - Two or more races(% change since 2000)
Races - Other race alone (%)
Races - Other race alone (% change since 2000)
Racial diversity
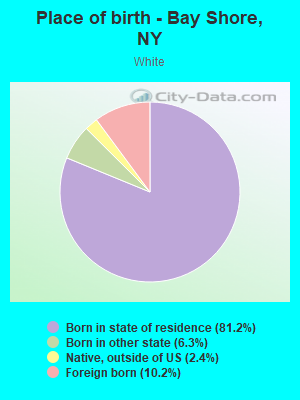
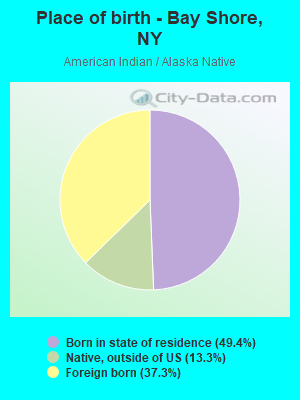
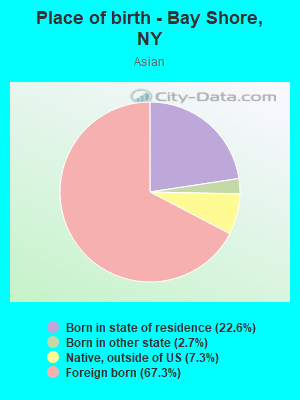
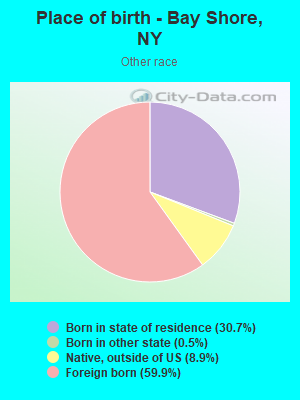
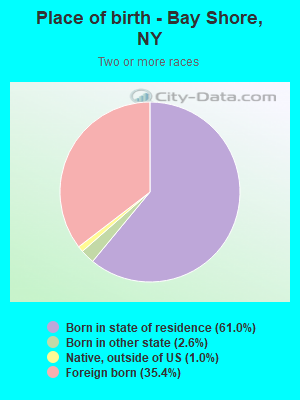
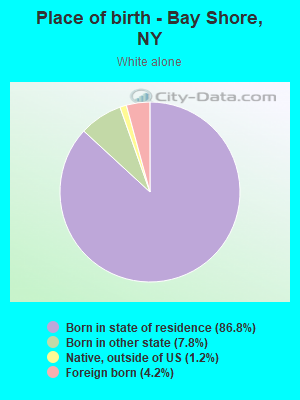
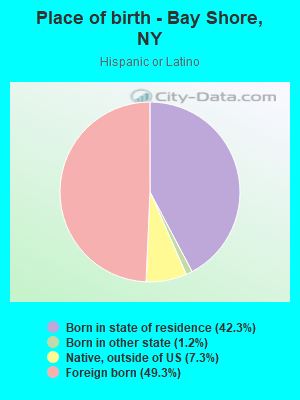
Place of birth - Born in state of residence (%)
Place of birth - Born in state of residence (%) - White
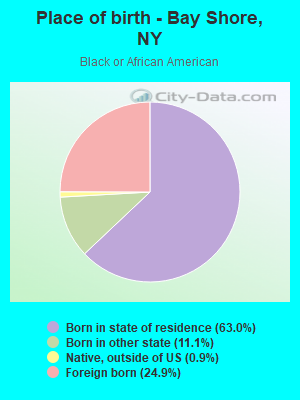
Place of birth - Born in state of residence (%) - Black or African American
Place of birth - Born in state of residence (%) - Asian
Place of birth - Born in state of residence (%) - Hispanic or Latino
Place of birth - Born in state of residence (%) - American Indian and Alaska Native
Place of birth - Born in state of residence (%) - Multirace
Place of birth - Born in state of residence (%) - Other Race
Place of birth - Born in other state (%)
Place of birth - Born in other state (%) - White
Place of birth - Born in other state (%) - Black or African American
Place of birth - Born in other state (%) - Asian
Place of birth - Born in other state (%) - Hispanic or Latino
Place of birth - Born in other state (%) - American Indian and Alaska Native
Place of birth - Born in other state (%) - Multirace
Place of birth - Born in other state (%) - Other Race
Place of birth - Native, outside of US (%)
Place of birth - Native, outside of US (%) - White
Place of birth - Native, outside of US (%) - Black or African American
Place of birth - Native, outside of US (%) - Asian
Place of birth - Native, outside of US (%) - Hispanic or Latino
Place of birth - Native, outside of US (%) - American Indian and Alaska Native
Place of birth - Native, outside of US (%) - Multirace
Place of birth - Native, outside of US (%) - Other Race
Place of birth - Foreign born (%)
Place of birth - Foreign born (%) - White
Place of birth - Foreign born (%) - Black or African American
Place of birth - Foreign born (%) - Asian
Place of birth - Foreign born (%) - Hispanic or Latino
Place of birth - Foreign born (%) - American Indian and Alaska Native
Place of birth - Foreign born (%) - Multirace
Place of birth - Foreign born (%) - Other Race
Residents speaking English at home (%)
Residents speaking English at home - Born in the United States (%)
Residents speaking English at home - Native, born elsewhere (%)
Residents speaking English at home - Foreign born (%)
Residents speaking Spanish at home (%)
Residents speaking Spanish at home - Born in the United States (%)
Residents speaking Spanish at home - Native, born elsewhere (%)
Residents speaking Spanish at home - Foreign born (%)
Residents speaking other language at home (%)
Residents speaking other language at home - Born in the United States (%)
Residents speaking other language at home - Native, born elsewhere (%)
Residents speaking other language at home - Foreign born (%)
Marital status - Never married (%)
Marital status - Now married (%)
Marital status - Separated (%)
Marital status - Widowed (%)
Marital status - Divorced (%)
Ancestries Reported - Arab (%)
Ancestries Reported - Czech (%)
Ancestries Reported - Danish (%)
Ancestries Reported - Dutch (%)
Ancestries Reported - English (%)
Ancestries Reported - French (%)
Ancestries Reported - French Canadian (%)
Ancestries Reported - German (%)
Ancestries Reported - Greek (%)
Ancestries Reported - Hungarian (%)
Ancestries Reported - Irish (%)
Ancestries Reported - Italian (%)
Ancestries Reported - Lithuanian (%)
Ancestries Reported - Norwegian (%)
Ancestries Reported - Polish (%)
Ancestries Reported - Portuguese (%)
Ancestries Reported - Russian (%)
Ancestries Reported - Scotch-Irish (%)
Ancestries Reported - Scottish (%)
Ancestries Reported - Slovak (%)
Ancestries Reported - Subsaharan African (%)
Ancestries Reported - Swedish (%)
Ancestries Reported - Swiss (%)
Ancestries Reported - Ukrainian (%)
Ancestries Reported - United States (%)
Ancestries Reported - Welsh (%)
Ancestries Reported - West Indian (%)
Ancestries Reported - Other (%)
Geographical mobility - Same house 1 year ago (%)
Geographical mobility - Same house 1 year ago (%) - White
Geographical mobility - Same house 1 year ago (%) - Black or African American
Geographical mobility - Same house 1 year ago (%) - Asian
Geographical mobility - Same house 1 year ago (%) - Hispanic or Latino
Geographical mobility - Same house 1 year ago (%) - American Indian and Alaska Native
Geographical mobility - Same house 1 year ago (%) - Multirace
Geographical mobility - Same house 1 year ago (%) - Other Race
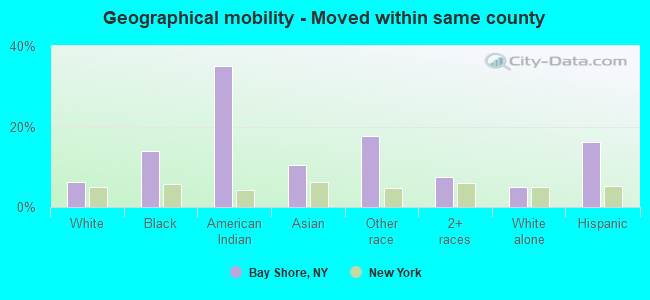
Geographical mobility - Moved within same county (%)
Geographical mobility - Moved within same county (%) - White
Geographical mobility - Moved within same county (%) - Black or African American
Geographical mobility - Moved within same county (%) - Asian
Geographical mobility - Moved within same county (%) - Hispanic or Latino
Geographical mobility - Moved within same county (%) - American Indian and Alaska Native
Geographical mobility - Moved within same county (%) - Multirace
Geographical mobility - Moved within same county (%) - Other Race
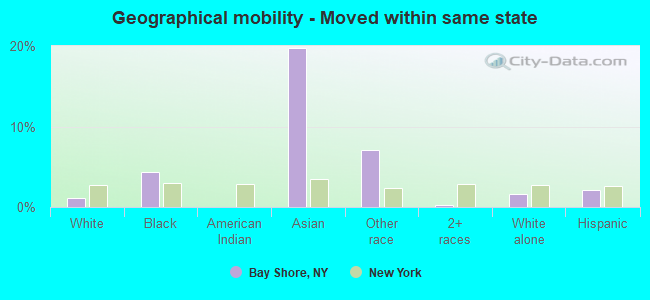
Geographical mobility - Moved from different county within same state (%)
Geographical mobility - Moved from different county within same state (%) - White
Geographical mobility - Moved from different county within same state (%) - Black or African American
Geographical mobility - Moved from different county within same state (%) - Asian
Geographical mobility - Moved from different county within same state (%) - Hispanic or Latino
Geographical mobility - Moved from different county within same state (%) - American Indian and Alaska Native
Geographical mobility - Moved from different county within same state (%) - Multirace
Geographical mobility - Moved from different county within same state (%) - Other Race
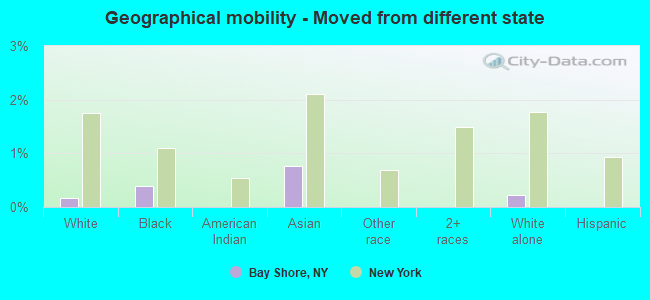
Geographical mobility - Moved from different state (%)
Geographical mobility - Moved from different state (%) - White
Geographical mobility - Moved from different state (%) - Black or African American
Geographical mobility - Moved from different state (%) - Asian
Geographical mobility - Moved from different state (%) - Hispanic or Latino
Geographical mobility - Moved from different state (%) - American Indian and Alaska Native
Geographical mobility - Moved from different state (%) - Multirace
Geographical mobility - Moved from different state (%) - Other Race
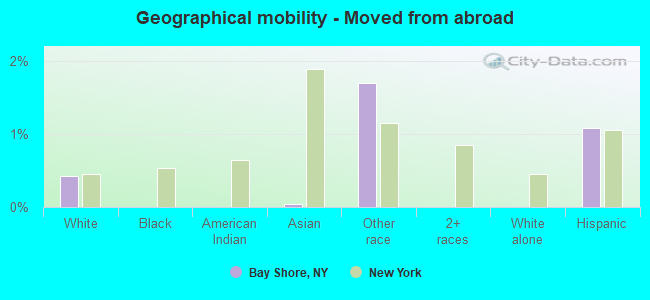
Geographical mobility - Moved from abroad (%)
Geographical mobility - Moved from abroad (%) - White
Geographical mobility - Moved from abroad (%) - Black or African American
Geographical mobility - Moved from abroad (%) - Asian
Geographical mobility - Moved from abroad (%) - Hispanic or Latino
Geographical mobility - Moved from abroad (%) - American Indian and Alaska Native
Geographical mobility - Moved from abroad (%) - Multirace
Geographical mobility - Moved from abroad (%) - Other Race
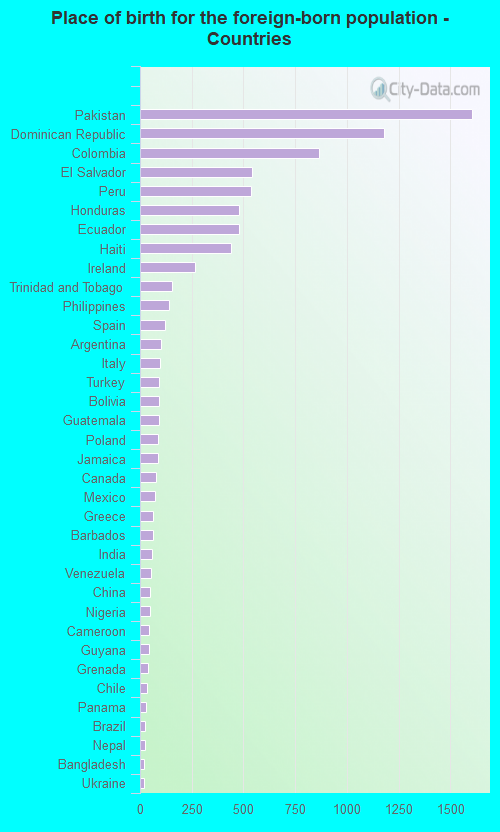
Place of birth for the foreign-born population - Ireland (%)
Place of birth for the foreign-born population - Denmark (%)
Place of birth for the foreign-born population - Norway (%)
Place of birth for the foreign-born population - Sweden (%)
Place of birth for the foreign-born population - United Kingdom (%)
Place of birth for the foreign-born population - England (%)
Place of birth for the foreign-born population - Scotland (%)
Place of birth for the foreign-born population - Other Northern Europe (%)
Place of birth for the foreign-born population - Austria (%)
Place of birth for the foreign-born population - Belgium (%)
Place of birth for the foreign-born population - France (%)
Place of birth for the foreign-born population - Germany (%)
Place of birth for the foreign-born population - Netherlands (%)
Place of birth for the foreign-born population - Switzerland (%)
Place of birth for the foreign-born population - Other Western Europe (%)
Place of birth for the foreign-born population - Greece (%)
Place of birth for the foreign-born population - Italy (%)
Place of birth for the foreign-born population - Portugal (%)
Place of birth for the foreign-born population - Spain (%)
Place of birth for the foreign-born population - Other Southern Europe (%)
Place of birth for the foreign-born population - Albania (%)
Place of birth for the foreign-born population - Belarus (%)
Place of birth for the foreign-born population - Bosnia and Herzegovina (%)
Place of birth for the foreign-born population - Bulgaria (%)
Place of birth for the foreign-born population - Croatia (%)
Place of birth for the foreign-born population - Czechoslovakia (%)
Place of birth for the foreign-born population - Hungary (%)
Place of birth for the foreign-born population - Latvia (%)
Place of birth for the foreign-born population - Lithuania (%)
Place of birth for the foreign-born population - North Macedonia (Macedonia) (%)
Place of birth for the foreign-born population - Moldova (%)
Place of birth for the foreign-born population - Poland (%)
Place of birth for the foreign-born population - Romania (%)
Place of birth for the foreign-born population - Russia (%)
Place of birth for the foreign-born population - Serbia (%)
Place of birth for the foreign-born population - Ukraine (%)
Place of birth for the foreign-born population - Other Eastern Europe (%)
Place of birth for the foreign-born population - China (%)
Place of birth for the foreign-born population - Hong Kong (%)
Place of birth for the foreign-born population - Taiwan (%)
Place of birth for the foreign-born population - Japan (%)
Place of birth for the foreign-born population - Korea (%)
Place of birth for the foreign-born population - Other Eastern Asia (%)
Place of birth for the foreign-born population - Afghanistan (%)
Place of birth for the foreign-born population - Bangladesh (%)
Place of birth for the foreign-born population - India (%)
Place of birth for the foreign-born population - Iran (%)
Place of birth for the foreign-born population - Kazakhstan (%)
Place of birth for the foreign-born population - Nepal (%)
Place of birth for the foreign-born population - Pakistan (%)
Place of birth for the foreign-born population - Sri Lanka (%)
Place of birth for the foreign-born population - Uzbekistan (%)
Place of birth for the foreign-born population - Other South Central Asia (%)
Place of birth for the foreign-born population - Burma (%)
Place of birth for the foreign-born population - Cambodia (%)
Place of birth for the foreign-born population - Indonesia (%)
Place of birth for the foreign-born population - Laos (%)
Place of birth for the foreign-born population - Malaysia (%)
Place of birth for the foreign-born population - Philippines (%)
Place of birth for the foreign-born population - Singapore (%)
Place of birth for the foreign-born population - Thailand (%)
Place of birth for the foreign-born population - Vietnam (%)
Place of birth for the foreign-born population - Other South Eastern Asia (%)
Place of birth for the foreign-born population - Armenia (%)
Place of birth for the foreign-born population - Iraq (%)
Place of birth for the foreign-born population - Israel (%)
Place of birth for the foreign-born population - Jordan (%)
Place of birth for the foreign-born population - Kuwait (%)
Place of birth for the foreign-born population - Lebanon (%)
Place of birth for the foreign-born population - Saudi Arabia (%)
Place of birth for the foreign-born population - Syria (%)
Place of birth for the foreign-born population - Turkey (%)
Place of birth for the foreign-born population - Yemen (%)
Place of birth for the foreign-born population - Other Western Asia (%)
Place of birth for the foreign-born population - Eritrea (%)
Place of birth for the foreign-born population - Ethiopia (%)
Place of birth for the foreign-born population - Kenya (%)
Place of birth for the foreign-born population - Somalia (%)
Place of birth for the foreign-born population - Uganda (%)
Place of birth for the foreign-born population - Zimbabwe (%)
Place of birth for the foreign-born population - Other Eastern Africa (%)
Place of birth for the foreign-born population - Cameroon (%)
Place of birth for the foreign-born population - Congo (%)
Place of birth for the foreign-born population - Democratic Republic of Congo (Zaire) (%)
Place of birth for the foreign-born population - Other Middle Africa (%)
Place of birth for the foreign-born population - Egypt (%)
Place of birth for the foreign-born population - Morocco (%)
Place of birth for the foreign-born population - Sudan (%)
Place of birth for the foreign-born population - Other Northern Africa (%)
Place of birth for the foreign-born population - South Africa (%)
Place of birth for the foreign-born population - Other Southern Africa (%)
Place of birth for the foreign-born population - Cabo Verde (%)
Place of birth for the foreign-born population - Ghana (%)
Place of birth for the foreign-born population - Liberia (%)
Place of birth for the foreign-born population - Nigeria (%)
Place of birth for the foreign-born population - Senegal (%)
Place of birth for the foreign-born population - Sierra Leone (%)
Place of birth for the foreign-born population - Other Western Africa (%)
Place of birth for the foreign-born population - Australia (%)
Place of birth for the foreign-born population - New Zealand (%)
Place of birth for the foreign-born population - Fiji (%)
Place of birth for the foreign-born population - Micronesia (%)
Place of birth for the foreign-born population - Bahamas (%)
Place of birth for the foreign-born population - Barbados (%)
Place of birth for the foreign-born population - Cuba (%)
Place of birth for the foreign-born population - Dominica (%)
Place of birth for the foreign-born population - Dominican Republic (%)
Place of birth for the foreign-born population - Grenada (%)
Place of birth for the foreign-born population - Haiti (%)
Place of birth for the foreign-born population - Jamaica (%)
Place of birth for the foreign-born population - St. Vincent and the Grenadines (%)
Place of birth for the foreign-born population - Trinidad and Tobago (%)
Place of birth for the foreign-born population - West Indies (%)
Place of birth for the foreign-born population - Other Caribbean (%)
Place of birth for the foreign-born population - Belize (%)
Place of birth for the foreign-born population - Costa Rica (%)
Place of birth for the foreign-born population - El Salvador (%)
Place of birth for the foreign-born population - Guatemala (%)
Place of birth for the foreign-born population - Honduras (%)
Place of birth for the foreign-born population - Mexico (%)
Place of birth for the foreign-born population - Nicaragua (%)
Place of birth for the foreign-born population - Panama (%)
Place of birth for the foreign-born population - Other Central America (%)
Place of birth for the foreign-born population - Argentina (%)
Place of birth for the foreign-born population - Bolivia (%)
Place of birth for the foreign-born population - Brazil (%)
Place of birth for the foreign-born population - Chile (%)
Place of birth for the foreign-born population - Colombia (%)
Place of birth for the foreign-born population - Ecuador (%)
Place of birth for the foreign-born population - Guyana (%)
Place of birth for the foreign-born population - Peru (%)
Place of birth for the foreign-born population - Uruguay (%)
Place of birth for the foreign-born population - Venezuela (%)
Place of birth for the foreign-born population - Other South America (%)
Place of birth for the foreign-born population - Canada (%)
Place of birth for the foreign-born population - Other Northern America (%)
Place of birth for the foreign-born population - Other (%)
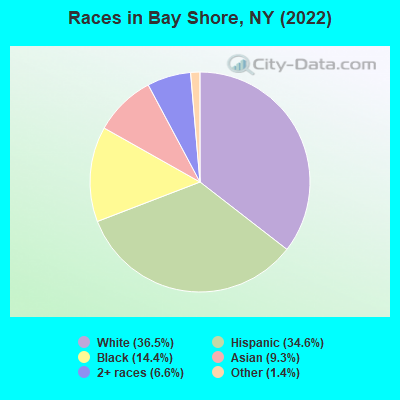
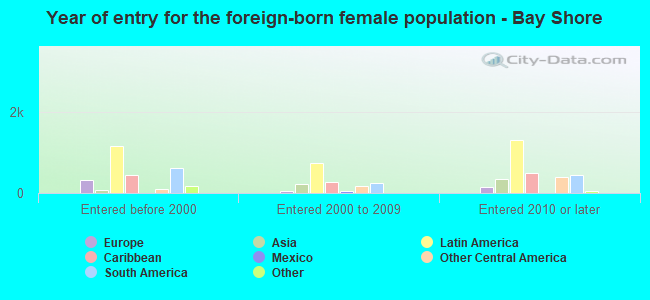
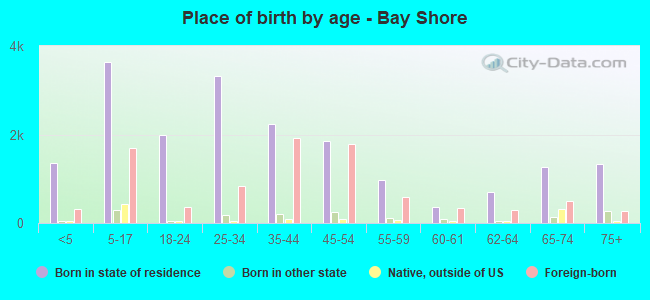
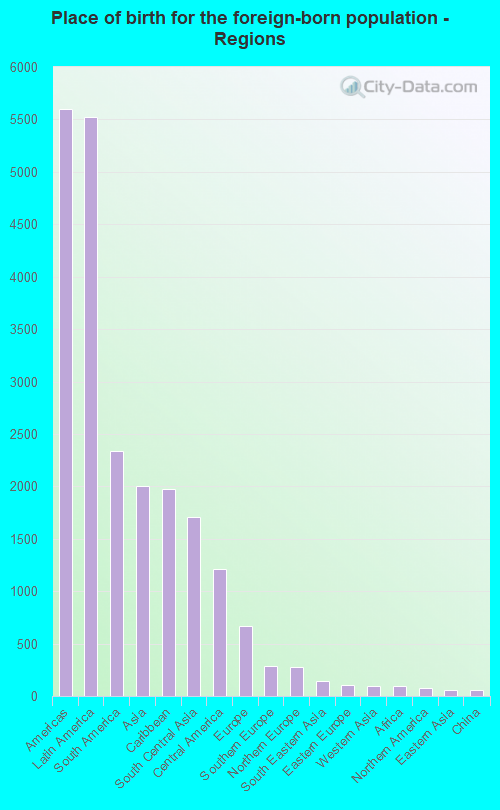
According to 2022 data, the most numerous races in Bay Shore, NY are White alone (11,160 residents), Hispanic (10,567 residents), and Black alone (4,412 residents). 62.3% of Bay Shore residents speak English at home. 27.4% of Bay Shore, NY residents are foreign-born (18.3% born in Latin America, 6.6% born in Asia), which is 19.6% greater than the foreign-born rate of 22.0% across the entire state of New York.
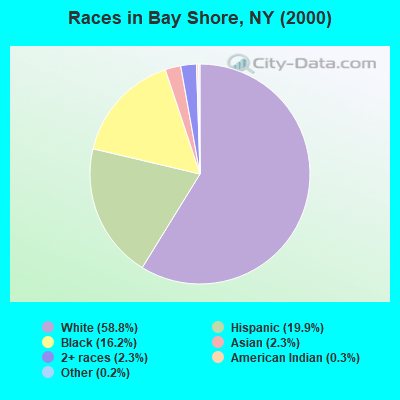
Race distribution in Bay Shore
2000 2022
11,760,981 62.0% White alone 2,867,583 15.1% Hispanic 2,812,623 14.8% Black alone 1,035,926 5.5% Asian alone 366,116 1.9% Two or more races 75,499 0.4% Other race alone 52,499 0.3% American Indian alone 5,230 0.03% Native Hawaiian and Other
10,408,933 52.9% White alone 3,867,299 19.7% Hispanic 2,633,840 13.4% Black alone 1,776,286 9.0% Asian alone 732,670 3.7% Two or more races 216,110 1.1% Other race alone 35,082 0.2% American Indian alone 6,931 0.04% Native Hawaiian and Other
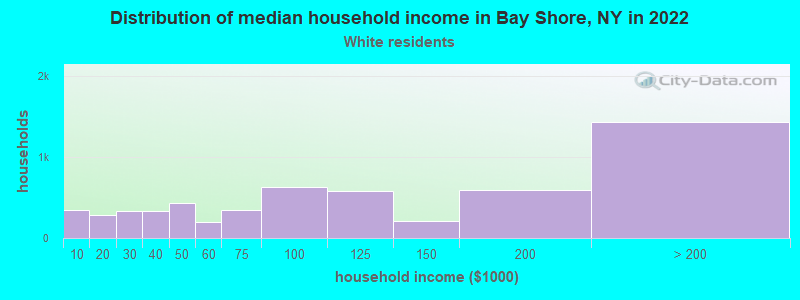
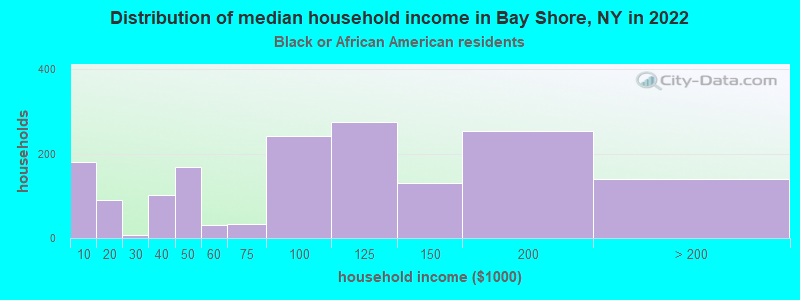
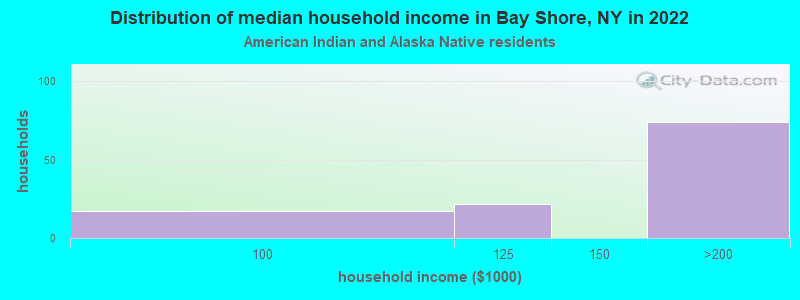
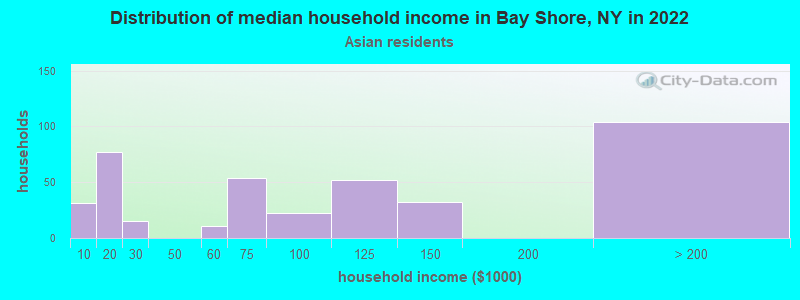
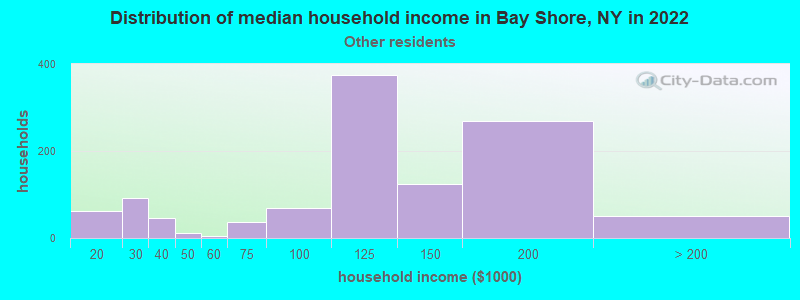
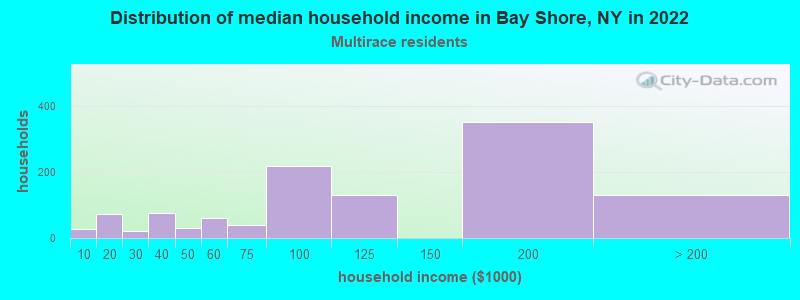
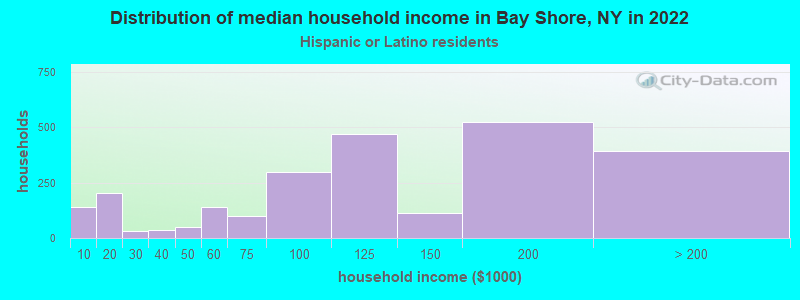
Income and house value in Bay Shore Median household income in 2022 $96,079 White non-Hispanic householders$95,478 Black householders$128,206 American Indian and Alaska Native householders$112,292 Asian householders$115,698 Some other race householders$103,342 Two or more races householders$111,354 Hispanic or Latino race householdersMedian 2022 house value $501,264 White Non-Hispanic householders$467,041 Black or African American householders$538,171 American Indian or Alaska Native householders $583,131 Asian householders$463,015 Some other race householders$629,097 Two or more races householders$478,114 Hispanic or Latino householders
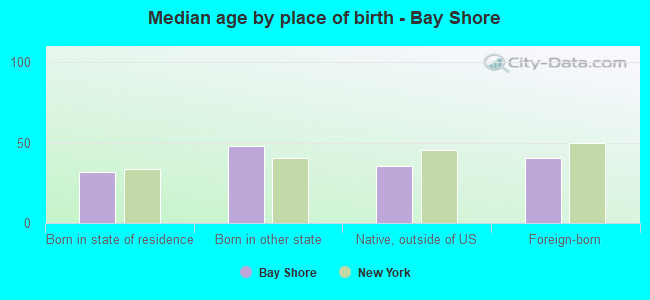
Median age by race in Bay Shore
43.5 Median age for White residents40.9 46.6 31.6 Median age for Black or African American residents32.1 31.4 26.7 Median age for American Indian / Alaska Native residents19.4 27.4 15.8 Median age for Asian residents14.0 26.9 -742,816,091.2 Median age for Native Hawaiian / Pacific Islander residents-831,187,409.8 -771,300,447.7 34.6 Median age for Other race residents39.8 34.1 32.3 Median age for Two or more races residents22.5 39.0 46.9 Median age for White alone residents41.9 50.4 36.0 Median age for Hispanic or Latino residents33.5 36.1
Owner/renter occupied households by race in Bay Shore
House owners and renters - White residents 3,754 66.9% Owner occupied1,856 33.1% Renter occupiedHouse owners and renters - Black or African American residents 1,028 60.6% Owner occupied667 39.4% Renter occupiedHouse owners and renters - American Indian / Alaska Native residents 77 100.0% Owner occupiedHouse owners and renters - Asian residents 233 66.1% Owner occupied119 33.9% Renter occupiedHouse owners and renters - Other race residents 745 68.6% Owner occupied341 31.4% Renter occupiedHouse owners and renters - Two or more races residents 742 67.0% Owner occupied366 33.0% Renter occupiedHouse owners and renters - White alone residents 3,262 67.5% Owner occupied1,574 32.5% Renter occupiedHouse owners and renters - Hispanic or Latino residents 1,550 63.6% Owner occupied887 36.4% Renter occupied
Language usage in Bay Shore
English speakers - Total 62.3% of residents of Bay Shore speak English at home.
26.9% of residents speak Spanish at home 3,741 48.4% Speak English very well3,983 51.6% Speak English less than very well12.2% of residents speak other language at home 2,439 69.5% Speak English very well1,071 30.5% Speak English less than very well
English speakers - Born in the United States 92.3% of residents of Bay Shore speak English at home.
1.6% of residents speak Spanish at home 25 100.0% Speak English very well7.3% of residents speak other language at home 74 62.7% Speak English very well44 37.3% Speak English less than very well
English speakers - Native, born elsewhere 23.7% of residents of Bay Shore speak English at home.
54.4% of residents speak Spanish at home 459 71.9% Speak English very well179 28.1% Speak English less than very well24.6% of residents speak other language at home 288 100.0% Speak English very well
English speakers - Foreign-born 16.7% of residents of Bay Shore speak English at home.
54.9% of residents speak Spanish at home 1,304 27.3% Speak English very well3,465 72.7% Speak English less than very well29.6% of residents speak other language at home 1,515 58.9% Speak English very well1,057 41.1% Speak English less than very well
White (Caucasian) - Speak only English Native:
89.5% (11,052)Foreign-born:
14.1% (199)
White (Caucasian) - Speak another language Native:
9.1% (1,122)Foreign-born:
81.2% (1,142)
Black or African American - Speak only English Native:
86.3% (2,944)Foreign-born:
40.5% (480)
Black or African American - Speak another language Native:
14.4% (491)Foreign-born:
56.7% (671)
American Indian / Alaska Native - Speak another language Native:
100.0% (392)Foreign-born:
100.0% (316)
Asian - Speak only English Native:
43.1% (287)Foreign-born:
15.2% (251)
Asian - Speak another language Native:
57.3% (381)Foreign-born:
82.3% (1,358)
Other race - Speak only English Native:
50.9% (925)Foreign-born:
11.4% (364)
Other race - Speak another language Native:
50.5% (917)Foreign-born:
87.7% (2,806)
Two or more races - Speak only English Native:
67.9% (1,646)Foreign-born:
11.3% (160)
Two or more races - Speak another language Native:
32.2% (782)Foreign-born:
88.9% (1,260)
White alone - Speak only English Native:
97.1% (9,964)Foreign-born:
11.6% (50)
White alone - Speak another language Native:
2.8% (290)Foreign-born:
88.4% (381)
Hispanic or Latino - Speak only English Native:
42.6% (2,073)Foreign-born:
8.9% (465)
Hispanic or Latino - Speak another language Native:
56.9% (2,768)Foreign-born:
90.9% (4,735)
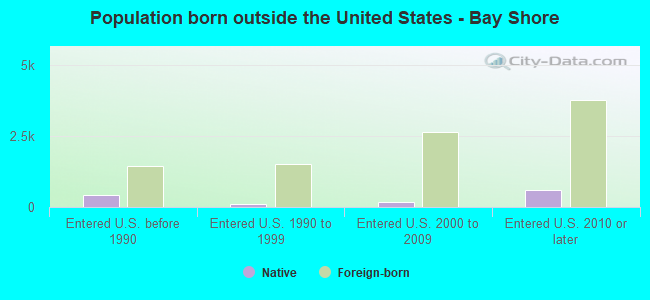
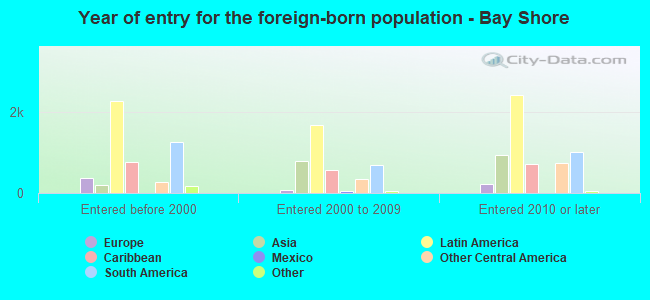
Foreign-born residents in Bay Shore 8,367 residents are foreign born (18.3% Latin America , 6.6% Asia ).
This city:
27.4%New York:
22.6%
Marital status for residents in Bay Shore Marital status - White (Caucasian) population 15 years and over
Males 42.2% Never married41.0% Now married1.5% Separated5.2% Widowed10.1% DivorcedFemales 23.6% Never married45.8% Now married3.9% Separated11.2% Widowed15.5% DivorcedWomen who gave birth in the past 12 months Now married:
87.2% (255)Unmarried:
12.8% (37)
Women who did not give birth in the past 12 months Now married:
46.0% (1,201)Unmarried:
54.0% (1,410)
Marital status - Black or African American population 15 years and over
Males 52.9% Never married35.3% Now married0.4% Separated3.5% Widowed7.9% DivorcedFemales 50.1% Never married27.1% Now married2.6% Separated10.7% Widowed9.4% DivorcedWomen who gave birth in the past 12 months Now married:
100.0% (17)Unmarried:
0.0% (0)
Women who did not give birth in the past 12 months Now married:
18.8% (296)Unmarried:
81.2% (1,274)
Marital status - American Indian / Alaska Native population 15 years and over
Males 40.0% Never married60.0% Now married0.0% Separated0.0% Widowed0.0% DivorcedFemales 49.1% Never married50.9% Now married0.0% Separated0.0% Widowed0.0% DivorcedWomen who gave birth in the past 12 months Now married:
0.0% (0)Unmarried:
100.0% (59)
Women who did not give birth in the past 12 months Now married:
50.7% (102)Unmarried:
49.3% (99)
Marital status - Asian population 15 years and over
Males 48.9% Never married43.7% Now married5.9% Separated1.5% Widowed0.0% DivorcedFemales 38.0% Never married59.0% Now married0.0% Separated3.0% Widowed0.0% DivorcedWomen who gave birth in the past 12 months Now married:
100.0% (92)Unmarried:
0.0% (0)
Women who did not give birth in the past 12 months Now married:
48.9% (206)Unmarried:
51.1% (216)
Marital status - Other race population 15 years and over
Males 45.8% Never married45.5% Now married1.9% Separated2.6% Widowed4.1% DivorcedFemales 53.9% Never married32.3% Now married0.2% Separated4.8% Widowed8.9% DivorcedWomen who gave birth in the past 12 months Now married:
61.8% (31)Unmarried:
38.2% (19)
Women who did not give birth in the past 12 months Now married:
23.7% (331)Unmarried:
76.3% (1,066)
Marital status - Two or more races population 15 years and over
Males 52.3% Never married41.7% Now married0.0% Separated2.2% Widowed3.7% DivorcedFemales 43.3% Never married28.2% Now married1.3% Separated22.5% Widowed4.7% DivorcedWomen who gave birth in the past 12 months Now married:
0.0% (0)Unmarried:
100.0% (259)
Women who did not give birth in the past 12 months Now married:
32.3% (323)Unmarried:
67.7% (679)
Marital status - White alone, not Hispanic / Latino population 15 years and over
Males 37.6% Never married47.4% Now married1.6% Separated3.5% Widowed10.0% DivorcedFemales 20.8% Never married48.4% Now married2.3% Separated11.2% Widowed17.3% DivorcedWomen who gave birth in the past 12 months Now married:
84.2% (215)Unmarried:
15.8% (40)
Women who did not give birth in the past 12 months Now married:
43.0% (812)Unmarried:
57.0% (1,076)
Marital status - Hispanic or Latino population 15 years and over
Males 50.6% Never married36.0% Now married1.5% Separated5.1% Widowed6.8% DivorcedFemales 38.8% Never married38.0% Now married4.1% Separated9.3% Widowed9.8% DivorcedWomen who gave birth in the past 12 months Now married:
61.4% (89)Unmarried:
38.6% (56)
Women who did not give birth in the past 12 months Now married:
39.9% (965)Unmarried:
60.1% (1,456)
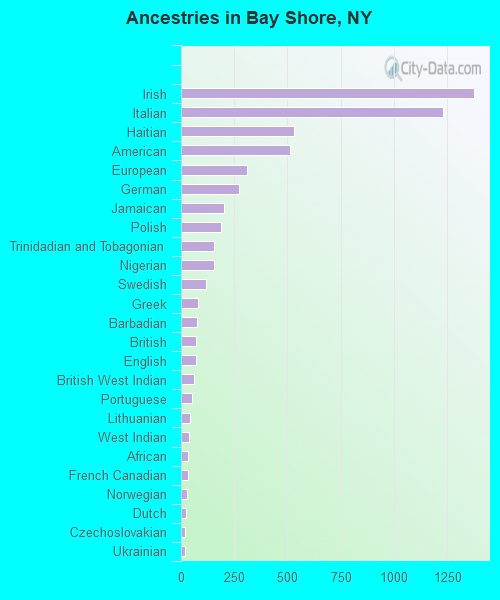
Ancestries in Bay Shore
1,378 10.5% Irish1,229 9.4% Italian531 4.0% Haitian514 3.9% American308 2.3% European274 2.1% German201 1.5% Jamaican189 1.4% Polish157 1.2% Trinidadian and Tobagonian153 1.2% Nigerian116 0.9% Swedish82 0.6% Greek77 0.6% Barbadian71 0.5% British71 0.5% English61 0.5% British West Indian52 0.4% Portuguese43 0.3% Lithuanian37 0.3% West Indian34 0.3% African33 0.3% French Canadian28 0.2% Norwegian24 0.2% Dutch20 0.2% Czechoslovakian19 0.1% Ukrainian18 0.1% Welsh12 0.09% Eastern European11 0.08% Scotch-Irish9 0.07% Hungarian7 0.05% Armenian6 0.05% French1 0.01% Russian1 0.01% Afghan
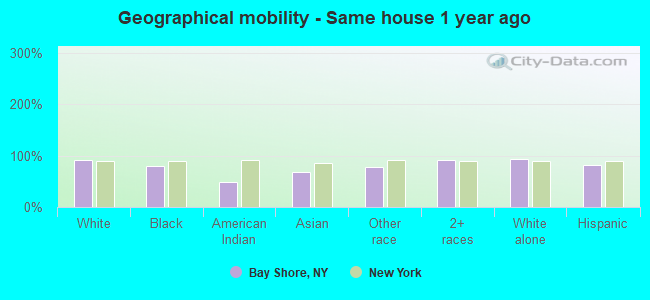
Geographical mobility in Bay Shore Same house 1 year ago 13,093 92.1% White (Caucasian)3,775 79.3% Black or African American334 49.2% American Indian / Alaska Native1,880 68.3% Asian4,012 77.1% Other race3,810 92.2% Two or more races10,180 93.4% White alone, not Hispanic / Latino8,546 81.4% Hispanic or LatinoMoved within same county 890 6.3% White / Caucasian666 14.0% Black or African American238 35.0% American Indian / Alaska Native285 10.3% Asian916 17.6% Other race312 7.6% Two or more races534 4.9% White alone, not Hispanic / Latino1,684 16.0% Hispanic or LatinoMoved within same state 163 1.1% White / Caucasian209 4.4% Black or African American545 19.8% Asian368 7.1% Other race11 0.3% Two or more races170 1.6% White alone, not Hispanic / Latino215 2.1% Hispanic or LatinoMoved from different state 23 0.2% White / Caucasian18 0.4% Black or African American21 0.8% Asian24 0.2% White alone, not Hispanic / LatinoMoved from abroad 60 0.4% White1 0.0% Asian88 1.7% Other race113 1.1% Hispanic or Latino
Children Nativity (place of birth) in Bay Shore
Children under 6 years - Living with two parents Both parents native 706 91.5% Native66 8.5% Foreign-bornBoth parents foreign-born 299 76.0% Native94 24.0% Foreign-bornOne native, one foreign-born parent 116 100.0% NativeChildren under 6 years - Living with one parent Native parent 176 93.1% Native13 6.9% Foreign-bornForeign-born parent 274 71.1% Native112 28.9% Foreign-bornChildren 6 to 17 years - Living with two parents Both parents native 1,435 99.9% Native2 0.1% Foreign-bornBoth parents foreign-born 536 55.9% Native422 44.1% Foreign-bornOne native, one foreign-born parent 304 91.1% Native30 8.9% Foreign-bornChildren 6 to 17 years - Living with one parent Native parent 780 100.0% Foreign-bornForeign-born parent 1,865 75.5% Native604 24.5% Foreign-born
Grandparents responsible for own grandchildren in Bay Shore
Grandparents (30 to 59 years) White / Caucasian 46 42.0% Responsible for grandchildren64 58.0% Not responsible for grandchildrenAmerican Indian / Alaska Native 173 100.0% Not responsible for grandchildrenOther race 25 34.4% Responsible for grandchildren49 65.6% Not responsible for grandchildrenWhite alone, not Hispanic / Latino 14 100.0% Not responsible for grandchildrenHispanic or Latino 82 28.3% Responsible for grandchildren208 71.7% Not responsible for grandchildren
Grandparents (60 years and over) White / Caucasian 159 100.0% Not responsible for grandchildrenOther race 88 100.0% Not responsible for grandchildrenWhite alone, not Hispanic / Latino 81 100.0% Not responsible for grandchildrenHispanic or Latino 225 100.0% Not responsible for grandchildren