Races in Batavia, New York (NY) Detailed Stats
Ancestries, Foreign-born residents, place of birth
Settings
X


Recent posts about races in Batavia, New York on our local forum with over 2,400,000 registered users:
 | smaller Upstate NY cities and towns/African American communities (5987 replies) |
| What is Batavia like? (218 replies) |
| For those interested in Technology and Economic activity in Upstate NY... (2814 replies) |
| A casino in Rochester? (105 replies) |
| School (district) videos (117 replies) |
| Buffalo Almost Had Major League Baseball (147 replies) |
Latest news about races in Batavia, NY collected exclusively by city-data.com from local newspapers, TV, and radio stations
According to 2022 data, the most numerous races in Batavia, NY are White alone (12,484 residents), Hispanic (852 residents), and Black alone (699 residents). 94.1% of Batavia residents speak English at home. 4.2% of Batavia, NY residents are foreign-born (1.9% born in Latin America, 1.1% born in Europe, 1.0% born in Asia), which is 428.0% less than the foreign-born rate of 22.0% across the entire state of New York.
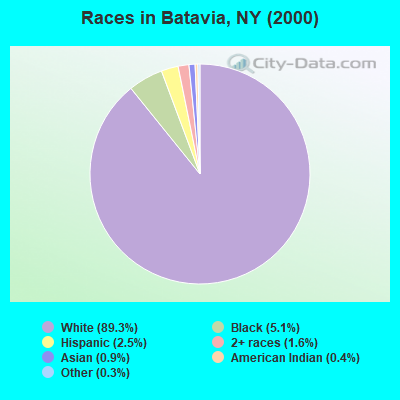
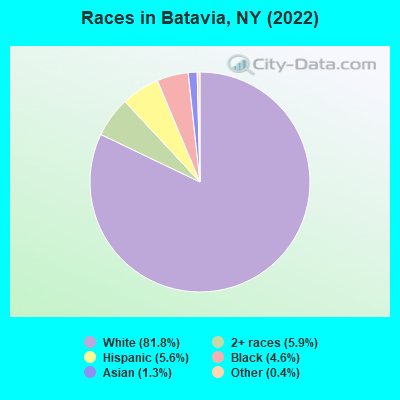
Race distribution in Batavia
2000
2022

- 14,51789.3%White alone
- 8275.1%Black alone
- 3992.5%Hispanic
- 2541.6%Two or more races
- 1410.9%Asian alone
- 720.4%American Indian alone
- 420.3%Other race alone
- 40.02%Native Hawaiian and Other
Pacific Islander alone
-
- 12,48481.8%White alone
- 9055.9%Two or more races
- 8525.6%Hispanic
- 6994.6%Black alone
- 2041.3%Asian alone
- 550.4%Other race alone
- 60.04%American Indian alone
2000
2022
-
- 11,760,98162.0%White alone
- 2,867,58315.1%Hispanic
- 2,812,62314.8%Black alone
- 1,035,9265.5%Asian alone
- 366,1161.9%Two or more races
- 75,4990.4%Other race alone
- 52,4990.3%American Indian alone
- 5,2300.03%Native Hawaiian and Other
Pacific Islander alone

-
- 10,408,93352.9%White alone
- 3,867,29919.7%Hispanic
- 2,633,84013.4%Black alone
- 1,776,2869.0%Asian alone
- 732,6703.7%Two or more races
- 216,1101.1%Other race alone
- 35,0820.2%American Indian alone
- 6,9310.04%Native Hawaiian and Other
Pacific Islander alone

Income and house value in Batavia
- Median household income in 2022
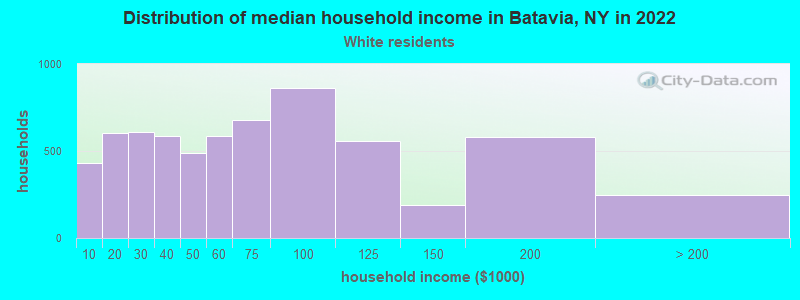
- $56,232White non-Hispanic householders
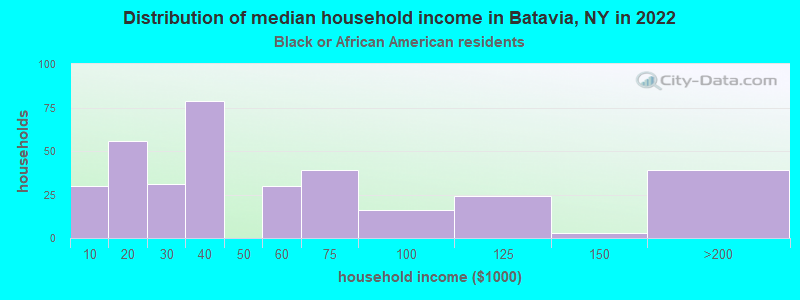
- $36,200Black householders
- $47,023Two or more races householders
- $72,023Hispanic or Latino race householders
- Median 2022 house value
- $133,051White Non-Hispanic householders
- $106,888Black or African American householders
- $111,880American Indian or Alaska Native householders
- $134,256Asian householders
- $175,221Some other race householders
- $233,054Two or more races householders
- $129,092Hispanic or Latino householders
Household income for White non-Hispanic householders
Household income for Black householders
Household income for Asian householders
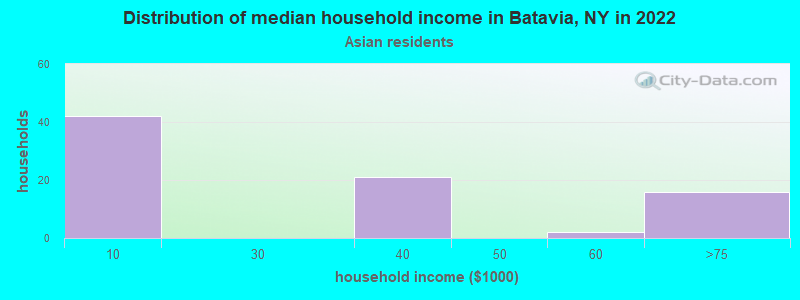
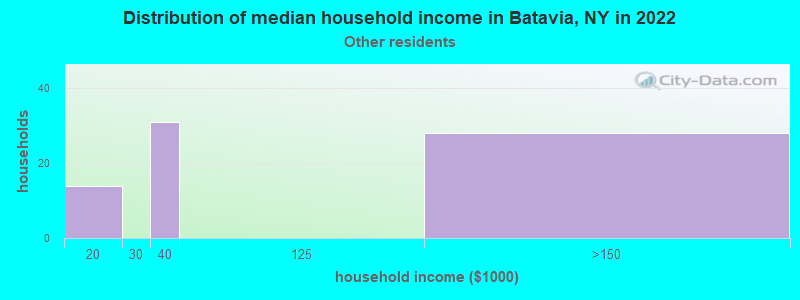
Household income for Some other race householders
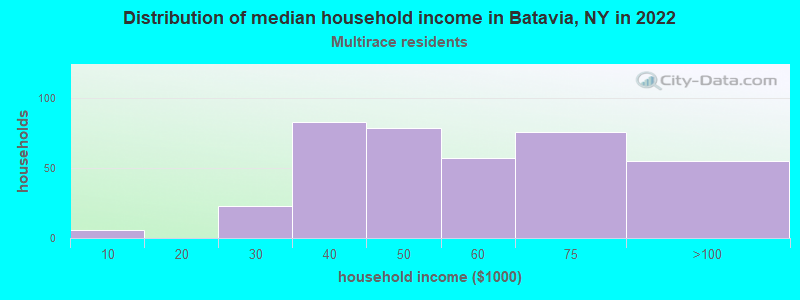
Household income for Two or more races householders
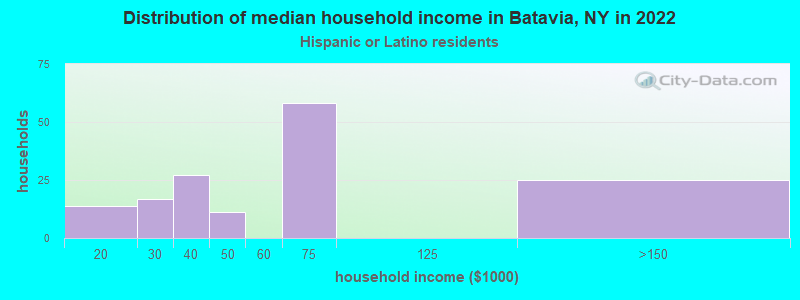
Household income for Hispanic or Latino race householders
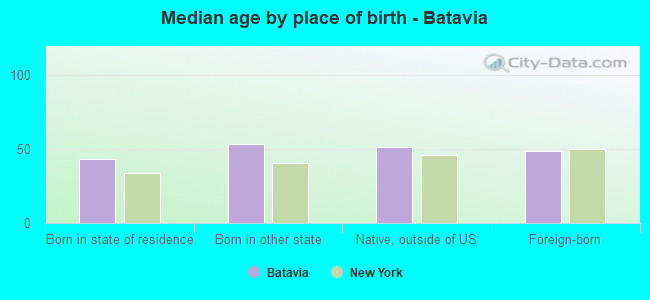
Median age by race in Batavia
- 48.7Median age for White residents
- 46.5Males
- 51.6Females
- 40.3Median age for Black or African American residents
- 32.5Males
- 50.5Females
- -676,300,577.4Median age for American Indian / Alaska Native residents
- -707,843,136.5Males
- -642,115,202.4Females
- 52.4Median age for Asian residents
- 52.7Males
- 46.8Females
- -487,992,314.6Median age for Native Hawaiian / Pacific Islander residents
- -477,502,295.2Males
- -497,387,669.3Females
- 36.7Median age for Other race residents
- 39.7Males
- 36.3Females
- 20.7Median age for Two or more races residents
- 23.8Males
- 16.8Females
- 48.7Median age for White alone residents
- 46.4Males
- 51.6Females
- 26.3Median age for Hispanic or Latino residents
- 22.1Males
- 30.0Females
Owner/renter occupied households by race in Batavia
- House owners and renters - White residents
- 3,56856.0%Owner occupied
- 2,80444.0%Renter occupied
- House owners and renters - Black or African American residents
- 13337.8%Owner occupied
- 21862.2%Renter occupied
- House owners and renters - American Indian / Alaska Native residents
- 8100.0%Renter occupied
- House owners and renters - Asian residents
- 3953.7%Owner occupied
- 3446.3%Renter occupied
- House owners and renters - Other race residents
- 3041.9%Owner occupied
- 4258.1%Renter occupied
- House owners and renters - Two or more races residents
- 10126.0%Owner occupied
- 28974.0%Renter occupied
- House owners and renters - White alone residents
- 3,62454.9%Owner occupied
- 2,97545.1%Renter occupied
- House owners and renters - Hispanic or Latino residents
- 3523.4%Owner occupied
- 11476.6%Renter occupied
Language usage in Batavia
- English speakers - Total
- 94.1% of residents of Batavia speak English at home.
- 3.6% of residents speak Spanish at home
- 37469.5%Speak English very well
- 16430.5%Speak English less than very well
- 2.1% of residents speak other language at home
- 18862.0%Speak English very well
- 11538.0%Speak English less than very well
- English speakers - Born in the United States
- 96.9% of residents of Batavia speak English at home.
- 2.5% of residents speak Spanish at home
- 38100.0%Speak English very well
- 0.5% of residents speak other language at home
- 7100.0%Speak English very well
- English speakers - Native, born elsewhere
- 61.0% of residents of Batavia speak English at home.
- 23.3% of residents speak Spanish at home
- 4178.8%Speak English very well
- 1121.2%Speak English less than very well
- 17.9% of residents speak other language at home
- 40100.0%Speak English very well
- English speakers - Foreign-born
- 26.8% of residents of Batavia speak English at home.
- 46.0% of residents speak Spanish at home
- 14148.1%Speak English very well
- 15251.9%Speak English less than very well
- 26.4% of residents speak other language at home
- 6840.5%Speak English very well
- 10059.5%Speak English less than very well
White (Caucasian) - Speak only English
| Native: | 100.0% (11,870) |
| Foreign-born: | 81.3% (150) |
White (Caucasian) - Speak another language
| Native: | 1.4% (161) |
| Foreign-born: | 28.3% (52) |
Black or African American - Speak another language
| Native: | 1.6% (12) |
| Foreign-born: | 100.0% (7) |
Asian - Speak only English
| Native: | 100.0% (68) |
| Foreign-born: | 9.4% (13) |
Other race - Speak another language
| Native: | 54.8% (94) |
| Foreign-born: | 99.8% (138) |
Two or more races - Speak another language
| Native: | 11.1% (116) |
| Foreign-born: | 100.0% (195) |
White alone - Speak only English
| Native: | 98.7% (11,844) |
| Foreign-born: | 83.3% (156) |
White alone - Speak another language
| Native: | 1.3% (162) |
| Foreign-born: | 17.5% (33) |
Hispanic or Latino - Speak another language
| Native: | 45.0% (210) |
| Foreign-born: | 99.6% (309) |
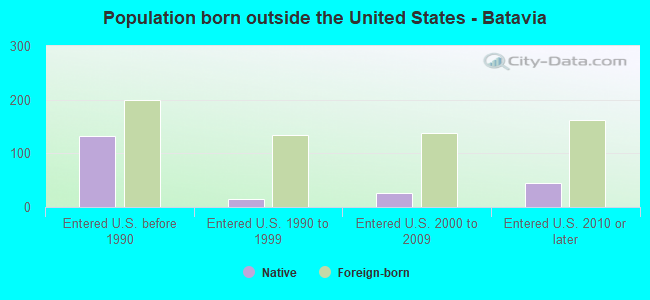
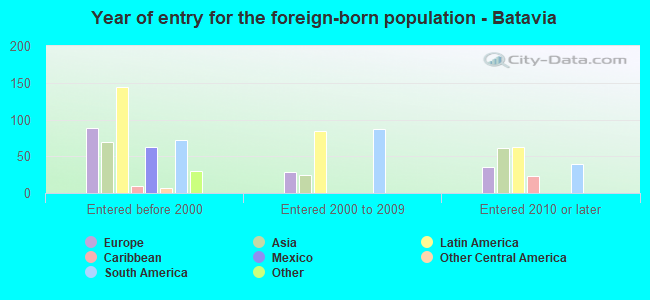
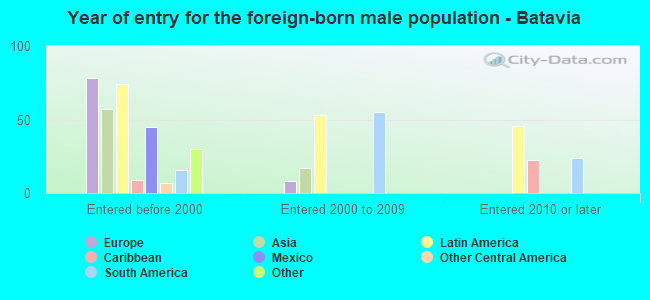
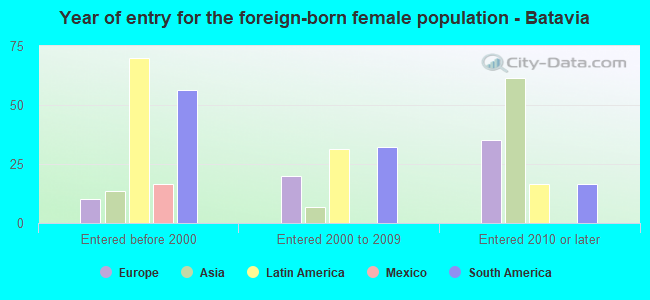
Foreign-born residents in Batavia
636 residents are foreign born (1.9% Latin America, 1.1% Europe, 1.0% Asia).
| This city: | 4.2% |
| New York: | 22.6% |
Marital status for residents in Batavia
Marital status - White (Caucasian) population 15 years and over
- Males
- 39.6%Never married
- 42.1%Now married
- 0.5%Separated
- 4.8%Widowed
- 13.0%Divorced
- Females
- 31.4%Never married
- 37.2%Now married
- 2.6%Separated
- 12.1%Widowed
- 16.7%Divorced
Women who gave birth in the past 12 months
| Now married: | 59.0% (65) |
| Unmarried: | 41.0% (45) |
Women who did not give birth in the past 12 months
| Now married: | 34.0% (776) |
| Unmarried: | 66.0% (1,507) |
Marital status - Black or African American population 15 years and over
- Males
- 63.9%Never married
- 16.1%Now married
- 0.0%Separated
- 3.9%Widowed
- 16.1%Divorced
- Females
- 40.6%Never married
- 15.6%Now married
- 1.6%Separated
- 7.3%Widowed
- 34.9%Divorced
Women who did not give birth in the past 12 months
| Now married: | 17.1% (12) |
| Unmarried: | 82.9% (57) |
Marital status - American Indian / Alaska Native population 15 years and over
- Males
- 100.0%Never married
- 0.0%Now married
- 0.0%Separated
- 0.0%Widowed
- 0.0%Divorced
- Females
- 0.0%Never married
- 100.0%Now married
- 0.0%Separated
- 0.0%Widowed
- 0.0%Divorced
Women who did not give birth in the past 12 months
| Now married: | 100.0% (9) |
| Unmarried: | 0.0% (0) |
Marital status - Asian population 15 years and over
- Males
- 36.4%Never married
- 56.8%Now married
- 6.8%Separated
- 0.0%Widowed
- 0.0%Divorced
- Females
- 1.3%Never married
- 82.7%Now married
- 16.0%Separated
- 0.0%Widowed
- 0.0%Divorced
Women who did not give birth in the past 12 months
| Now married: | 97.6% (41) |
| Unmarried: | 2.4% (1) |
Marital status - Other race population 15 years and over
- Males
- 53.5%Never married
- 46.5%Now married
- 0.0%Separated
- 0.0%Widowed
- 0.0%Divorced
- Females
- 65.9%Never married
- 23.9%Now married
- 10.1%Separated
- 0.0%Widowed
- 0.0%Divorced
Women who did not give birth in the past 12 months
| Now married: | 37.6% (52) |
| Unmarried: | 62.4% (86) |
Marital status - Two or more races population 15 years and over
- Males
- 46.0%Never married
- 33.3%Now married
- 7.1%Separated
- 0.0%Widowed
- 13.6%Divorced
- Females
- 66.4%Never married
- 21.7%Now married
- 0.0%Separated
- 5.1%Widowed
- 6.8%Divorced
Women who gave birth in the past 12 months
| Now married: | 100.0% (12) |
| Unmarried: | 0.0% (0) |
Women who did not give birth in the past 12 months
| Now married: | 18.1% (74) |
| Unmarried: | 81.9% (335) |
Marital status - White alone, not Hispanic / Latino population 15 years and over
- Males
- 39.4%Never married
- 42.1%Now married
- 0.5%Separated
- 4.9%Widowed
- 13.1%Divorced
- Females
- 31.0%Never married
- 37.5%Now married
- 2.6%Separated
- 12.1%Widowed
- 16.7%Divorced
Women who gave birth in the past 12 months
| Now married: | 59.0% (69) |
| Unmarried: | 41.0% (48) |
Women who did not give birth in the past 12 months
| Now married: | 34.5% (817) |
| Unmarried: | 65.5% (1,551) |
Marital status - Hispanic or Latino population 15 years and over
- Males
- 43.8%Never married
- 56.2%Now married
- 0.0%Separated
- 0.0%Widowed
- 0.0%Divorced
- Females
- 46.2%Never married
- 45.7%Now married
- 5.7%Separated
- 0.0%Widowed
- 2.4%Divorced
Women who did not give birth in the past 12 months
| Now married: | 55.5% (113) |
| Unmarried: | 44.5% (91) |
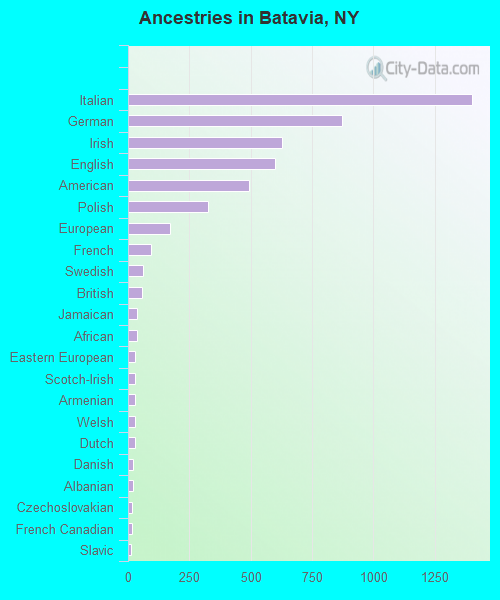
Ancestries in Batavia

- 1,40121.7%Italian
- 87413.5%German
- 6269.7%Irish
- 6009.3%English
- 4937.6%American
- 3275.1%Polish
- 1702.6%European
- 941.5%French
- 610.9%Swedish
- 580.9%British
- 380.6%Jamaican
- 350.5%African
- 300.5%Eastern European
- 290.4%Scotch-Irish
- 280.4%Armenian
- 280.4%Welsh
- 270.4%Dutch
- 220.3%Danish
- 190.3%Albanian
- 170.3%Czechoslovakian
- 150.2%French Canadian
- 140.2%Slavic
- 120.2%Canadian
- 90.1%Russian
- 80.1%Romanian
- 70.1%Scottish
- 60.09%Northern European
- 40.06%Croatian
- 30.05%Ukrainian
- 20.03%Serbian
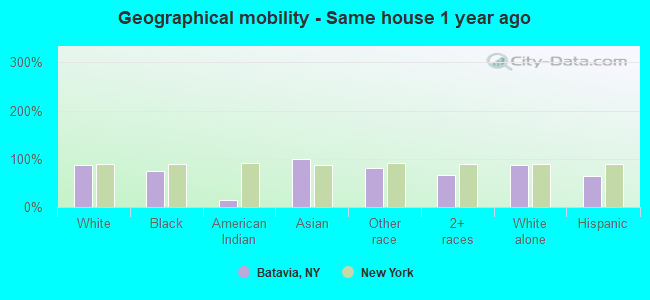
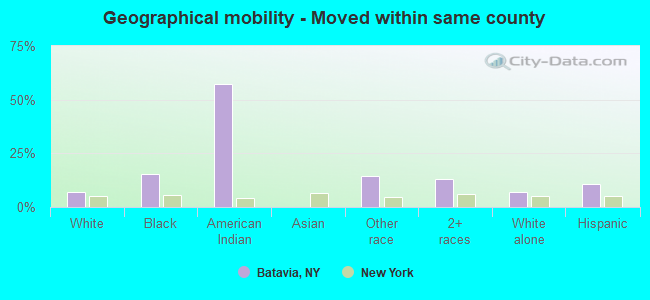
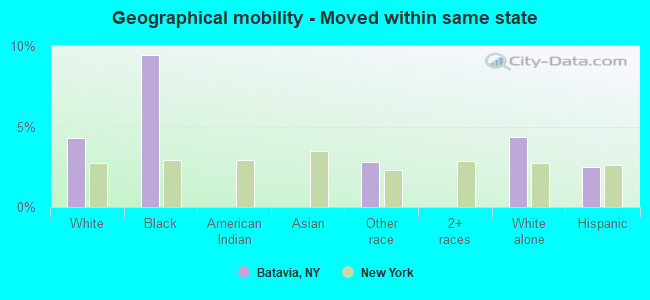
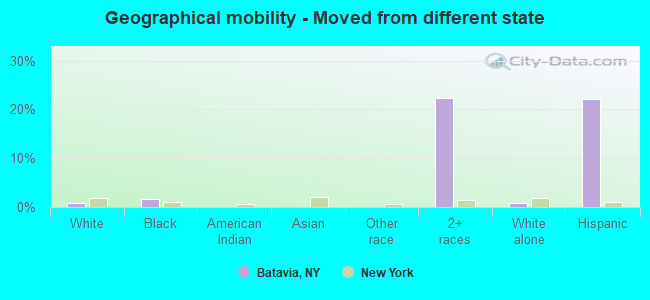
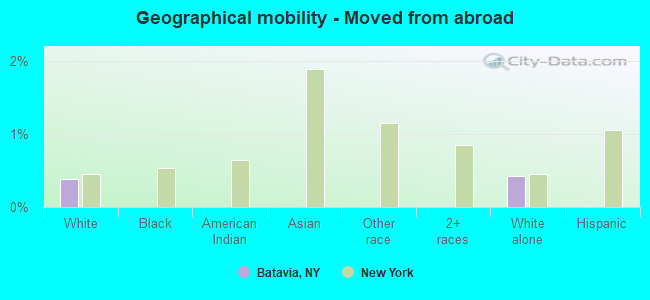
Geographical mobility in Batavia

- Same house 1 year ago
- 10,59187.4%White (Caucasian)
- 52774.2%Black or African American
- 114.8%American Indian / Alaska Native
- 20399.1%Asian
- 25481.9%Other race
- 96066.4%Two or more races
- 10,81187.1%White alone, not Hispanic / Latino
- 54363.7%Hispanic or Latino
-
- Moved within same county
- 8427.0%White / Caucasian
- 11015.5%Black or African American
- 557.2%American Indian / Alaska Native
- 4414.3%Other race
- 18713.0%Two or more races
- 8857.1%White alone, not Hispanic / Latino
- 9210.8%Hispanic or Latino
-
- Moved within same state
- 5164.3%White / Caucasian
- 679.4%Black or African American
- 92.8%Other race
- 5364.3%White alone, not Hispanic / Latino
- 212.5%Hispanic or Latino
-
- Moved from different state
- 970.8%White / Caucasian
- 121.7%Black or African American
- 32322.4%Two or more races
- 1010.8%White alone, not Hispanic / Latino
- 18922.1%Hispanic or Latino
-
- Moved from abroad
- 460.4%White
- 520.4%White alone, not Hispanic / Latino
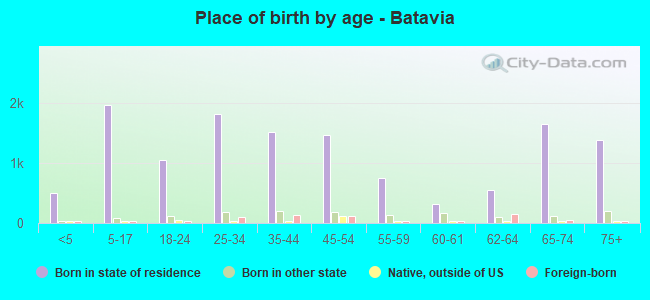
Children Nativity (place of birth) in Batavia
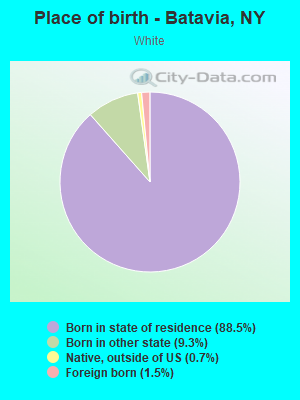
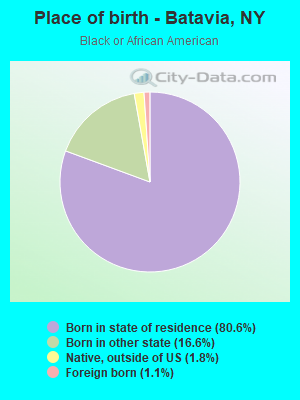
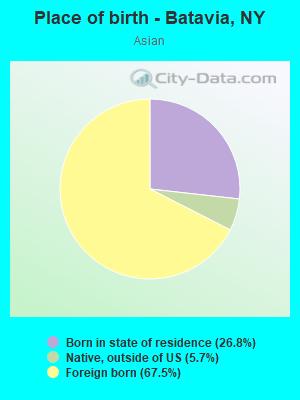
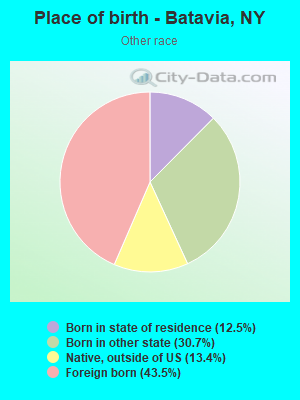
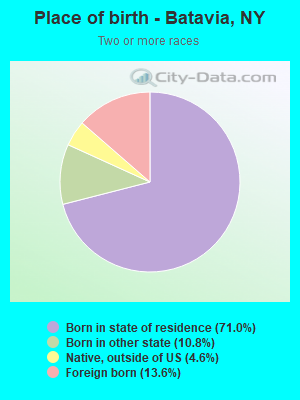
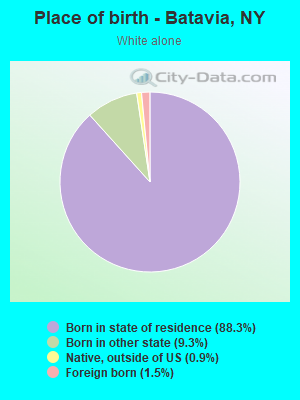
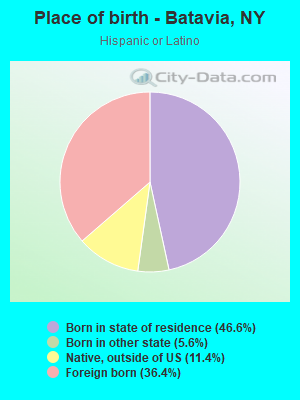
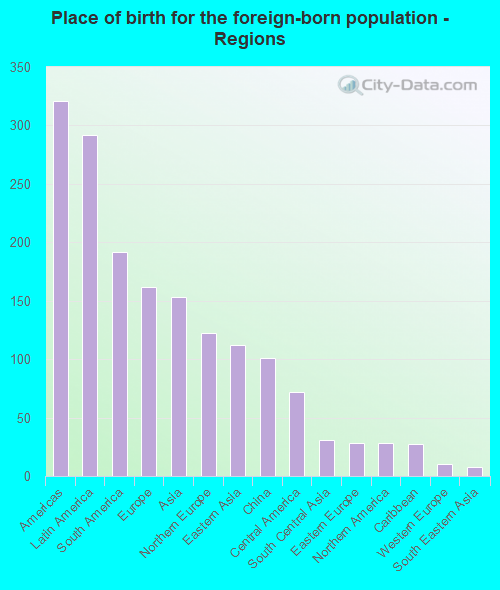
Place of birth for residents in Batavia
![Place of birth for the foreign-born population - Regions]()
- 321Americas
- 292Latin America
- 192South America
- 162Europe
- 153Asia
- 122Northern Europe
- 112Eastern Asia
- 101China
- 72Central America
- 31South Central Asia
- 28Eastern Europe
- 28Northern America
- 27Caribbean
- 10Western Europe
- 8South Eastern Asia
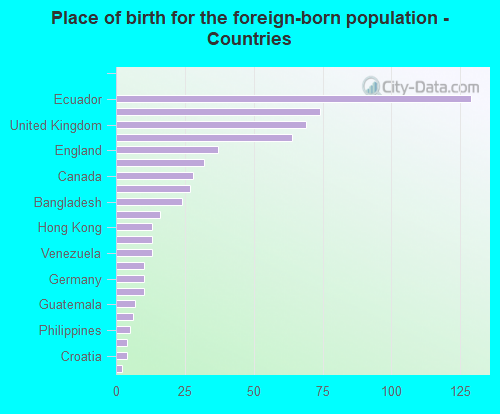
![Place of birth for the foreign-born population - Countries]()
- 129Ecuador
- 74China
- 69United Kingdom
- 64Mexico
- 37England
- 32Colombia
- 28Canada
- 27Dominican Republic
- 24Bangladesh
- 16Argentina
- 13Hong Kong
- 13Taiwan
- 13Venezuela
- 10Norway
- 10Germany
- 10Japan
- 7Guatemala
- 6India
- 5Philippines
- 4Denmark
- 4Croatia
- 2Laos
Grandparents responsible for own grandchildren in Batavia
Zip codes: 14020.