Races in Basye-Bryce Mountain, Virginia (VA) Detailed Stats
Ancestries, Foreign-born residents, place of birth

Discuss Basye-Bryce Mountain, Virginia races on our local forum with over 2,400,000 registered users
2.9% of Basye-Bryce Mountain, VA residents are foreign-born (2.4% born in Europe, 0.5% born in Asia), which is 308.0% less than the foreign-born rate of 12.0% across the entire state of Virginia.
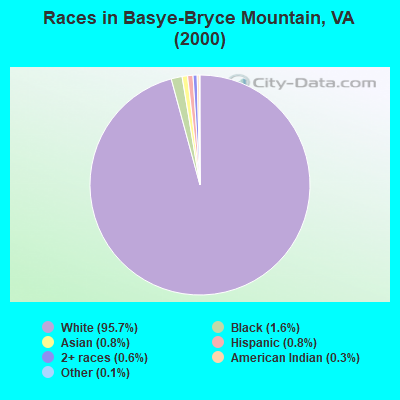
Race distribution in Basye-Bryce Mountain

- 94495.7%White alone
- 161.6%Black alone
- 80.8%Hispanic
- 80.8%Asian alone
- 60.6%Two or more races
- 30.3%American Indian alone
- 10.1%Other race alone
2000
2022
-
- 4,965,63770.2%White alone
- 1,376,37819.4%Black alone
- 329,5404.7%Hispanic
- 259,2773.7%Asian alone
- 114,0221.6%Two or more races
- 18,5960.3%American Indian alone
- 11,6850.2%Other race alone
- 3,3800.05%Native Hawaiian and Other
Pacific Islander alone

-
- 5,095,13058.7%White alone
- 1,594,78518.4%Black alone
- 905,75010.4%Hispanic
- 602,8816.9%Asian alone
- 406,0474.7%Two or more races
- 60,4190.7%Other race alone
- 11,7380.1%American Indian alone
- 6,8690.08%Native Hawaiian and Other
Pacific Islander alone

Income and house value in Basye-Bryce Mountain
- Median household income in 2022
- $90,444White non-Hispanic householders
- Median 2022 house value
- $357,668White Non-Hispanic householders
Household income for White non-Hispanic householders

Foreign-born residents in Basye-Bryce Mountain
29 residents are foreign born (2.4% Europe, 0.5% Asia).
| This city: | 2.9% |
| Virginia: | 8.1% |
Ancestries in Basye-Bryce Mountain

- 23721.5%German
- 19517.7%Irish
- 17315.7%United States
- 17215.6%English
- 1059.5%Other
- 464.2%Scottish
- 353.2%Italian
- 353.2%Scotch-Irish
- 343.1%Welsh
- 272.4%Swedish
- 90.8%Portuguese
- 70.6%Greek
- 70.6%Polish
- 60.5%Czech
- 50.5%Arab
- 50.5%Danish
- 50.5%French

Zip codes: 22842.