Races in Barberton, Washington (WA) Detailed Stats
Data:
Races - White alone (%)
Races - White alone (% change since 2000)
Races - Black alone (%)
Races - Black alone (% change since 2000)
Races - American Indian alone (%)
Races - American Indian alone (% change since 2000)
Races - Asian alone (%)
Races - Asian alone (% change since 2000)
Races - Hispanic (%)
Races - Hispanic (% change since 2000)
Races - Native Hawaiian and Other Pacific Islander alone (%)
Races - Native Hawaiian and Other Pacific Islander alone (% change since 2000)
Races - Two or more races(%)
Races - Two or more races(% change since 2000)
Races - Other race alone (%)
Races - Other race alone (% change since 2000)
Racial diversity
Place of birth - Born in state of residence (%)
Place of birth - Born in state of residence (%) - White
Place of birth - Born in state of residence (%) - Black or African American
Place of birth - Born in state of residence (%) - Asian
Place of birth - Born in state of residence (%) - Hispanic or Latino
Place of birth - Born in state of residence (%) - American Indian and Alaska Native
Place of birth - Born in state of residence (%) - Multirace
Place of birth - Born in state of residence (%) - Other Race
Place of birth - Born in other state (%)
Place of birth - Born in other state (%) - White
Place of birth - Born in other state (%) - Black or African American
Place of birth - Born in other state (%) - Asian
Place of birth - Born in other state (%) - Hispanic or Latino
Place of birth - Born in other state (%) - American Indian and Alaska Native
Place of birth - Born in other state (%) - Multirace
Place of birth - Born in other state (%) - Other Race
Place of birth - Native, outside of US (%)
Place of birth - Native, outside of US (%) - White
Place of birth - Native, outside of US (%) - Black or African American
Place of birth - Native, outside of US (%) - Asian
Place of birth - Native, outside of US (%) - Hispanic or Latino
Place of birth - Native, outside of US (%) - American Indian and Alaska Native
Place of birth - Native, outside of US (%) - Multirace
Place of birth - Native, outside of US (%) - Other Race
Place of birth - Foreign born (%)
Place of birth - Foreign born (%) - White
Place of birth - Foreign born (%) - Black or African American
Place of birth - Foreign born (%) - Asian
Place of birth - Foreign born (%) - Hispanic or Latino
Place of birth - Foreign born (%) - American Indian and Alaska Native
Place of birth - Foreign born (%) - Multirace
Place of birth - Foreign born (%) - Other Race
Residents speaking English at home (%)
Residents speaking English at home - Born in the United States (%)
Residents speaking English at home - Native, born elsewhere (%)
Residents speaking English at home - Foreign born (%)
Residents speaking Spanish at home (%)
Residents speaking Spanish at home - Born in the United States (%)
Residents speaking Spanish at home - Native, born elsewhere (%)
Residents speaking Spanish at home - Foreign born (%)
Residents speaking other language at home (%)
Residents speaking other language at home - Born in the United States (%)
Residents speaking other language at home - Native, born elsewhere (%)
Residents speaking other language at home - Foreign born (%)
Marital status - Never married (%)
Marital status - Now married (%)
Marital status - Separated (%)
Marital status - Widowed (%)
Marital status - Divorced (%)
Ancestries Reported - Arab (%)
Ancestries Reported - Czech (%)
Ancestries Reported - Danish (%)
Ancestries Reported - Dutch (%)
Ancestries Reported - English (%)
Ancestries Reported - French (%)
Ancestries Reported - French Canadian (%)
Ancestries Reported - German (%)
Ancestries Reported - Greek (%)
Ancestries Reported - Hungarian (%)
Ancestries Reported - Irish (%)
Ancestries Reported - Italian (%)
Ancestries Reported - Lithuanian (%)
Ancestries Reported - Norwegian (%)
Ancestries Reported - Polish (%)
Ancestries Reported - Portuguese (%)
Ancestries Reported - Russian (%)
Ancestries Reported - Scotch-Irish (%)
Ancestries Reported - Scottish (%)
Ancestries Reported - Slovak (%)
Ancestries Reported - Subsaharan African (%)
Ancestries Reported - Swedish (%)
Ancestries Reported - Swiss (%)
Ancestries Reported - Ukrainian (%)
Ancestries Reported - United States (%)
Ancestries Reported - Welsh (%)
Ancestries Reported - West Indian (%)
Ancestries Reported - Other (%)
Geographical mobility - Same house 1 year ago (%)
Geographical mobility - Same house 1 year ago (%) - White
Geographical mobility - Same house 1 year ago (%) - Black or African American
Geographical mobility - Same house 1 year ago (%) - Asian
Geographical mobility - Same house 1 year ago (%) - Hispanic or Latino
Geographical mobility - Same house 1 year ago (%) - American Indian and Alaska Native
Geographical mobility - Same house 1 year ago (%) - Multirace
Geographical mobility - Same house 1 year ago (%) - Other Race
Geographical mobility - Moved within same county (%)
Geographical mobility - Moved within same county (%) - White
Geographical mobility - Moved within same county (%) - Black or African American
Geographical mobility - Moved within same county (%) - Asian
Geographical mobility - Moved within same county (%) - Hispanic or Latino
Geographical mobility - Moved within same county (%) - American Indian and Alaska Native
Geographical mobility - Moved within same county (%) - Multirace
Geographical mobility - Moved within same county (%) - Other Race
Geographical mobility - Moved from different county within same state (%)
Geographical mobility - Moved from different county within same state (%) - White
Geographical mobility - Moved from different county within same state (%) - Black or African American
Geographical mobility - Moved from different county within same state (%) - Asian
Geographical mobility - Moved from different county within same state (%) - Hispanic or Latino
Geographical mobility - Moved from different county within same state (%) - American Indian and Alaska Native
Geographical mobility - Moved from different county within same state (%) - Multirace
Geographical mobility - Moved from different county within same state (%) - Other Race
Geographical mobility - Moved from different state (%)
Geographical mobility - Moved from different state (%) - White
Geographical mobility - Moved from different state (%) - Black or African American
Geographical mobility - Moved from different state (%) - Asian
Geographical mobility - Moved from different state (%) - Hispanic or Latino
Geographical mobility - Moved from different state (%) - American Indian and Alaska Native
Geographical mobility - Moved from different state (%) - Multirace
Geographical mobility - Moved from different state (%) - Other Race
Geographical mobility - Moved from abroad (%)
Geographical mobility - Moved from abroad (%) - White
Geographical mobility - Moved from abroad (%) - Black or African American
Geographical mobility - Moved from abroad (%) - Asian
Geographical mobility - Moved from abroad (%) - Hispanic or Latino
Geographical mobility - Moved from abroad (%) - American Indian and Alaska Native
Geographical mobility - Moved from abroad (%) - Multirace
Geographical mobility - Moved from abroad (%) - Other Race
Place of birth for the foreign-born population - Ireland (%)
Place of birth for the foreign-born population - Denmark (%)
Place of birth for the foreign-born population - Norway (%)
Place of birth for the foreign-born population - Sweden (%)
Place of birth for the foreign-born population - United Kingdom (%)
Place of birth for the foreign-born population - England (%)
Place of birth for the foreign-born population - Scotland (%)
Place of birth for the foreign-born population - Other Northern Europe (%)
Place of birth for the foreign-born population - Austria (%)
Place of birth for the foreign-born population - Belgium (%)
Place of birth for the foreign-born population - France (%)
Place of birth for the foreign-born population - Germany (%)
Place of birth for the foreign-born population - Netherlands (%)
Place of birth for the foreign-born population - Switzerland (%)
Place of birth for the foreign-born population - Other Western Europe (%)
Place of birth for the foreign-born population - Greece (%)
Place of birth for the foreign-born population - Italy (%)
Place of birth for the foreign-born population - Portugal (%)
Place of birth for the foreign-born population - Spain (%)
Place of birth for the foreign-born population - Other Southern Europe (%)
Place of birth for the foreign-born population - Albania (%)
Place of birth for the foreign-born population - Belarus (%)
Place of birth for the foreign-born population - Bosnia and Herzegovina (%)
Place of birth for the foreign-born population - Bulgaria (%)
Place of birth for the foreign-born population - Croatia (%)
Place of birth for the foreign-born population - Czechoslovakia (%)
Place of birth for the foreign-born population - Hungary (%)
Place of birth for the foreign-born population - Latvia (%)
Place of birth for the foreign-born population - Lithuania (%)
Place of birth for the foreign-born population - North Macedonia (Macedonia) (%)
Place of birth for the foreign-born population - Moldova (%)
Place of birth for the foreign-born population - Poland (%)
Place of birth for the foreign-born population - Romania (%)
Place of birth for the foreign-born population - Russia (%)
Place of birth for the foreign-born population - Serbia (%)
Place of birth for the foreign-born population - Ukraine (%)
Place of birth for the foreign-born population - Other Eastern Europe (%)
Place of birth for the foreign-born population - China (%)
Place of birth for the foreign-born population - Hong Kong (%)
Place of birth for the foreign-born population - Taiwan (%)
Place of birth for the foreign-born population - Japan (%)
Place of birth for the foreign-born population - Korea (%)
Place of birth for the foreign-born population - Other Eastern Asia (%)
Place of birth for the foreign-born population - Afghanistan (%)
Place of birth for the foreign-born population - Bangladesh (%)
Place of birth for the foreign-born population - India (%)
Place of birth for the foreign-born population - Iran (%)
Place of birth for the foreign-born population - Kazakhstan (%)
Place of birth for the foreign-born population - Nepal (%)
Place of birth for the foreign-born population - Pakistan (%)
Place of birth for the foreign-born population - Sri Lanka (%)
Place of birth for the foreign-born population - Uzbekistan (%)
Place of birth for the foreign-born population - Other South Central Asia (%)
Place of birth for the foreign-born population - Burma (%)
Place of birth for the foreign-born population - Cambodia (%)
Place of birth for the foreign-born population - Indonesia (%)
Place of birth for the foreign-born population - Laos (%)
Place of birth for the foreign-born population - Malaysia (%)
Place of birth for the foreign-born population - Philippines (%)
Place of birth for the foreign-born population - Singapore (%)
Place of birth for the foreign-born population - Thailand (%)
Place of birth for the foreign-born population - Vietnam (%)
Place of birth for the foreign-born population - Other South Eastern Asia (%)
Place of birth for the foreign-born population - Armenia (%)
Place of birth for the foreign-born population - Iraq (%)
Place of birth for the foreign-born population - Israel (%)
Place of birth for the foreign-born population - Jordan (%)
Place of birth for the foreign-born population - Kuwait (%)
Place of birth for the foreign-born population - Lebanon (%)
Place of birth for the foreign-born population - Saudi Arabia (%)
Place of birth for the foreign-born population - Syria (%)
Place of birth for the foreign-born population - Turkey (%)
Place of birth for the foreign-born population - Yemen (%)
Place of birth for the foreign-born population - Other Western Asia (%)
Place of birth for the foreign-born population - Eritrea (%)
Place of birth for the foreign-born population - Ethiopia (%)
Place of birth for the foreign-born population - Kenya (%)
Place of birth for the foreign-born population - Somalia (%)
Place of birth for the foreign-born population - Uganda (%)
Place of birth for the foreign-born population - Zimbabwe (%)
Place of birth for the foreign-born population - Other Eastern Africa (%)
Place of birth for the foreign-born population - Cameroon (%)
Place of birth for the foreign-born population - Congo (%)
Place of birth for the foreign-born population - Democratic Republic of Congo (Zaire) (%)
Place of birth for the foreign-born population - Other Middle Africa (%)
Place of birth for the foreign-born population - Egypt (%)
Place of birth for the foreign-born population - Morocco (%)
Place of birth for the foreign-born population - Sudan (%)
Place of birth for the foreign-born population - Other Northern Africa (%)
Place of birth for the foreign-born population - South Africa (%)
Place of birth for the foreign-born population - Other Southern Africa (%)
Place of birth for the foreign-born population - Cabo Verde (%)
Place of birth for the foreign-born population - Ghana (%)
Place of birth for the foreign-born population - Liberia (%)
Place of birth for the foreign-born population - Nigeria (%)
Place of birth for the foreign-born population - Senegal (%)
Place of birth for the foreign-born population - Sierra Leone (%)
Place of birth for the foreign-born population - Other Western Africa (%)
Place of birth for the foreign-born population - Australia (%)
Place of birth for the foreign-born population - New Zealand (%)
Place of birth for the foreign-born population - Fiji (%)
Place of birth for the foreign-born population - Micronesia (%)
Place of birth for the foreign-born population - Bahamas (%)
Place of birth for the foreign-born population - Barbados (%)
Place of birth for the foreign-born population - Cuba (%)
Place of birth for the foreign-born population - Dominica (%)
Place of birth for the foreign-born population - Dominican Republic (%)
Place of birth for the foreign-born population - Grenada (%)
Place of birth for the foreign-born population - Haiti (%)
Place of birth for the foreign-born population - Jamaica (%)
Place of birth for the foreign-born population - St. Vincent and the Grenadines (%)
Place of birth for the foreign-born population - Trinidad and Tobago (%)
Place of birth for the foreign-born population - West Indies (%)
Place of birth for the foreign-born population - Other Caribbean (%)
Place of birth for the foreign-born population - Belize (%)
Place of birth for the foreign-born population - Costa Rica (%)
Place of birth for the foreign-born population - El Salvador (%)
Place of birth for the foreign-born population - Guatemala (%)
Place of birth for the foreign-born population - Honduras (%)
Place of birth for the foreign-born population - Mexico (%)
Place of birth for the foreign-born population - Nicaragua (%)
Place of birth for the foreign-born population - Panama (%)
Place of birth for the foreign-born population - Other Central America (%)
Place of birth for the foreign-born population - Argentina (%)
Place of birth for the foreign-born population - Bolivia (%)
Place of birth for the foreign-born population - Brazil (%)
Place of birth for the foreign-born population - Chile (%)
Place of birth for the foreign-born population - Colombia (%)
Place of birth for the foreign-born population - Ecuador (%)
Place of birth for the foreign-born population - Guyana (%)
Place of birth for the foreign-born population - Peru (%)
Place of birth for the foreign-born population - Uruguay (%)
Place of birth for the foreign-born population - Venezuela (%)
Place of birth for the foreign-born population - Other South America (%)
Place of birth for the foreign-born population - Canada (%)
Place of birth for the foreign-born population - Other Northern America (%)
Place of birth for the foreign-born population - Other (%)
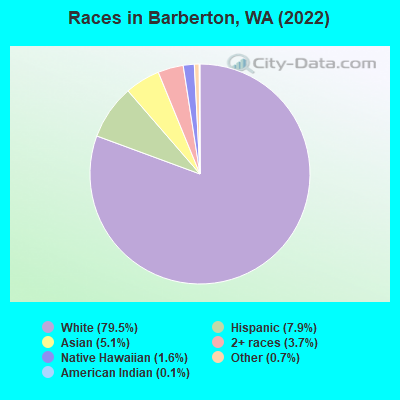
According to 2022 data, the most numerous races in Barberton, WA are White alone (6,473 residents), Hispanic (641 residents), and Asian alone (419 residents). 81.8% of Barberton residents speak English at home. 11.2% of Barberton, WA residents are foreign-born (5.2% born in Europe, 3.6% born in Asia, 2.1% born in Latin America), which is 33.7% less than the foreign-born rate of 15.0% across the entire state of Washington.
Race distribution in Barberton
2000 2022
4,652,490 78.9% White alone 441,509 7.5% Hispanic 319,401 5.4% Asian alone 184,631 3.1% Black alone 175,926 3.0% Two or more races 85,396 1.4% American Indian alone 22,779 0.4% Native Hawaiian and Other 11,989 0.2% Other race alone
4,941,456 63.5% White alone 1,093,313 14.0% Hispanic 755,832 9.7% Asian alone 523,448 6.7% Two or more races 299,537 3.8% Black alone 69,024 0.9% American Indian alone 52,231 0.7% Native Hawaiian and Other 50,945 0.7% Other race alone
Income and house value in Barberton Median household income in 2022 $111,663 White non-Hispanic householders$137,598 Asian householders$79,430 Some other race householders$143,101 Two or more races householders$147,407 Hispanic or Latino race householdersMedian 2022 house value $672,721 White Non-Hispanic householders$823,516 Black or African American householders $327,210 Asian householders$742,263 Some other race householders$503,260 Two or more races householders$503,260 Hispanic or Latino householders
Median age by race in Barberton
47.8 Median age for White residents44.3 52.8 -659,459,458.8 Median age for Black or African American residents-592,216,581.5 -698,955,364.9 33.4 Median age for American Indian / Alaska Native residents56.9 30.2 31.0 Median age for Asian residents34.6 24.9 39.2 Median age for Native Hawaiian / Pacific Islander residents-779,310,344.0 9.7 23.8 Median age for Other race residents20.6 24.0 31.7 Median age for Two or more races residents49.2 26.8 47.3 Median age for White alone residents43.3 52.4 33.0 Median age for Hispanic or Latino residents46.7 27.3
Owner/renter occupied households by race in Barberton
House owners and renters - White residents 2,254 86.7% Owner occupied345 13.3% Renter occupiedHouse owners and renters - American Indian / Alaska Native residents 13 100.0% Owner occupiedHouse owners and renters - Asian residents 88 59.1% Owner occupied61 40.9% Renter occupiedHouse owners and renters - Native Hawaiian / Pacific Islander residents 74 100.0% Owner occupiedHouse owners and renters - Other race residents 20 100.0% Owner occupiedHouse owners and renters - Two or more races residents 215 90.1% Owner occupied24 9.9% Renter occupiedHouse owners and renters - White alone residents 2,197 86.7% Owner occupied337 13.3% Renter occupiedHouse owners and renters - Hispanic or Latino residents 178 83.5% Owner occupied35 16.5% Renter occupied
Language usage in Barberton
English speakers - Total 81.8% of residents of Barberton speak English at home.
3.7% of residents speak Spanish at home 143 49.8% Speak English very well144 50.2% Speak English less than very well13.9% of residents speak other language at home 839 76.9% Speak English very well252 23.1% Speak English less than very well
English speakers - Born in the United States 86.0% of residents of Barberton speak English at home.
2.8% of residents speak Spanish at home 109 91.6% Speak English very well10 8.4% Speak English less than very well13.8% of residents speak other language at home 568 96.8% Speak English very well19 3.2% Speak English less than very well
English speakers - Native, born elsewhere 50.0% of residents of Barberton speak English at home.
13.4% of residents speak Spanish at home 33 100.0% Speak English less than very well18.3% of residents speak other language at home 45 100.0% Speak English very well
English speakers - Foreign-born 15.3% of residents of Barberton speak English at home.
17.9% of residents speak Spanish at home 50 32.9% Speak English very well102 67.1% Speak English less than very well64.0% of residents speak other language at home 309 56.9% Speak English very well234 43.1% Speak English less than very well
White (Caucasian) - Speak only English Native:
92.8% (5,481)Foreign-born:
19.5% (74)
White (Caucasian) - Speak another language Native:
7.0% (412)Foreign-born:
78.8% (298)
American Indian / Alaska Native - Speak another language Native:
54.5% (19)Foreign-born:
100.0% (112)
Asian - Speak only English Native:
96.8% (73)Foreign-born:
21.9% (68)
Other race - Speak another language Native:
12.4% (13)Foreign-born:
100.0% (4)
Two or more races - Speak another language Native:
24.1% (138)Foreign-born:
100.0% (63)
White alone - Speak only English Native:
92.1% (5,420)Foreign-born:
19.0% (78)
White alone - Speak another language Native:
8.7% (510)Foreign-born:
79.8% (327)
Hispanic or Latino - Speak another language Native:
31.1% (138)Foreign-born:
100.0% (152)
Foreign-born residents in Barberton 914 residents are foreign born (5.2% Europe , 3.6% Asia , 2.1% Latin America ).
This city:
11.2%Washington:
14.9%
Marital status for residents in Barberton Marital status - White (Caucasian) population 15 years and over
Males 30.1% Never married65.5% Now married0.0% Separated1.2% Widowed3.3% DivorcedFemales 11.9% Never married64.0% Now married0.7% Separated11.0% Widowed12.4% DivorcedWomen who gave birth in the past 12 months Now married:
100.0% (13)Unmarried:
0.0% (0)
Women who did not give birth in the past 12 months Now married:
68.2% (769)Unmarried:
31.8% (359)
Marital status - American Indian / Alaska Native population 15 years and over
Males 73.1% Never married0.0% Now married0.0% Separated0.0% Widowed26.9% DivorcedFemales 68.8% Never married0.0% Now married0.0% Separated0.0% Widowed31.2% DivorcedWomen who did not give birth in the past 12 months Now married:
0.0% (0)Unmarried:
100.0% (57)
Marital status - Asian population 15 years and over
Males 56.1% Never married43.9% Now married0.0% Separated0.0% Widowed0.0% DivorcedFemales 20.7% Never married70.1% Now married9.2% Separated0.0% Widowed0.0% DivorcedWomen who gave birth in the past 12 months Now married:
100.0% (12)Unmarried:
0.0% (0)
Women who did not give birth in the past 12 months Now married:
74.5% (112)Unmarried:
25.5% (38)
Marital status - Native Hawaiian / Pacific Islander population 15 years and over
Males 30.0% Never married70.0% Now married0.0% Separated0.0% Widowed0.0% DivorcedFemales 0.0% Never married100.0% Now married0.0% Separated0.0% Widowed0.0% DivorcedWomen who did not give birth in the past 12 months Now married:
100.0% (36)Unmarried:
0.0% (0)
Marital status - Other race population 15 years and over
Males 49.0% Never married41.2% Now married0.0% Separated0.0% Widowed9.8% DivorcedFemales 62.1% Never married37.9% Now married0.0% Separated0.0% Widowed0.0% DivorcedWomen who did not give birth in the past 12 months Now married:
37.9% (12)Unmarried:
62.1% (19)
Marital status - Two or more races population 15 years and over
Males 35.2% Never married60.6% Now married0.0% Separated4.2% Widowed0.0% DivorcedFemales 37.3% Never married54.2% Now married0.0% Separated8.4% Widowed0.0% DivorcedWomen who gave birth in the past 12 months Now married:
100.0% (7)Unmarried:
0.0% (0)
Women who did not give birth in the past 12 months Now married:
48.1% (108)Unmarried:
51.9% (116)
Marital status - White alone, not Hispanic / Latino population 15 years and over
Males 30.8% Never married64.6% Now married0.0% Separated1.2% Widowed3.4% DivorcedFemales 10.7% Never married64.3% Now married0.7% Separated11.4% Widowed12.8% DivorcedWomen who gave birth in the past 12 months Now married:
100.0% (13)Unmarried:
0.0% (0)
Women who did not give birth in the past 12 months Now married:
68.5% (770)Unmarried:
31.5% (354)
Marital status - Hispanic or Latino population 15 years and over
Males 35.7% Never married61.5% Now married0.0% Separated0.0% Widowed2.7% DivorcedFemales 57.5% Never married35.7% Now married0.0% Separated1.9% Widowed4.9% DivorcedWomen who gave birth in the past 12 months Now married:
100.0% (6)Unmarried:
0.0% (0)
Women who did not give birth in the past 12 months Now married:
25.3% (63)Unmarried:
74.7% (185)
Ancestries in Barberton
458 11.2% German403 9.9% English385 9.5% Romanian378 9.3% American246 6.0% Irish217 5.3% Norwegian193 4.7% Italian146 3.6% Polish136 3.3% European73 1.8% Scottish64 1.6% Scandinavian46 1.1% Russian42 1.0% Ukrainian33 0.8% Scotch-Irish26 0.6% Swedish24 0.6% Icelander20 0.5% Yugoslavian19 0.5% French18 0.4% Canadian15 0.4% Lebanese15 0.4% Welsh13 0.3% Dutch10 0.2% Swiss8 0.2% Danish8 0.2% Slavic6 0.1% Portuguese5 0.1% Pennsylvania German
Children Nativity (place of birth) in Barberton
Children under 6 years - Living with two parents Both parents native 247 100.0% NativeBoth parents foreign-born 35 100.0% NativeOne native, one foreign-born parent 40 100.0% NativeChildren under 6 years - Living with one parent Native parent 34 100.0% Native
Children 6 to 17 years - Living with two parents Both parents native 806 100.0% NativeBoth parents foreign-born 31 100.0% NativeOne native, one foreign-born parent 54 100.0% NativeChildren 6 to 17 years - Living with one parent Native parent 38 100.0% Native
Grandparents responsible for own grandchildren in Barberton
Grandparents (30 to 59 years) White / Caucasian 12 100.0% Not responsible for grandchildrenWhite alone, not Hispanic / Latino 14 100.0% Not responsible for grandchildrenGrandparents (60 years and over) White / Caucasian 35 59.6% Responsible for grandchildren24 40.4% Not responsible for grandchildrenWhite alone, not Hispanic / Latino 17 40.4% Responsible for grandchildren25 59.6% Not responsible for grandchildren