Races in Baltimore, Maryland (MD) Detailed Stats
Data:
Races - White alone (%)
Races - White alone (% change since 2000)
Races - Black alone (%)
Races - Black alone (% change since 2000)
Races - American Indian alone (%)
Races - American Indian alone (% change since 2000)
Races - Asian alone (%)
Races - Asian alone (% change since 2000)
Races - Hispanic (%)
Races - Hispanic (% change since 2000)
Races - Native Hawaiian and Other Pacific Islander alone (%)
Races - Native Hawaiian and Other Pacific Islander alone (% change since 2000)
Races - Two or more races(%)
Races - Two or more races(% change since 2000)
Races - Other race alone (%)
Races - Other race alone (% change since 2000)
Racial diversity
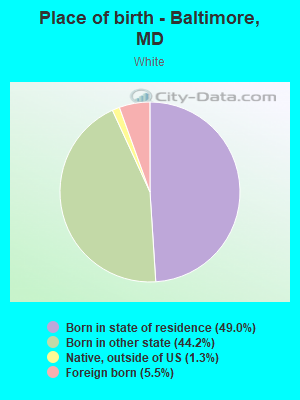
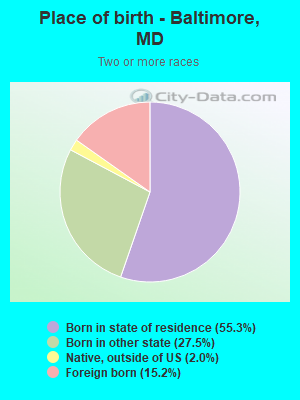
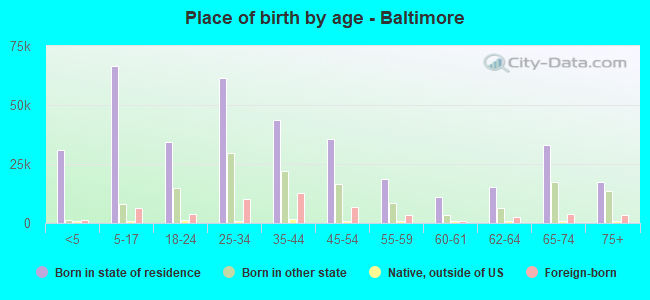
Place of birth - Born in state of residence (%)
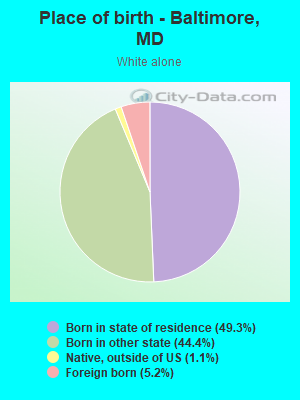
Place of birth - Born in state of residence (%) - White
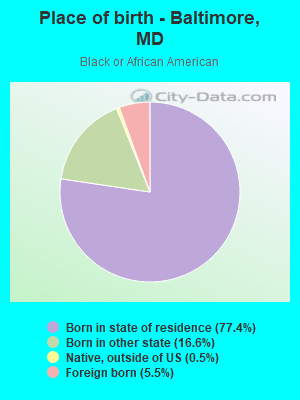
Place of birth - Born in state of residence (%) - Black or African American
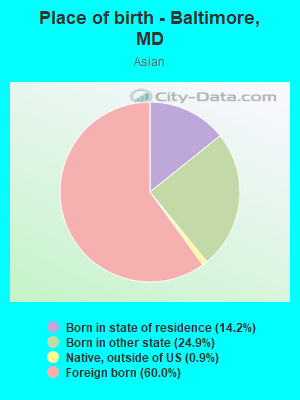
Place of birth - Born in state of residence (%) - Asian
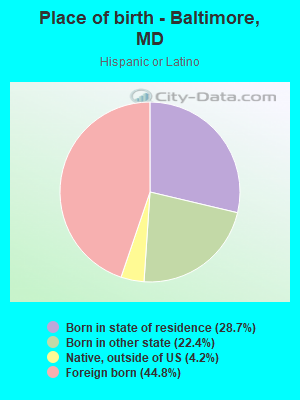
Place of birth - Born in state of residence (%) - Hispanic or Latino
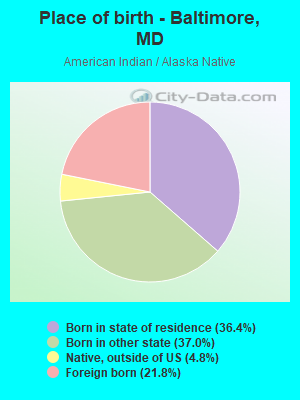
Place of birth - Born in state of residence (%) - American Indian and Alaska Native
Place of birth - Born in state of residence (%) - Multirace
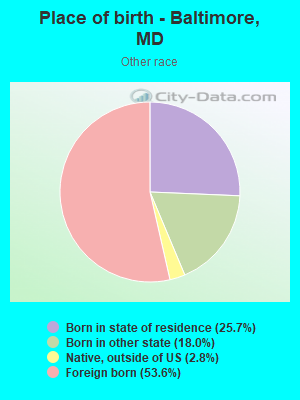
Place of birth - Born in state of residence (%) - Other Race
Place of birth - Born in other state (%)
Place of birth - Born in other state (%) - White
Place of birth - Born in other state (%) - Black or African American
Place of birth - Born in other state (%) - Asian
Place of birth - Born in other state (%) - Hispanic or Latino
Place of birth - Born in other state (%) - American Indian and Alaska Native
Place of birth - Born in other state (%) - Multirace
Place of birth - Born in other state (%) - Other Race
Place of birth - Native, outside of US (%)
Place of birth - Native, outside of US (%) - White
Place of birth - Native, outside of US (%) - Black or African American
Place of birth - Native, outside of US (%) - Asian
Place of birth - Native, outside of US (%) - Hispanic or Latino
Place of birth - Native, outside of US (%) - American Indian and Alaska Native
Place of birth - Native, outside of US (%) - Multirace
Place of birth - Native, outside of US (%) - Other Race
Place of birth - Foreign born (%)
Place of birth - Foreign born (%) - White
Place of birth - Foreign born (%) - Black or African American
Place of birth - Foreign born (%) - Asian
Place of birth - Foreign born (%) - Hispanic or Latino
Place of birth - Foreign born (%) - American Indian and Alaska Native
Place of birth - Foreign born (%) - Multirace
Place of birth - Foreign born (%) - Other Race
Residents speaking English at home (%)
Residents speaking English at home - Born in the United States (%)
Residents speaking English at home - Native, born elsewhere (%)
Residents speaking English at home - Foreign born (%)
Residents speaking Spanish at home (%)
Residents speaking Spanish at home - Born in the United States (%)
Residents speaking Spanish at home - Native, born elsewhere (%)
Residents speaking Spanish at home - Foreign born (%)
Residents speaking other language at home (%)
Residents speaking other language at home - Born in the United States (%)
Residents speaking other language at home - Native, born elsewhere (%)
Residents speaking other language at home - Foreign born (%)
Marital status - Never married (%)
Marital status - Now married (%)
Marital status - Separated (%)
Marital status - Widowed (%)
Marital status - Divorced (%)
Ancestries Reported - Arab (%)
Ancestries Reported - Czech (%)
Ancestries Reported - Danish (%)
Ancestries Reported - Dutch (%)
Ancestries Reported - English (%)
Ancestries Reported - French (%)
Ancestries Reported - French Canadian (%)
Ancestries Reported - German (%)
Ancestries Reported - Greek (%)
Ancestries Reported - Hungarian (%)
Ancestries Reported - Irish (%)
Ancestries Reported - Italian (%)
Ancestries Reported - Lithuanian (%)
Ancestries Reported - Norwegian (%)
Ancestries Reported - Polish (%)
Ancestries Reported - Portuguese (%)
Ancestries Reported - Russian (%)
Ancestries Reported - Scotch-Irish (%)
Ancestries Reported - Scottish (%)
Ancestries Reported - Slovak (%)
Ancestries Reported - Subsaharan African (%)
Ancestries Reported - Swedish (%)
Ancestries Reported - Swiss (%)
Ancestries Reported - Ukrainian (%)
Ancestries Reported - United States (%)
Ancestries Reported - Welsh (%)
Ancestries Reported - West Indian (%)
Ancestries Reported - Other (%)
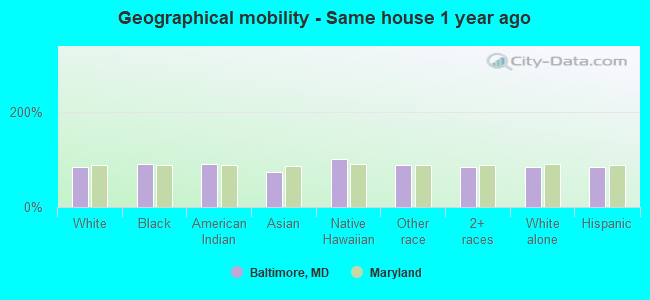
Geographical mobility - Same house 1 year ago (%)
Geographical mobility - Same house 1 year ago (%) - White
Geographical mobility - Same house 1 year ago (%) - Black or African American
Geographical mobility - Same house 1 year ago (%) - Asian
Geographical mobility - Same house 1 year ago (%) - Hispanic or Latino
Geographical mobility - Same house 1 year ago (%) - American Indian and Alaska Native
Geographical mobility - Same house 1 year ago (%) - Multirace
Geographical mobility - Same house 1 year ago (%) - Other Race
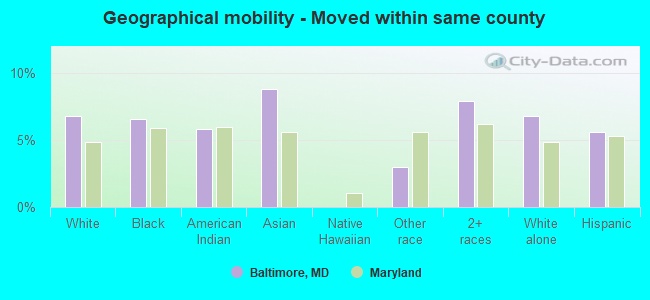
Geographical mobility - Moved within same county (%)
Geographical mobility - Moved within same county (%) - White
Geographical mobility - Moved within same county (%) - Black or African American
Geographical mobility - Moved within same county (%) - Asian
Geographical mobility - Moved within same county (%) - Hispanic or Latino
Geographical mobility - Moved within same county (%) - American Indian and Alaska Native
Geographical mobility - Moved within same county (%) - Multirace
Geographical mobility - Moved within same county (%) - Other Race
Geographical mobility - Moved from different county within same state (%)
Geographical mobility - Moved from different county within same state (%) - White
Geographical mobility - Moved from different county within same state (%) - Black or African American
Geographical mobility - Moved from different county within same state (%) - Asian
Geographical mobility - Moved from different county within same state (%) - Hispanic or Latino
Geographical mobility - Moved from different county within same state (%) - American Indian and Alaska Native
Geographical mobility - Moved from different county within same state (%) - Multirace
Geographical mobility - Moved from different county within same state (%) - Other Race
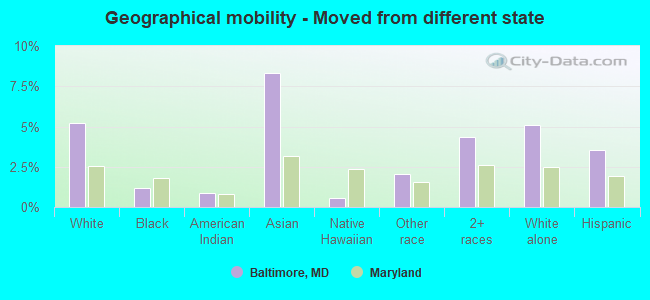
Geographical mobility - Moved from different state (%)
Geographical mobility - Moved from different state (%) - White
Geographical mobility - Moved from different state (%) - Black or African American
Geographical mobility - Moved from different state (%) - Asian
Geographical mobility - Moved from different state (%) - Hispanic or Latino
Geographical mobility - Moved from different state (%) - American Indian and Alaska Native
Geographical mobility - Moved from different state (%) - Multirace
Geographical mobility - Moved from different state (%) - Other Race
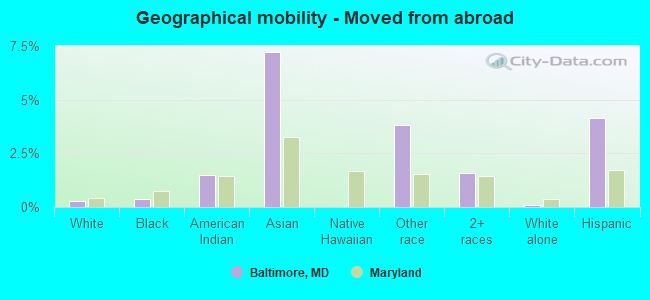
Geographical mobility - Moved from abroad (%)
Geographical mobility - Moved from abroad (%) - White
Geographical mobility - Moved from abroad (%) - Black or African American
Geographical mobility - Moved from abroad (%) - Asian
Geographical mobility - Moved from abroad (%) - Hispanic or Latino
Geographical mobility - Moved from abroad (%) - American Indian and Alaska Native
Geographical mobility - Moved from abroad (%) - Multirace
Geographical mobility - Moved from abroad (%) - Other Race
Place of birth for the foreign-born population - Ireland (%)
Place of birth for the foreign-born population - Denmark (%)
Place of birth for the foreign-born population - Norway (%)
Place of birth for the foreign-born population - Sweden (%)
Place of birth for the foreign-born population - United Kingdom (%)
Place of birth for the foreign-born population - England (%)
Place of birth for the foreign-born population - Scotland (%)
Place of birth for the foreign-born population - Other Northern Europe (%)
Place of birth for the foreign-born population - Austria (%)
Place of birth for the foreign-born population - Belgium (%)
Place of birth for the foreign-born population - France (%)
Place of birth for the foreign-born population - Germany (%)
Place of birth for the foreign-born population - Netherlands (%)
Place of birth for the foreign-born population - Switzerland (%)
Place of birth for the foreign-born population - Other Western Europe (%)
Place of birth for the foreign-born population - Greece (%)
Place of birth for the foreign-born population - Italy (%)
Place of birth for the foreign-born population - Portugal (%)
Place of birth for the foreign-born population - Spain (%)
Place of birth for the foreign-born population - Other Southern Europe (%)
Place of birth for the foreign-born population - Albania (%)
Place of birth for the foreign-born population - Belarus (%)
Place of birth for the foreign-born population - Bosnia and Herzegovina (%)
Place of birth for the foreign-born population - Bulgaria (%)
Place of birth for the foreign-born population - Croatia (%)
Place of birth for the foreign-born population - Czechoslovakia (%)
Place of birth for the foreign-born population - Hungary (%)
Place of birth for the foreign-born population - Latvia (%)
Place of birth for the foreign-born population - Lithuania (%)
Place of birth for the foreign-born population - North Macedonia (Macedonia) (%)
Place of birth for the foreign-born population - Moldova (%)
Place of birth for the foreign-born population - Poland (%)
Place of birth for the foreign-born population - Romania (%)
Place of birth for the foreign-born population - Russia (%)
Place of birth for the foreign-born population - Serbia (%)
Place of birth for the foreign-born population - Ukraine (%)
Place of birth for the foreign-born population - Other Eastern Europe (%)
Place of birth for the foreign-born population - China (%)
Place of birth for the foreign-born population - Hong Kong (%)
Place of birth for the foreign-born population - Taiwan (%)
Place of birth for the foreign-born population - Japan (%)
Place of birth for the foreign-born population - Korea (%)
Place of birth for the foreign-born population - Other Eastern Asia (%)
Place of birth for the foreign-born population - Afghanistan (%)
Place of birth for the foreign-born population - Bangladesh (%)
Place of birth for the foreign-born population - India (%)
Place of birth for the foreign-born population - Iran (%)
Place of birth for the foreign-born population - Kazakhstan (%)
Place of birth for the foreign-born population - Nepal (%)
Place of birth for the foreign-born population - Pakistan (%)
Place of birth for the foreign-born population - Sri Lanka (%)
Place of birth for the foreign-born population - Uzbekistan (%)
Place of birth for the foreign-born population - Other South Central Asia (%)
Place of birth for the foreign-born population - Burma (%)
Place of birth for the foreign-born population - Cambodia (%)
Place of birth for the foreign-born population - Indonesia (%)
Place of birth for the foreign-born population - Laos (%)
Place of birth for the foreign-born population - Malaysia (%)
Place of birth for the foreign-born population - Philippines (%)
Place of birth for the foreign-born population - Singapore (%)
Place of birth for the foreign-born population - Thailand (%)
Place of birth for the foreign-born population - Vietnam (%)
Place of birth for the foreign-born population - Other South Eastern Asia (%)
Place of birth for the foreign-born population - Armenia (%)
Place of birth for the foreign-born population - Iraq (%)
Place of birth for the foreign-born population - Israel (%)
Place of birth for the foreign-born population - Jordan (%)
Place of birth for the foreign-born population - Kuwait (%)
Place of birth for the foreign-born population - Lebanon (%)
Place of birth for the foreign-born population - Saudi Arabia (%)
Place of birth for the foreign-born population - Syria (%)
Place of birth for the foreign-born population - Turkey (%)
Place of birth for the foreign-born population - Yemen (%)
Place of birth for the foreign-born population - Other Western Asia (%)
Place of birth for the foreign-born population - Eritrea (%)
Place of birth for the foreign-born population - Ethiopia (%)
Place of birth for the foreign-born population - Kenya (%)
Place of birth for the foreign-born population - Somalia (%)
Place of birth for the foreign-born population - Uganda (%)
Place of birth for the foreign-born population - Zimbabwe (%)
Place of birth for the foreign-born population - Other Eastern Africa (%)
Place of birth for the foreign-born population - Cameroon (%)
Place of birth for the foreign-born population - Congo (%)
Place of birth for the foreign-born population - Democratic Republic of Congo (Zaire) (%)
Place of birth for the foreign-born population - Other Middle Africa (%)
Place of birth for the foreign-born population - Egypt (%)
Place of birth for the foreign-born population - Morocco (%)
Place of birth for the foreign-born population - Sudan (%)
Place of birth for the foreign-born population - Other Northern Africa (%)
Place of birth for the foreign-born population - South Africa (%)
Place of birth for the foreign-born population - Other Southern Africa (%)
Place of birth for the foreign-born population - Cabo Verde (%)
Place of birth for the foreign-born population - Ghana (%)
Place of birth for the foreign-born population - Liberia (%)
Place of birth for the foreign-born population - Nigeria (%)
Place of birth for the foreign-born population - Senegal (%)
Place of birth for the foreign-born population - Sierra Leone (%)
Place of birth for the foreign-born population - Other Western Africa (%)
Place of birth for the foreign-born population - Australia (%)
Place of birth for the foreign-born population - New Zealand (%)
Place of birth for the foreign-born population - Fiji (%)
Place of birth for the foreign-born population - Micronesia (%)
Place of birth for the foreign-born population - Bahamas (%)
Place of birth for the foreign-born population - Barbados (%)
Place of birth for the foreign-born population - Cuba (%)
Place of birth for the foreign-born population - Dominica (%)
Place of birth for the foreign-born population - Dominican Republic (%)
Place of birth for the foreign-born population - Grenada (%)
Place of birth for the foreign-born population - Haiti (%)
Place of birth for the foreign-born population - Jamaica (%)
Place of birth for the foreign-born population - St. Vincent and the Grenadines (%)
Place of birth for the foreign-born population - Trinidad and Tobago (%)
Place of birth for the foreign-born population - West Indies (%)
Place of birth for the foreign-born population - Other Caribbean (%)
Place of birth for the foreign-born population - Belize (%)
Place of birth for the foreign-born population - Costa Rica (%)
Place of birth for the foreign-born population - El Salvador (%)
Place of birth for the foreign-born population - Guatemala (%)
Place of birth for the foreign-born population - Honduras (%)
Place of birth for the foreign-born population - Mexico (%)
Place of birth for the foreign-born population - Nicaragua (%)
Place of birth for the foreign-born population - Panama (%)
Place of birth for the foreign-born population - Other Central America (%)
Place of birth for the foreign-born population - Argentina (%)
Place of birth for the foreign-born population - Bolivia (%)
Place of birth for the foreign-born population - Brazil (%)
Place of birth for the foreign-born population - Chile (%)
Place of birth for the foreign-born population - Colombia (%)
Place of birth for the foreign-born population - Ecuador (%)
Place of birth for the foreign-born population - Guyana (%)
Place of birth for the foreign-born population - Peru (%)
Place of birth for the foreign-born population - Uruguay (%)
Place of birth for the foreign-born population - Venezuela (%)
Place of birth for the foreign-born population - Other South America (%)
Place of birth for the foreign-born population - Canada (%)
Place of birth for the foreign-born population - Other Northern America (%)
Place of birth for the foreign-born population - Other (%)
Latest news about races in Baltimore, MD collected exclusively by city-data.com from local newspapers, TV, and radio stations
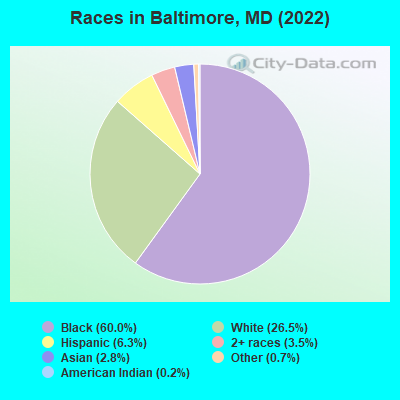
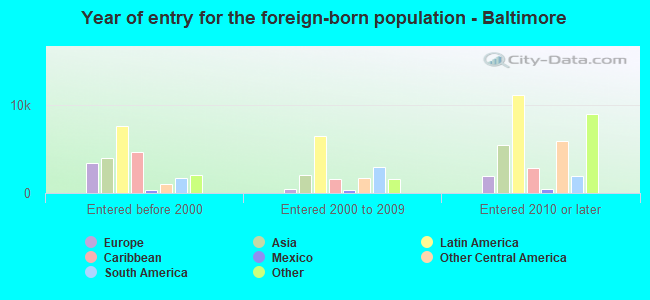
According to 2022 data, the most numerous races in Baltimore, MD are White alone (150,907 residents), Black alone (341,761 residents), and Hispanic (36,124 residents). 89.0% of Baltimore residents speak English at home. 8.9% of Baltimore, MD residents are foreign-born (3.2% born in Latin America, 2.2% born in Asia, 1.8% born in Africa), which is 79.6% less than the foreign-born rate of 16.0% across the entire state of Maryland.
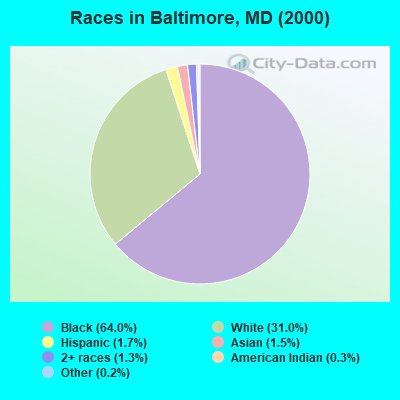
Race distribution in Baltimore
2000 2022
417,009 64.0% Black alone 201,566 31.0% White alone 11,061 1.7% Hispanic 9,824 1.5% Asian alone 8,412 1.3% Two or more races 1,946 0.3% American Indian alone 1,143 0.2% Other race alone 193 0.03% Native Hawaiian and Other
341,761 60.0% Black alone 150,907 26.5% White alone 36,124 6.3% Hispanic 19,785 3.5% Two or more races 15,944 2.8% Asian alone 4,022 0.7% Other race alone 993 0.2% American Indian alone 395 0.07% Native Hawaiian and Other
2000 2022
3,286,547 62.1% White alone 1,464,735 27.7% Black alone 227,916 4.3% Hispanic 209,738 4.0% Asian alone 82,946 1.6% Two or more races 13,312 0.3% American Indian alone 9,379 0.2% Other race alone 1,913 0.04% Native Hawaiian and Other
2,906,492 47.1% White alone 1,800,914 29.2% Black alone 705,842 11.4% Hispanic 401,818 6.5% Asian alone 291,317 4.7% Two or more races 46,930 0.8% Other race alone 8,930 0.1% American Indian alone 2,417 0.04% Native Hawaiian and Other
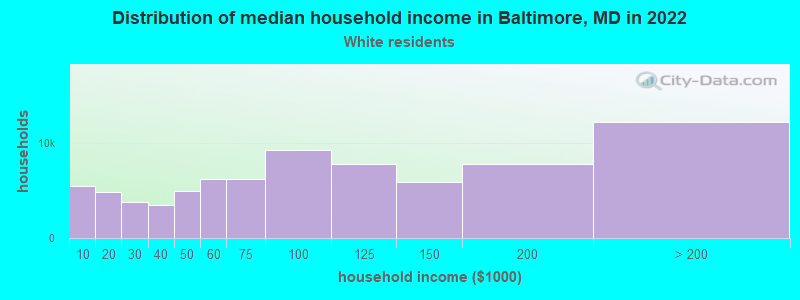
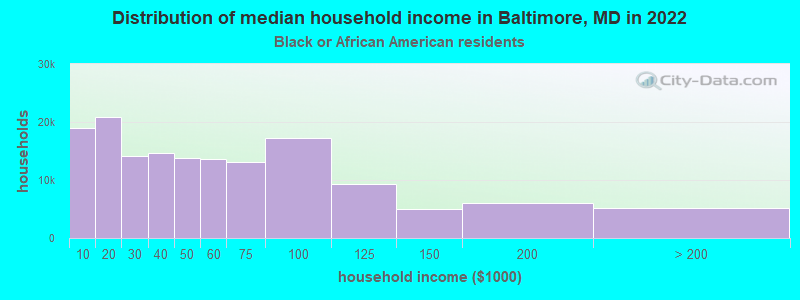
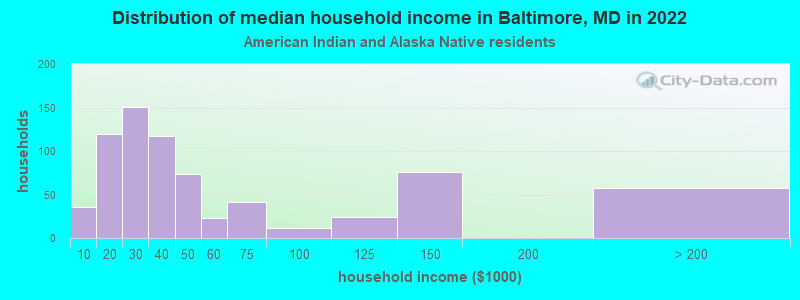
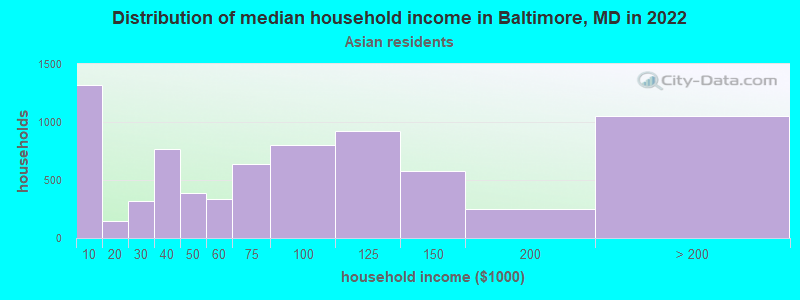
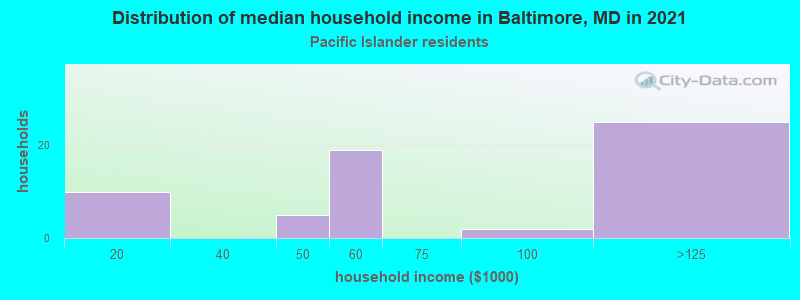
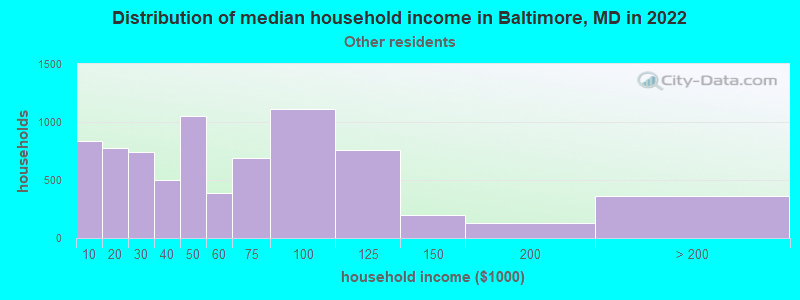
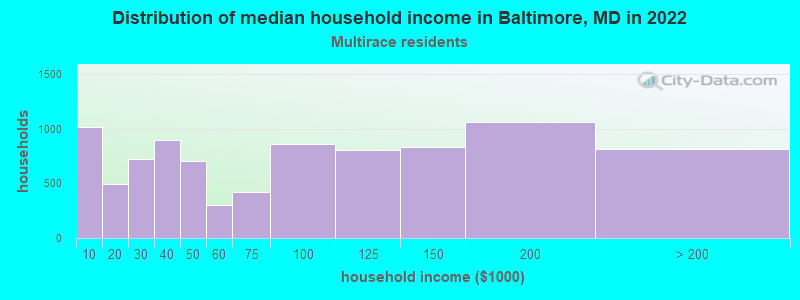
Income and house value in Baltimore Median household income in 2022 $85,625 White non-Hispanic householders$45,420 Black householders$40,753 American Indian and Alaska Native householders$71,655 Asian householders$48,745 Some other race householders$70,164 Two or more races householders$60,030 Hispanic or Latino race householdersMedian 2022 house value $235,271 White Non-Hispanic householders$191,646 Black or African American householders$218,122 American Indian or Alaska Native householders $253,322 Asian householders$278,293 Native Hawaiian and other Pacific Islander householders$230,457 Some other race householders$209,096 Two or more races householders$250,615 Hispanic or Latino householders
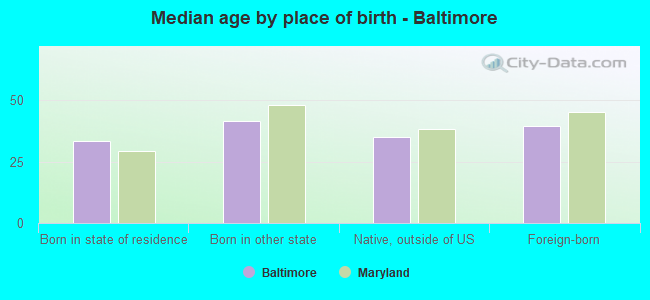
Median age by race in Baltimore
37.8 Median age for White residents37.9 37.7 38.3 Median age for Black or African American residents34.7 40.0 44.0 Median age for American Indian / Alaska Native residents52.1 43.6 32.2 Median age for Asian residents32.1 32.3 28.4 Median age for Native Hawaiian / Pacific Islander residents28.2 -666,666,666.0 27.9 Median age for Other race residents22.6 29.1 26.9 Median age for Two or more races residents29.6 24.1 37.9 Median age for White alone residents38.2 37.7 27.1 Median age for Hispanic or Latino residents26.8 27.4
Owner/renter occupied households by race in Baltimore
House owners and renters - White residents 48,466 62.0% Owner occupied29,753 38.0% Renter occupiedHouse owners and renters - Black or African American residents 63,875 42.0% Owner occupied88,083 58.0% Renter occupiedHouse owners and renters - American Indian / Alaska Native residents 214 46.9% Owner occupied242 53.1% Renter occupiedHouse owners and renters - Asian residents 2,467 32.8% Owner occupied5,047 67.2% Renter occupiedHouse owners and renters - Native Hawaiian / Pacific Islander residents 9 17.4% Owner occupied45 82.6% Renter occupiedHouse owners and renters - Other race residents 2,561 33.9% Owner occupied4,990 66.1% Renter occupiedHouse owners and renters - Two or more races residents 3,634 40.8% Owner occupied5,277 59.2% Renter occupiedHouse owners and renters - White alone residents 47,747 62.6% Owner occupied28,536 37.4% Renter occupiedHouse owners and renters - Hispanic or Latino residents 3,768 36.3% Owner occupied6,602 63.7% Renter occupied
Language usage in Baltimore
English speakers - Total 89.0% of residents of Baltimore speak English at home.
4.7% of residents speak Spanish at home 12,914 50.8% Speak English very well12,500 49.2% Speak English less than very well6.2% of residents speak other language at home 21,096 63.0% Speak English very well12,371 37.0% Speak English less than very well
English speakers - Born in the United States 93.0% of residents of Baltimore speak English at home.
3.2% of residents speak Spanish at home 3,855 85.2% Speak English very well669 14.8% Speak English less than very well3.8% of residents speak other language at home 4,402 82.6% Speak English very well929 17.4% Speak English less than very well
English speakers - Native, born elsewhere 62.6% of residents of Baltimore speak English at home.
23.4% of residents speak Spanish at home 513 40.9% Speak English very well740 59.1% Speak English less than very well14.1% of residents speak other language at home 665 88.3% Speak English very well88 11.7% Speak English less than very well
English speakers - Foreign-born 30.7% of residents of Baltimore speak English at home.
26.1% of residents speak Spanish at home 4,921 35.1% Speak English very well9,114 64.9% Speak English less than very well43.2% of residents speak other language at home 13,298 57.1% Speak English very well9,992 42.9% Speak English less than very well
White (Caucasian) - Speak only English Native:
95.8% (132,820)Foreign-born:
38.0% (3,182)
White (Caucasian) - Speak another language Native:
4.2% (5,828)Foreign-born:
62.0% (5,197)
Black or African American - Speak only English Native:
98.2% (301,797)Foreign-born:
48.2% (8,819)
Black or African American - Speak another language Native:
1.8% (5,546)Foreign-born:
51.8% (9,489)
American Indian / Alaska Native - Speak only English Native:
53.5% (864)Foreign-born:
6.8% (35)
American Indian / Alaska Native - Speak another language Native:
50.3% (812)Foreign-born:
90.2% (468)
Asian - Speak only English Native:
60.7% (3,581)Foreign-born:
16.8% (1,619)
Asian - Speak another language Native:
39.3% (2,316)Foreign-born:
83.2% (8,037)
Native Hawaiian / Pacific Islander - Speak only English Native:
40.0% (71)Foreign-born:
34.8% (6)
Native Hawaiian / Pacific Islander - Speak another language Native:
58.3% (103)Foreign-born:
64.1% (10)
Other race - Speak only English Native:
44.8% (3,819)Foreign-born:
14.4% (1,873)
Other race - Speak another language Native:
55.2% (4,713)Foreign-born:
85.6% (11,106)
Two or more races - Speak only English Native:
88.0% (17,821)Foreign-born:
23.5% (941)
Two or more races - Speak another language Native:
12.0% (2,424)Foreign-born:
76.5% (3,065)
White alone - Speak only English Native:
96.2% (131,303)Foreign-born:
41.4% (3,182)
White alone - Speak another language Native:
3.8% (5,157)Foreign-born:
58.6% (4,505)
Hispanic or Latino - Speak only English Native:
48.2% (7,466)Foreign-born:
10.4% (1,646)
Hispanic or Latino - Speak another language Native:
51.8% (8,018)Foreign-born:
89.6% (14,125)
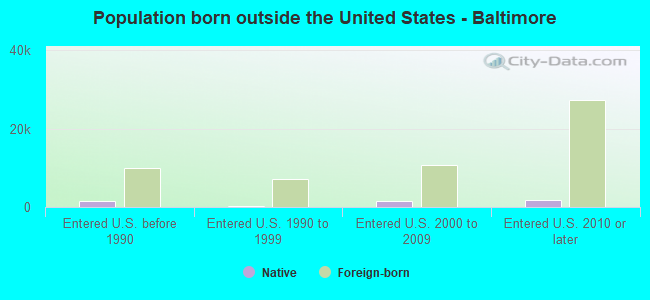
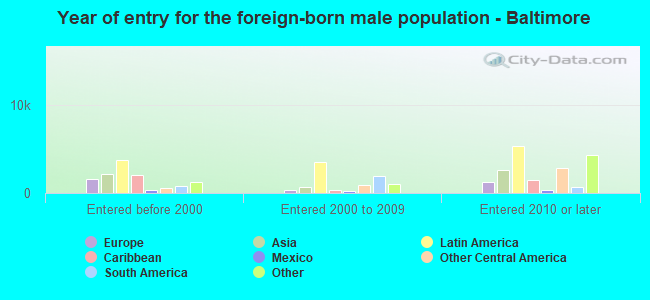
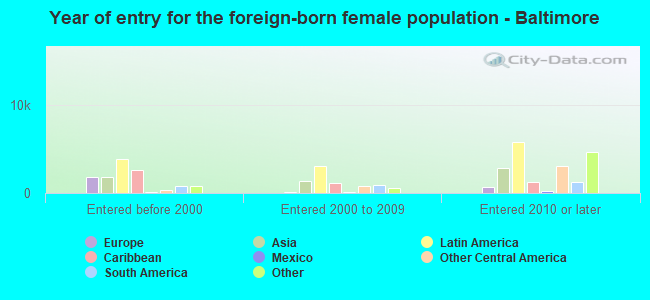
Foreign-born residents in Baltimore 50,767 residents are foreign born (3.2% Latin America , 2.2% Asia , 1.8% Africa ).
This city:
8.9%Maryland:
15.7%
Marital status for residents in Baltimore Marital status - White (Caucasian) population 15 years and over
Males 47.3% Never married39.1% Now married2.0% Separated2.4% Widowed9.2% DivorcedFemales 42.5% Never married37.9% Now married1.4% Separated8.3% Widowed9.8% DivorcedWomen who gave birth in the past 12 months Now married:
73.4% (1,654)Unmarried:
26.6% (599)
Women who did not give birth in the past 12 months Now married:
33.4% (13,995)Unmarried:
66.6% (27,906)
Marital status - Black or African American population 15 years and over
Males 59.3% Never married23.3% Now married3.3% Separated2.5% Widowed11.5% DivorcedFemales 55.0% Never married20.4% Now married3.5% Separated9.7% Widowed11.4% DivorcedWomen who gave birth in the past 12 months Now married:
42.0% (1,863)Unmarried:
58.0% (2,571)
Women who did not give birth in the past 12 months Now married:
19.4% (16,547)Unmarried:
80.6% (68,597)
Marital status - American Indian / Alaska Native population 15 years and over
Males 33.0% Never married24.2% Now married3.9% Separated12.6% Widowed26.3% DivorcedFemales 50.0% Never married27.3% Now married3.4% Separated2.7% Widowed16.6% DivorcedWomen who gave birth in the past 12 months Now married:
0.0% (0)Unmarried:
100.0% (51)
Women who did not give birth in the past 12 months Now married:
35.8% (233)Unmarried:
64.2% (419)
Marital status - Asian population 15 years and over
Males 55.4% Never married36.9% Now married1.9% Separated1.4% Widowed4.5% DivorcedFemales 48.3% Never married38.9% Now married1.6% Separated6.0% Widowed5.1% DivorcedWomen who gave birth in the past 12 months Now married:
100.0% (481)Unmarried:
0.0% (0)
Women who did not give birth in the past 12 months Now married:
31.9% (1,621)Unmarried:
68.1% (3,453)
Marital status - Native Hawaiian / Pacific Islander population 15 years and over
Males 23.9% Never married72.6% Now married0.0% Separated0.0% Widowed3.4% DivorcedFemales 72.2% Never married27.8% Now married0.0% Separated0.0% Widowed0.0% DivorcedWomen who did not give birth in the past 12 months Now married:
68.2% (16)Unmarried:
31.8% (7)
Marital status - Other race population 15 years and over
Males 59.6% Never married35.8% Now married0.0% Separated3.3% Widowed1.3% DivorcedFemales 38.6% Never married42.3% Now married6.5% Separated2.9% Widowed9.8% DivorcedWomen who gave birth in the past 12 months Now married:
57.6% (418)Unmarried:
42.4% (308)
Women who did not give birth in the past 12 months Now married:
47.3% (2,575)Unmarried:
52.7% (2,865)
Marital status - Two or more races population 15 years and over
Males 44.9% Never married45.3% Now married1.8% Separated0.7% Widowed7.3% DivorcedFemales 51.1% Never married28.6% Now married3.2% Separated9.2% Widowed7.9% DivorcedWomen who gave birth in the past 12 months Now married:
67.7% (228)Unmarried:
32.3% (109)
Women who did not give birth in the past 12 months Now married:
24.0% (1,469)Unmarried:
76.0% (4,662)
Marital status - White alone, not Hispanic / Latino population 15 years and over
Males 47.1% Never married39.4% Now married2.0% Separated2.5% Widowed9.1% DivorcedFemales 42.0% Never married38.5% Now married1.3% Separated8.2% Widowed10.0% DivorcedWomen who gave birth in the past 12 months Now married:
73.4% (1,654)Unmarried:
26.6% (599)
Women who did not give birth in the past 12 months Now married:
33.6% (13,569)Unmarried:
66.4% (26,853)
Marital status - Hispanic or Latino population 15 years and over
Males 53.9% Never married40.5% Now married0.0% Separated2.3% Widowed3.3% DivorcedFemales 50.6% Never married37.6% Now married3.7% Separated3.1% Widowed5.0% DivorcedWomen who gave birth in the past 12 months Now married:
45.0% (468)Unmarried:
55.0% (571)
Women who did not give birth in the past 12 months Now married:
41.8% (3,394)Unmarried:
58.2% (4,733)
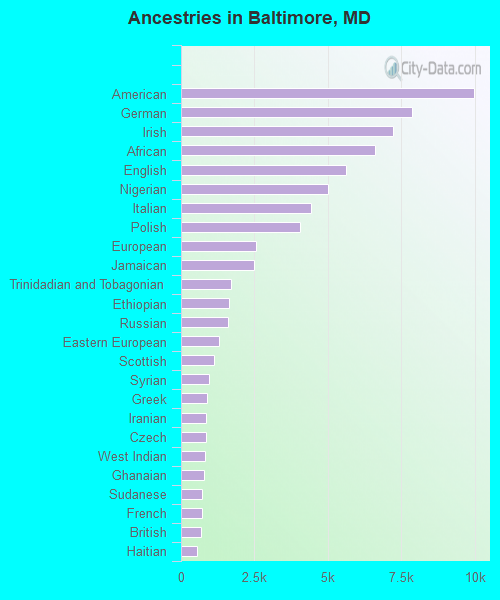
Ancestries in Baltimore
9,993 2.7% American7,866 2.1% German7,210 2.0% Irish6,610 1.8% African5,619 1.5% English5,014 1.4% Nigerian4,437 1.2% Italian4,041 1.1% Polish2,551 0.7% European2,475 0.7% Jamaican1,715 0.5% Trinidadian and Tobagonian1,649 0.5% Ethiopian1,600 0.4% Russian1,285 0.4% Eastern European1,118 0.3% Scottish940 0.3% Syrian871 0.2% Greek855 0.2% Iranian852 0.2% Czech810 0.2% West Indian771 0.2% Ghanaian731 0.2% Sudanese705 0.2% French677 0.2% British552 0.2% Haitian506 0.1% Hungarian500 0.1% Scotch-Irish465 0.1% Swedish462 0.1% Kenyan457 0.1% Brazilian448 0.1% Ukrainian428 0.1% Guyanese274 0.07% Egyptian254 0.07% Norwegian233 0.06% Northern European209 0.06% Moroccan209 0.06% Lebanese204 0.06% Swiss203 0.06% Liberian196 0.05% Canadian195 0.05% Lithuanian194 0.05% Romanian194 0.05% Iraqi184 0.05% Barbadian182 0.05% Turkish177 0.05% Arab175 0.05% Portuguese163 0.04% Dutch154 0.04% Welsh148 0.04% Scandinavian138 0.04% Danish131 0.04% Belgian128 0.03% Finnish116 0.03% Slovak110 0.03% Austrian108 0.03% Sierra Leonean103 0.03% Armenian82 0.02% Yugoslavian77 0.02% Israeli74 0.02% Cajun73 0.02% Bahamian72 0.02% French Canadian62 0.02% Latvian62 0.02% Czechoslovakian61 0.02% Palestinian57 0.02% British West Indian50 0.01% Zimbabwean50 0.01% Serbian49 0.01% Dutch West Indian49 0.01% Slavic46 0.01% Bulgarian44 0.01% South African43 0.01% Afghan42 0.01% Jordanian38 0.01% Cape Verdean38 0.01% Maltese32 0.01% Croatian29 0.01% Pennsylvania German28 0.01% Ugandan22 0.01% U.S. Virgin Islander
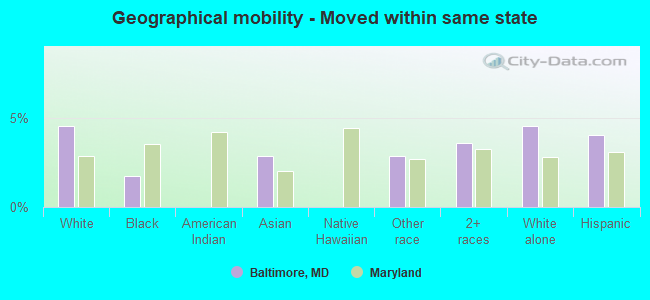
Geographical mobility in Baltimore Same house 1 year ago 126,924 83.1% White (Caucasian)308,459 90.2% Black or African American2,125 90.6% American Indian / Alaska Native11,475 72.8% Asian193 100.0% Native Hawaiian / Pacific Islander20,519 88.3% Other race22,649 82.6% Two or more races124,697 83.5% White alone, not Hispanic / Latino28,427 82.6% Hispanic or LatinoMoved within same county 10,373 6.8% White / Caucasian22,356 6.5% Black or African American137 5.8% American Indian / Alaska Native1,388 8.8% Asian695 3.0% Other race2,176 7.9% Two or more races10,181 6.8% White alone, not Hispanic / Latino1,933 5.6% Hispanic or LatinoMoved within same state 6,948 4.6% White / Caucasian5,948 1.7% Black or African American446 2.8% Asian668 2.9% Other race985 3.6% Two or more races6,797 4.5% White alone, not Hispanic / Latino1,394 4.1% Hispanic or LatinoMoved from different state 7,969 5.2% White / Caucasian4,140 1.2% Black or African American20 0.9% American Indian / Alaska Native1,312 8.3% Asian1 0.5% Native Hawaiian / Pacific Islander473 2.0% Other race1,188 4.3% Two or more races7,614 5.1% White alone, not Hispanic / Latino1,220 3.5% Hispanic or LatinoMoved from abroad 446 0.3% White1,224 0.4% Black or African American35 1.5% American Indian / Alaska Native1,139 7.2% Asian885 3.8% Other race436 1.6% Two or more races131 0.1% White alone, not Hispanic / Latino1,428 4.2% Hispanic or Latino
Children Nativity (place of birth) in Baltimore
Children under 6 years - Living with two parents Both parents native 15,477 100.0% NativeBoth parents foreign-born 2,008 62.5% Native1,203 37.5% Foreign-bornOne native, one foreign-born parent 3,068 98.1% Native61 1.9% Foreign-bornChildren under 6 years - Living with one parent Native parent 15,866 100.0% NativeForeign-born parent 1,729 95.0% Native91 5.0% Foreign-bornChildren 6 to 17 years - Living with two parents Both parents native 19,381 99.7% Native58 0.3% Foreign-bornBoth parents foreign-born 2,207 45.9% Native2,598 54.1% Foreign-bornOne native, one foreign-born parent 3,787 86.6% Native584 13.4% Foreign-bornChildren 6 to 17 years - Living with one parent Native parent 35,085 98.5% Native538 1.5% Foreign-bornForeign-born parent 2,872 70.2% Native1,217 29.8% Foreign-born
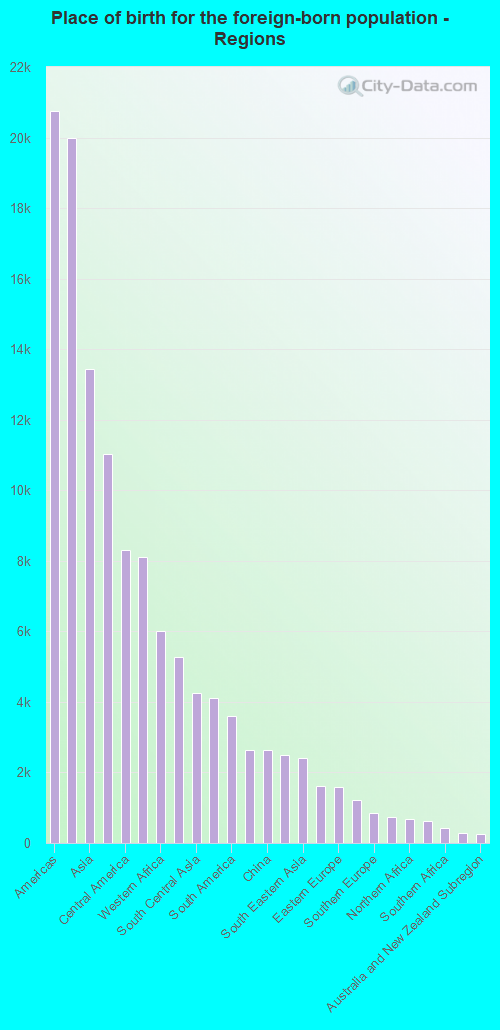
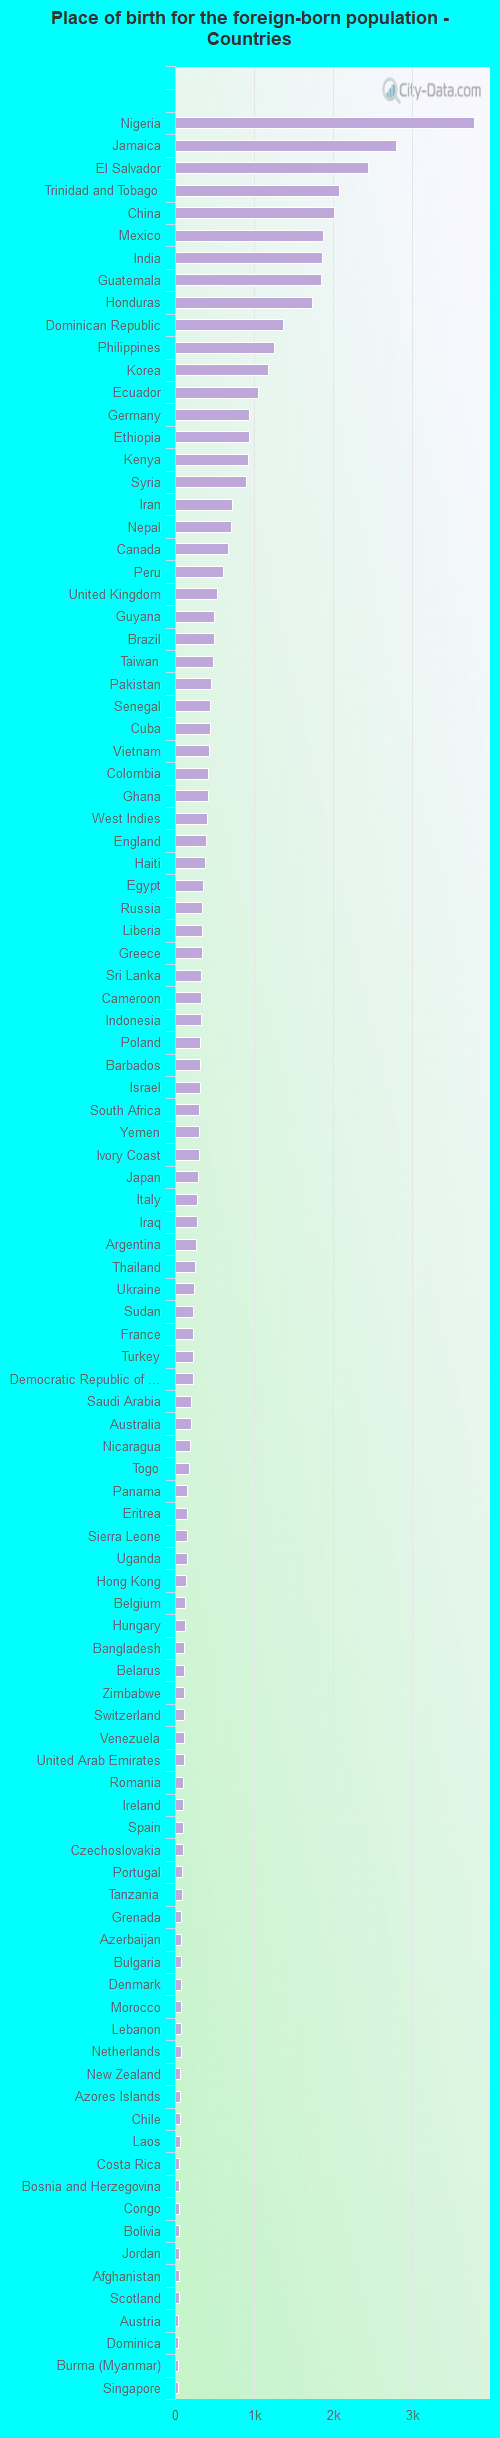
Place of birth for residents in Baltimore 20,741 Americas19,997 Latin America13,446 Asia11,028 Africa8,306 Central America8,101 Caribbean6,002 Western Africa5,268 Europe4,250 South Central Asia4,101 Eastern Asia3,589 South America2,642 Western Asia2,633 China2,505 Eastern Africa2,421 South Eastern Asia1,624 Western Europe1,583 Eastern Europe1,221 Northern Europe839 Southern Europe744 Northern America684 Northern Africa623 Middle Africa435 Southern Africa281 Oceania263 Australia and New Zealand Subregion3,784 Nigeria2,792 Jamaica2,446 El Salvador2,069 Trinidad and Tobago2,009 China1,877 Mexico1,863 India1,844 Guatemala1,736 Honduras1,367 Dominican Republic1,259 Philippines1,174 Korea1,053 Ecuador934 Germany934 Ethiopia925 Kenya893 Syria715 Iran709 Nepal665 Canada605 Peru530 United Kingdom495 Guyana494 Brazil484 Taiwan461 Pakistan448 Senegal445 Cuba426 Vietnam420 Colombia418 Ghana409 West Indies391 England381 Haiti350 Egypt345 Russia343 Liberia338 Greece334 Sri Lanka326 Cameroon325 Indonesia315 Poland313 Barbados312 Israel301 South Africa301 Yemen299 Ivory Coast294 Japan281 Italy273 Iraq260 Argentina251 Thailand243 Ukraine232 Sudan225 France225 Turkey223 Democratic Republic of Congo (Zaire)201 Saudi Arabia200 Australia184 Nicaragua179 Togo154 Panama149 Eritrea148 Sierra Leone146 Uganda139 Hong Kong131 Belgium126 Hungary118 Bangladesh116 Belarus114 Zimbabwe114 Switzerland111 Venezuela109 United Arab Emirates104 Romania104 Ireland102 Spain97 Czechoslovakia92 Portugal90 Tanzania82 Grenada81 Azerbaijan77 Bulgaria77 Denmark75 Morocco73 Lebanon70 Netherlands62 New Zealand61 Azores Islands61 Chile57 Laos53 Costa Rica51 Bosnia and Herzegovina51 Congo51 Bolivia50 Jordan47 Afghanistan45 Scotland43 Austria41 Dominica39 Burma (Myanmar)38 Singapore29 Serbia26 Kuwait25 Armenia24 Bahamas23 Malaysia18 Latvia17 St. Vincent and the Grenadines12 Sweden8 Belize8 Georgia6 Croatia6 St. Lucia
Grandparents responsible for own grandchildren in Baltimore
Grandparents (30 to 59 years) White / Caucasian 126 37.0% Responsible for grandchildren214 63.0% Not responsible for grandchildrenBlack or African American 1,451 53.6% Responsible for grandchildren1,258 46.4% Not responsible for grandchildrenAmerican Indian / Alaska Native 45 100.0% Not responsible for grandchildrenAsian 7 54.8% Responsible for grandchildren6 45.2% Not responsible for grandchildrenOther race 105 65.8% Responsible for grandchildren54 34.2% Not responsible for grandchildrenTwo or more races 73 100.0% Not responsible for grandchildrenWhite alone, not Hispanic / Latino 117 39.3% Responsible for grandchildren181 60.7% Not responsible for grandchildrenHispanic or Latino 128 50.0% Responsible for grandchildren128 50.0% Not responsible for grandchildrenGrandparents (60 years and over) White / Caucasian 275 31.3% Responsible for grandchildren604 68.7% Not responsible for grandchildrenBlack or African American 1,170 35.0% Responsible for grandchildren2,176 65.0% Not responsible for grandchildrenAmerican Indian / Alaska Native 17 100.0% Not responsible for grandchildrenAsian 49 29.2% Responsible for grandchildren120 70.8% Not responsible for grandchildrenOther race 237 100.0% Not responsible for grandchildrenTwo or more races 115 35.4% Responsible for grandchildren209 64.6% Not responsible for grandchildrenWhite alone, not Hispanic / Latino 274 30.4% Responsible for grandchildren629 69.6% Not responsible for grandchildrenHispanic or Latino 58 18.3% Responsible for grandchildren257 81.7% Not responsible for grandchildren
Zip codes: 21201 , 21202 , 21205 , 21206 , 21207 , 21208 , 21209 , 21210 , 21211 , 21212 , 21213 , 21214 , 21215 , 21216 , 21217 , 21218 , 21222 , 21223 , 21224 , 21225 , 21226 , 21230 , 21231 , 21234 , 21236 , 21237 , 21239 , 21251 .