Races in Balcones Heights, Texas (TX) Detailed Stats
Data:
Races - White alone (%)
Races - White alone (% change since 2000)
Races - Black alone (%)
Races - Black alone (% change since 2000)
Races - American Indian alone (%)
Races - American Indian alone (% change since 2000)
Races - Asian alone (%)
Races - Asian alone (% change since 2000)
Races - Hispanic (%)
Races - Hispanic (% change since 2000)
Races - Native Hawaiian and Other Pacific Islander alone (%)
Races - Native Hawaiian and Other Pacific Islander alone (% change since 2000)
Races - Two or more races(%)
Races - Two or more races(% change since 2000)
Races - Other race alone (%)
Races - Other race alone (% change since 2000)
Racial diversity
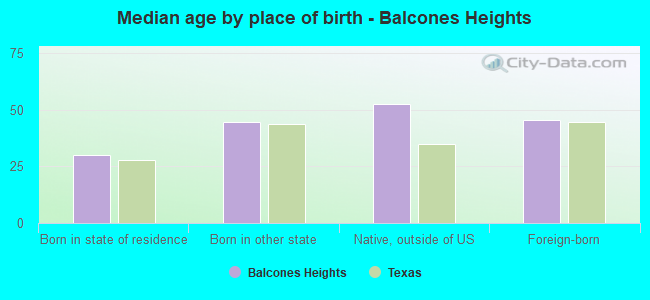
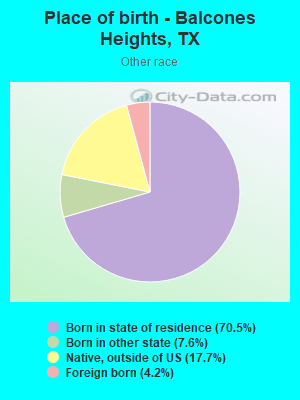
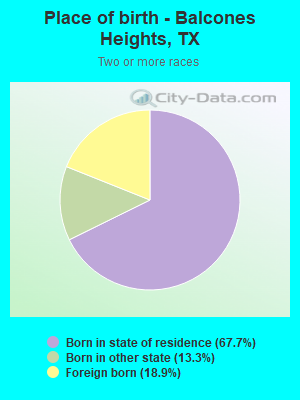
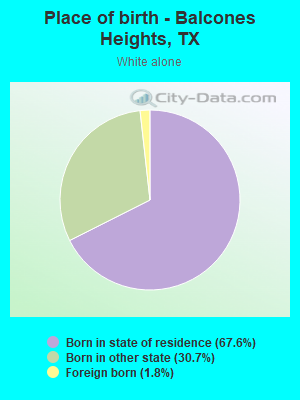
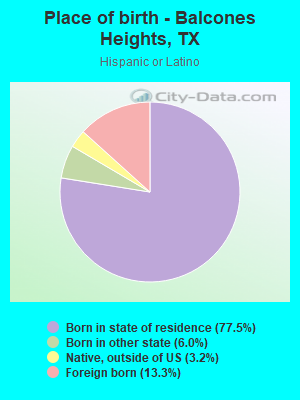
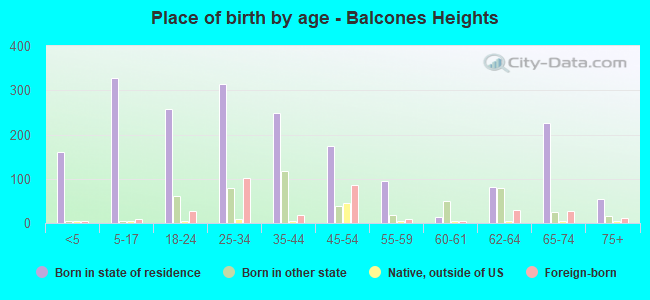
Place of birth - Born in state of residence (%)
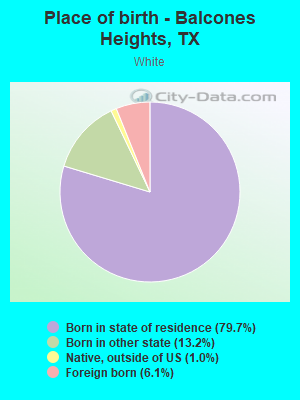
Place of birth - Born in state of residence (%) - White
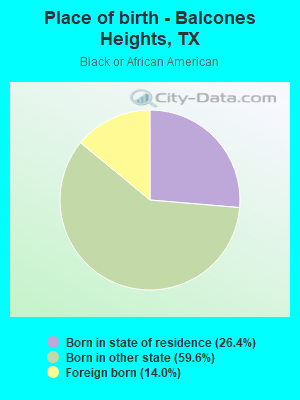
Place of birth - Born in state of residence (%) - Black or African American
Place of birth - Born in state of residence (%) - Asian
Place of birth - Born in state of residence (%) - Hispanic or Latino
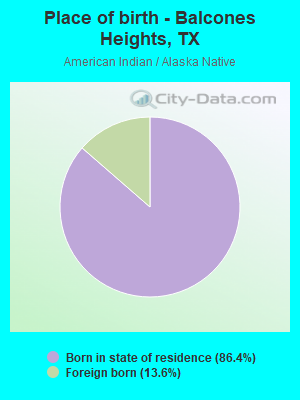
Place of birth - Born in state of residence (%) - American Indian and Alaska Native
Place of birth - Born in state of residence (%) - Multirace
Place of birth - Born in state of residence (%) - Other Race
Place of birth - Born in other state (%)
Place of birth - Born in other state (%) - White
Place of birth - Born in other state (%) - Black or African American
Place of birth - Born in other state (%) - Asian
Place of birth - Born in other state (%) - Hispanic or Latino
Place of birth - Born in other state (%) - American Indian and Alaska Native
Place of birth - Born in other state (%) - Multirace
Place of birth - Born in other state (%) - Other Race
Place of birth - Native, outside of US (%)
Place of birth - Native, outside of US (%) - White
Place of birth - Native, outside of US (%) - Black or African American
Place of birth - Native, outside of US (%) - Asian
Place of birth - Native, outside of US (%) - Hispanic or Latino
Place of birth - Native, outside of US (%) - American Indian and Alaska Native
Place of birth - Native, outside of US (%) - Multirace
Place of birth - Native, outside of US (%) - Other Race
Place of birth - Foreign born (%)
Place of birth - Foreign born (%) - White
Place of birth - Foreign born (%) - Black or African American
Place of birth - Foreign born (%) - Asian
Place of birth - Foreign born (%) - Hispanic or Latino
Place of birth - Foreign born (%) - American Indian and Alaska Native
Place of birth - Foreign born (%) - Multirace
Place of birth - Foreign born (%) - Other Race
Residents speaking English at home (%)
Residents speaking English at home - Born in the United States (%)
Residents speaking English at home - Native, born elsewhere (%)
Residents speaking English at home - Foreign born (%)
Residents speaking Spanish at home (%)
Residents speaking Spanish at home - Born in the United States (%)
Residents speaking Spanish at home - Native, born elsewhere (%)
Residents speaking Spanish at home - Foreign born (%)
Residents speaking other language at home (%)
Residents speaking other language at home - Born in the United States (%)
Residents speaking other language at home - Native, born elsewhere (%)
Residents speaking other language at home - Foreign born (%)
Marital status - Never married (%)
Marital status - Now married (%)
Marital status - Separated (%)
Marital status - Widowed (%)
Marital status - Divorced (%)
Ancestries Reported - Arab (%)
Ancestries Reported - Czech (%)
Ancestries Reported - Danish (%)
Ancestries Reported - Dutch (%)
Ancestries Reported - English (%)
Ancestries Reported - French (%)
Ancestries Reported - French Canadian (%)
Ancestries Reported - German (%)
Ancestries Reported - Greek (%)
Ancestries Reported - Hungarian (%)
Ancestries Reported - Irish (%)
Ancestries Reported - Italian (%)
Ancestries Reported - Lithuanian (%)
Ancestries Reported - Norwegian (%)
Ancestries Reported - Polish (%)
Ancestries Reported - Portuguese (%)
Ancestries Reported - Russian (%)
Ancestries Reported - Scotch-Irish (%)
Ancestries Reported - Scottish (%)
Ancestries Reported - Slovak (%)
Ancestries Reported - Subsaharan African (%)
Ancestries Reported - Swedish (%)
Ancestries Reported - Swiss (%)
Ancestries Reported - Ukrainian (%)
Ancestries Reported - United States (%)
Ancestries Reported - Welsh (%)
Ancestries Reported - West Indian (%)
Ancestries Reported - Other (%)
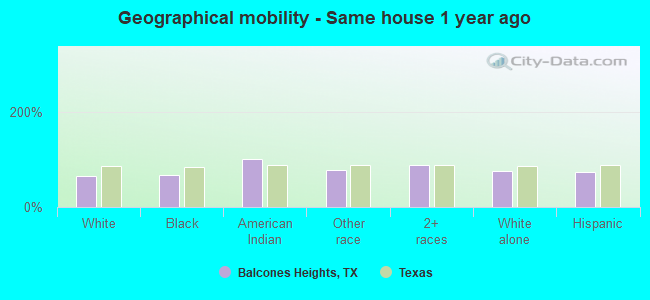
Geographical mobility - Same house 1 year ago (%)
Geographical mobility - Same house 1 year ago (%) - White
Geographical mobility - Same house 1 year ago (%) - Black or African American
Geographical mobility - Same house 1 year ago (%) - Asian
Geographical mobility - Same house 1 year ago (%) - Hispanic or Latino
Geographical mobility - Same house 1 year ago (%) - American Indian and Alaska Native
Geographical mobility - Same house 1 year ago (%) - Multirace
Geographical mobility - Same house 1 year ago (%) - Other Race
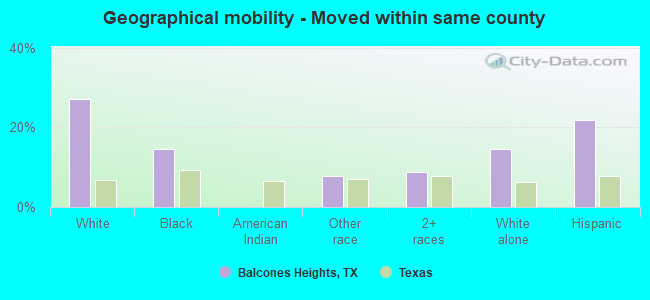
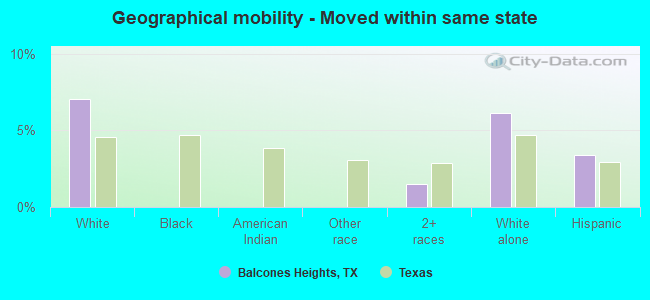
Geographical mobility - Moved within same county (%)
Geographical mobility - Moved within same county (%) - White
Geographical mobility - Moved within same county (%) - Black or African American
Geographical mobility - Moved within same county (%) - Asian
Geographical mobility - Moved within same county (%) - Hispanic or Latino
Geographical mobility - Moved within same county (%) - American Indian and Alaska Native
Geographical mobility - Moved within same county (%) - Multirace
Geographical mobility - Moved within same county (%) - Other Race
Geographical mobility - Moved from different county within same state (%)
Geographical mobility - Moved from different county within same state (%) - White
Geographical mobility - Moved from different county within same state (%) - Black or African American
Geographical mobility - Moved from different county within same state (%) - Asian
Geographical mobility - Moved from different county within same state (%) - Hispanic or Latino
Geographical mobility - Moved from different county within same state (%) - American Indian and Alaska Native
Geographical mobility - Moved from different county within same state (%) - Multirace
Geographical mobility - Moved from different county within same state (%) - Other Race
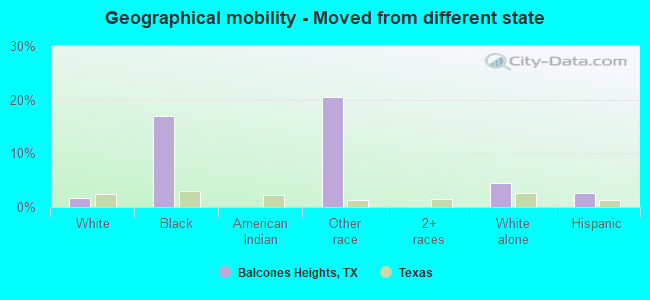
Geographical mobility - Moved from different state (%)
Geographical mobility - Moved from different state (%) - White
Geographical mobility - Moved from different state (%) - Black or African American
Geographical mobility - Moved from different state (%) - Asian
Geographical mobility - Moved from different state (%) - Hispanic or Latino
Geographical mobility - Moved from different state (%) - American Indian and Alaska Native
Geographical mobility - Moved from different state (%) - Multirace
Geographical mobility - Moved from different state (%) - Other Race
Geographical mobility - Moved from abroad (%)
Geographical mobility - Moved from abroad (%) - White
Geographical mobility - Moved from abroad (%) - Black or African American
Geographical mobility - Moved from abroad (%) - Asian
Geographical mobility - Moved from abroad (%) - Hispanic or Latino
Geographical mobility - Moved from abroad (%) - American Indian and Alaska Native
Geographical mobility - Moved from abroad (%) - Multirace
Geographical mobility - Moved from abroad (%) - Other Race
Place of birth for the foreign-born population - Ireland (%)
Place of birth for the foreign-born population - Denmark (%)
Place of birth for the foreign-born population - Norway (%)
Place of birth for the foreign-born population - Sweden (%)
Place of birth for the foreign-born population - United Kingdom (%)
Place of birth for the foreign-born population - England (%)
Place of birth for the foreign-born population - Scotland (%)
Place of birth for the foreign-born population - Other Northern Europe (%)
Place of birth for the foreign-born population - Austria (%)
Place of birth for the foreign-born population - Belgium (%)
Place of birth for the foreign-born population - France (%)
Place of birth for the foreign-born population - Germany (%)
Place of birth for the foreign-born population - Netherlands (%)
Place of birth for the foreign-born population - Switzerland (%)
Place of birth for the foreign-born population - Other Western Europe (%)
Place of birth for the foreign-born population - Greece (%)
Place of birth for the foreign-born population - Italy (%)
Place of birth for the foreign-born population - Portugal (%)
Place of birth for the foreign-born population - Spain (%)
Place of birth for the foreign-born population - Other Southern Europe (%)
Place of birth for the foreign-born population - Albania (%)
Place of birth for the foreign-born population - Belarus (%)
Place of birth for the foreign-born population - Bosnia and Herzegovina (%)
Place of birth for the foreign-born population - Bulgaria (%)
Place of birth for the foreign-born population - Croatia (%)
Place of birth for the foreign-born population - Czechoslovakia (%)
Place of birth for the foreign-born population - Hungary (%)
Place of birth for the foreign-born population - Latvia (%)
Place of birth for the foreign-born population - Lithuania (%)
Place of birth for the foreign-born population - North Macedonia (Macedonia) (%)
Place of birth for the foreign-born population - Moldova (%)
Place of birth for the foreign-born population - Poland (%)
Place of birth for the foreign-born population - Romania (%)
Place of birth for the foreign-born population - Russia (%)
Place of birth for the foreign-born population - Serbia (%)
Place of birth for the foreign-born population - Ukraine (%)
Place of birth for the foreign-born population - Other Eastern Europe (%)
Place of birth for the foreign-born population - China (%)
Place of birth for the foreign-born population - Hong Kong (%)
Place of birth for the foreign-born population - Taiwan (%)
Place of birth for the foreign-born population - Japan (%)
Place of birth for the foreign-born population - Korea (%)
Place of birth for the foreign-born population - Other Eastern Asia (%)
Place of birth for the foreign-born population - Afghanistan (%)
Place of birth for the foreign-born population - Bangladesh (%)
Place of birth for the foreign-born population - India (%)
Place of birth for the foreign-born population - Iran (%)
Place of birth for the foreign-born population - Kazakhstan (%)
Place of birth for the foreign-born population - Nepal (%)
Place of birth for the foreign-born population - Pakistan (%)
Place of birth for the foreign-born population - Sri Lanka (%)
Place of birth for the foreign-born population - Uzbekistan (%)
Place of birth for the foreign-born population - Other South Central Asia (%)
Place of birth for the foreign-born population - Burma (%)
Place of birth for the foreign-born population - Cambodia (%)
Place of birth for the foreign-born population - Indonesia (%)
Place of birth for the foreign-born population - Laos (%)
Place of birth for the foreign-born population - Malaysia (%)
Place of birth for the foreign-born population - Philippines (%)
Place of birth for the foreign-born population - Singapore (%)
Place of birth for the foreign-born population - Thailand (%)
Place of birth for the foreign-born population - Vietnam (%)
Place of birth for the foreign-born population - Other South Eastern Asia (%)
Place of birth for the foreign-born population - Armenia (%)
Place of birth for the foreign-born population - Iraq (%)
Place of birth for the foreign-born population - Israel (%)
Place of birth for the foreign-born population - Jordan (%)
Place of birth for the foreign-born population - Kuwait (%)
Place of birth for the foreign-born population - Lebanon (%)
Place of birth for the foreign-born population - Saudi Arabia (%)
Place of birth for the foreign-born population - Syria (%)
Place of birth for the foreign-born population - Turkey (%)
Place of birth for the foreign-born population - Yemen (%)
Place of birth for the foreign-born population - Other Western Asia (%)
Place of birth for the foreign-born population - Eritrea (%)
Place of birth for the foreign-born population - Ethiopia (%)
Place of birth for the foreign-born population - Kenya (%)
Place of birth for the foreign-born population - Somalia (%)
Place of birth for the foreign-born population - Uganda (%)
Place of birth for the foreign-born population - Zimbabwe (%)
Place of birth for the foreign-born population - Other Eastern Africa (%)
Place of birth for the foreign-born population - Cameroon (%)
Place of birth for the foreign-born population - Congo (%)
Place of birth for the foreign-born population - Democratic Republic of Congo (Zaire) (%)
Place of birth for the foreign-born population - Other Middle Africa (%)
Place of birth for the foreign-born population - Egypt (%)
Place of birth for the foreign-born population - Morocco (%)
Place of birth for the foreign-born population - Sudan (%)
Place of birth for the foreign-born population - Other Northern Africa (%)
Place of birth for the foreign-born population - South Africa (%)
Place of birth for the foreign-born population - Other Southern Africa (%)
Place of birth for the foreign-born population - Cabo Verde (%)
Place of birth for the foreign-born population - Ghana (%)
Place of birth for the foreign-born population - Liberia (%)
Place of birth for the foreign-born population - Nigeria (%)
Place of birth for the foreign-born population - Senegal (%)
Place of birth for the foreign-born population - Sierra Leone (%)
Place of birth for the foreign-born population - Other Western Africa (%)
Place of birth for the foreign-born population - Australia (%)
Place of birth for the foreign-born population - New Zealand (%)
Place of birth for the foreign-born population - Fiji (%)
Place of birth for the foreign-born population - Micronesia (%)
Place of birth for the foreign-born population - Bahamas (%)
Place of birth for the foreign-born population - Barbados (%)
Place of birth for the foreign-born population - Cuba (%)
Place of birth for the foreign-born population - Dominica (%)
Place of birth for the foreign-born population - Dominican Republic (%)
Place of birth for the foreign-born population - Grenada (%)
Place of birth for the foreign-born population - Haiti (%)
Place of birth for the foreign-born population - Jamaica (%)
Place of birth for the foreign-born population - St. Vincent and the Grenadines (%)
Place of birth for the foreign-born population - Trinidad and Tobago (%)
Place of birth for the foreign-born population - West Indies (%)
Place of birth for the foreign-born population - Other Caribbean (%)
Place of birth for the foreign-born population - Belize (%)
Place of birth for the foreign-born population - Costa Rica (%)
Place of birth for the foreign-born population - El Salvador (%)
Place of birth for the foreign-born population - Guatemala (%)
Place of birth for the foreign-born population - Honduras (%)
Place of birth for the foreign-born population - Mexico (%)
Place of birth for the foreign-born population - Nicaragua (%)
Place of birth for the foreign-born population - Panama (%)
Place of birth for the foreign-born population - Other Central America (%)
Place of birth for the foreign-born population - Argentina (%)
Place of birth for the foreign-born population - Bolivia (%)
Place of birth for the foreign-born population - Brazil (%)
Place of birth for the foreign-born population - Chile (%)
Place of birth for the foreign-born population - Colombia (%)
Place of birth for the foreign-born population - Ecuador (%)
Place of birth for the foreign-born population - Guyana (%)
Place of birth for the foreign-born population - Peru (%)
Place of birth for the foreign-born population - Uruguay (%)
Place of birth for the foreign-born population - Venezuela (%)
Place of birth for the foreign-born population - Other South America (%)
Place of birth for the foreign-born population - Canada (%)
Place of birth for the foreign-born population - Other Northern America (%)
Place of birth for the foreign-born population - Other (%)
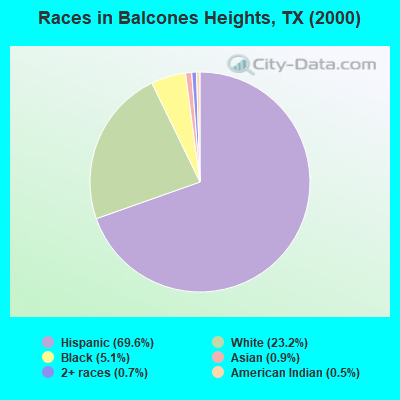
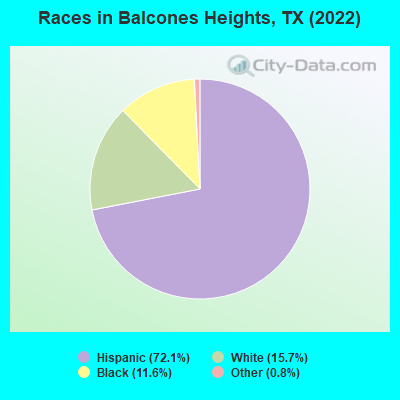
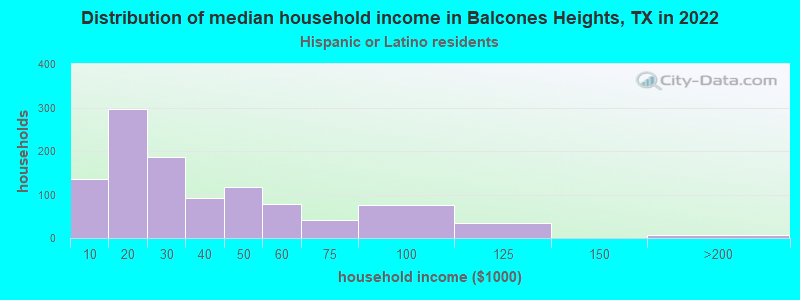
According to 2022 data, the most numerous races in Balcones Heights, TX are Hispanic (2,012 residents), White alone (437 residents), and Black alone (323 residents). 57.2% of Balcones Heights residents speak English at home. 11.8% of Balcones Heights, TX residents are foreign-born (9.3% born in Latin America, 1.4% born in Africa), which is 43.8% less than the foreign-born rate of 17.0% across the entire state of Texas.
Race distribution in Balcones Heights
2000 2022
10,933,313 52.4% White alone 6,669,666 32.0% Hispanic 2,364,255 11.3% Black alone 554,445 2.7% Asian alone 230,567 1.1% Two or more races 68,859 0.3% American Indian alone 19,958 0.10% Other race alone 10,757 0.05% Native Hawaiian and Other
12,070,642 40.2% Hispanic 11,683,430 38.9% White alone 3,508,706 11.7% Black alone 1,608,173 5.4% Asian alone 956,560 3.2% Two or more races 125,763 0.4% Other race alone 47,023 0.2% American Indian alone 29,275 0.10% Native Hawaiian and Other
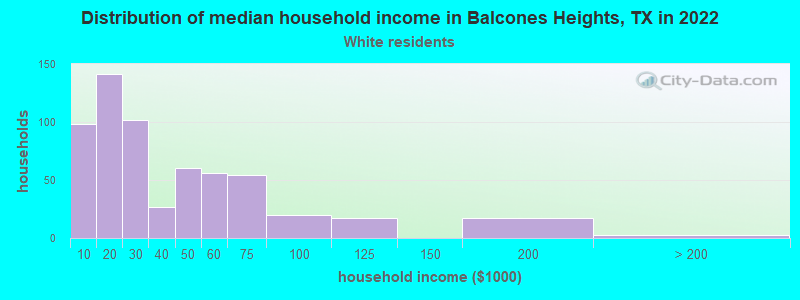
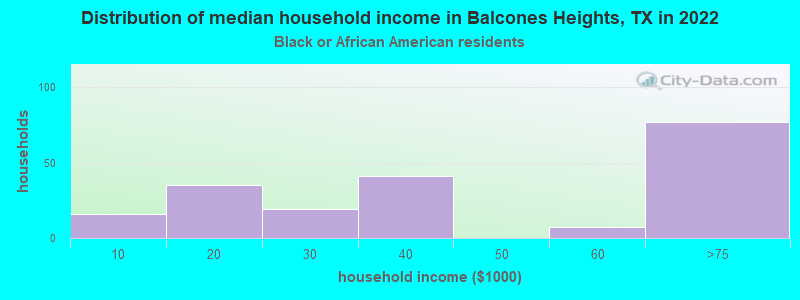
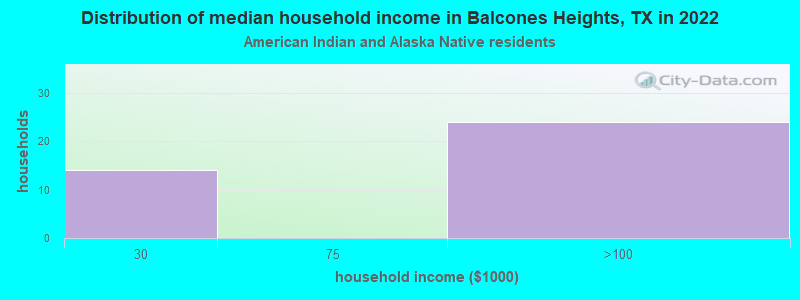
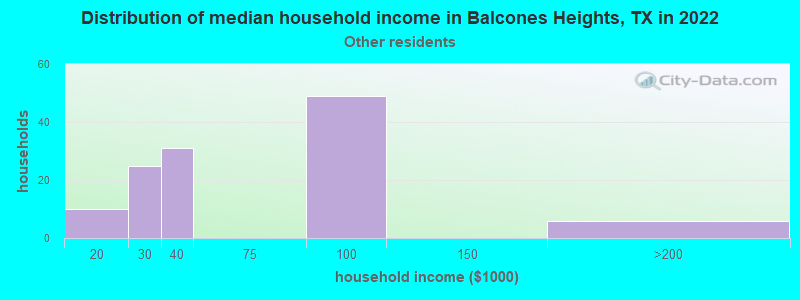
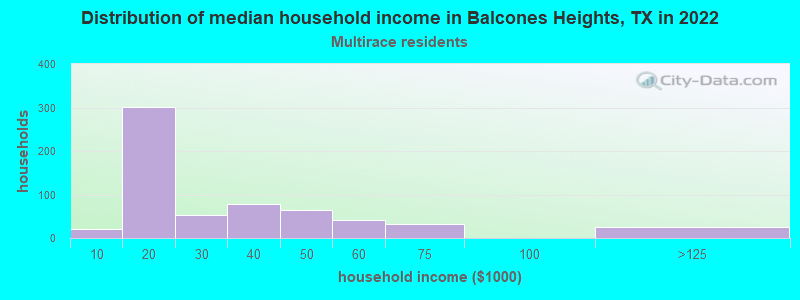
Income and house value in Balcones Heights Median household income in 2022 $34,813 White non-Hispanic householders$31,404 Black householders$25,677 Two or more races householders$23,550 Hispanic or Latino race householdersMedian 2022 house value $217,174 White Non-Hispanic householders$105,661 Some other race householders$223,677 Hispanic or Latino householders
Median age by race in Balcones Heights
34.5 Median age for White residents37.6 30.2 37.5 Median age for Black or African American residents36.9 49.5 17.8 Median age for American Indian / Alaska Native residents17.1 19.7 -664,783,426.8 Median age for Asian residents-678,362,572.4 -650,273,223.4 -674,441,204.4 Median age for Native Hawaiian / Pacific Islander residents-596,986,816.7 -748,387,096.0 43.8 Median age for Other race residents56.2 20.0 37.9 Median age for Two or more races residents37.3 39.8 43.8 Median age for White alone residents59.1 33.1 33.3 Median age for Hispanic or Latino residents33.7 31.9
Owner/renter occupied households by race in Balcones Heights
House owners and renters - White residents 150 25.8% Owner occupied431 74.2% Renter occupiedHouse owners and renters - Black or African American residents 6 3.2% Owner occupied187 96.8% Renter occupiedHouse owners and renters - American Indian / Alaska Native residents 42 100.0% Renter occupiedHouse owners and renters - Other race residents 77 54.7% Owner occupied64 45.3% Renter occupiedHouse owners and renters - Two or more races residents 34 5.8% Owner occupied553 94.2% Renter occupiedHouse owners and renters - White alone residents 89 36.4% Owner occupied156 63.6% Renter occupiedHouse owners and renters - Hispanic or Latino residents 175 16.7% Owner occupied873 83.3% Renter occupied
Language usage in Balcones Heights
English speakers - Total 57.2% of residents of Balcones Heights speak English at home.
38.0% of residents speak Spanish at home 737 73.6% Speak English very well264 26.4% Speak English less than very well4.6% of residents speak other language at home 57 47.1% Speak English very well64 52.9% Speak English less than very well
English speakers - Born in the United States 78.4% of residents of Balcones Heights speak English at home.
21.6% of residents speak Spanish at home 99 100.0% Speak English very well
English speakers - Native, born elsewhere 0.0% of residents of Balcones Heights speak English at home.
101.6% of residents speak Spanish at home 65 100.0% Speak English very well
English speakers - Foreign-born 9.0% of residents of Balcones Heights speak English at home.
76.3% of residents speak Spanish at home 103 42.0% Speak English very well142 58.0% Speak English less than very well14.3% of residents speak other language at home 46 100.0% Speak English less than very well
White (Caucasian) - Speak only English Native:
76.1% (711)Foreign-born:
9.7% (6)
White (Caucasian) - Speak another language Native:
21.2% (198)Foreign-born:
85.0% (55)
American Indian / Alaska Native - Speak only English Native:
17.1% (23)Foreign-born:
100.0% (22)
Other race - Speak only English Native:
32.4% (109)Foreign-born:
30.2% (4)
Other race - Speak another language Native:
68.5% (230)Foreign-born:
64.7% (9)
Two or more races - Speak another language Native:
49.5% (356)Foreign-born:
100.0% (174)
White alone - Speak only English Native:
100.0% (407)Foreign-born:
98.3% (8)
Hispanic or Latino - Speak only English Native:
47.8% (772)Foreign-born:
7.9% (21)
Hispanic or Latino - Speak another language Native:
51.9% (838)Foreign-born:
92.3% (248)
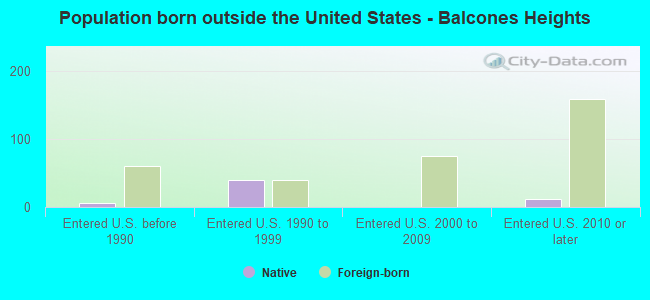
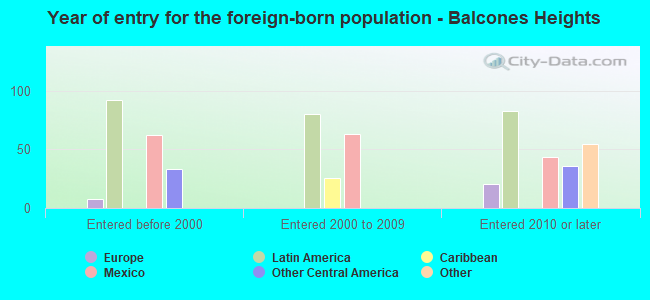
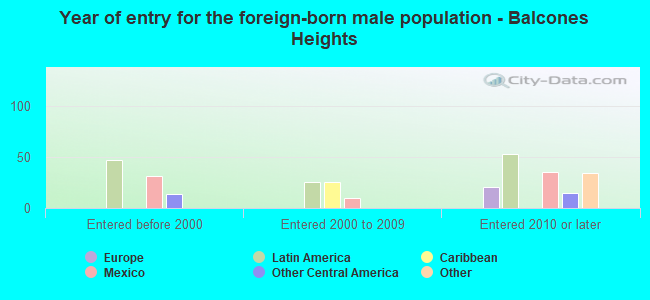
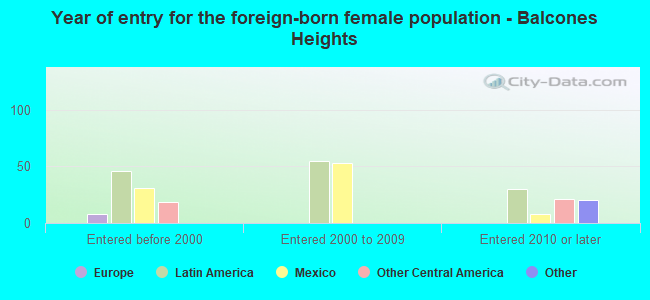
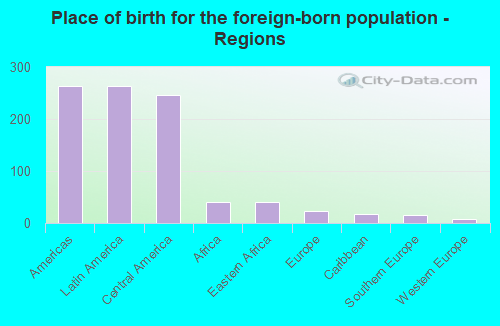
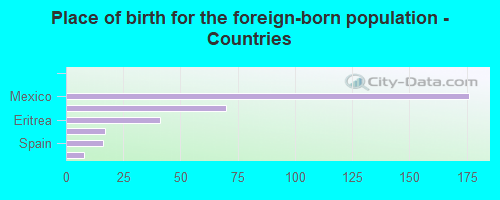
Foreign-born residents in Balcones Heights 330 residents are foreign born (9.3% Latin America , 1.4% Africa ).
This city:
11.8%Texas:
17.1%
Marital status for residents in Balcones Heights Marital status - White (Caucasian) population 15 years and over
Males 40.9% Never married27.2% Now married2.2% Separated1.1% Widowed28.6% DivorcedFemales 39.1% Never married32.1% Now married0.0% Separated6.8% Widowed22.0% DivorcedWomen who gave birth in the past 12 months Now married:
14.3% (5)Unmarried:
85.7% (30)
Women who did not give birth in the past 12 months Now married:
37.9% (93)Unmarried:
62.1% (153)
Marital status - Black or African American population 15 years and over
Males 39.1% Never married26.4% Now married17.8% Separated5.7% Widowed10.9% DivorcedFemales 70.0% Never married5.8% Now married12.5% Separated0.0% Widowed11.7% DivorcedWomen who did not give birth in the past 12 months Now married:
26.8% (16)Unmarried:
73.2% (45)
Marital status - American Indian / Alaska Native population 15 years and over
Males 100.0% Never married0.0% Now married0.0% Separated0.0% Widowed0.0% DivorcedFemales 68.6% Never married0.0% Now married0.0% Separated31.4% Widowed0.0% DivorcedWomen who did not give birth in the past 12 months Now married:
0.0% (0)Unmarried:
100.0% (50)
Marital status - Other race population 15 years and over
Males 34.7% Never married8.7% Now married4.7% Separated0.0% Widowed52.0% DivorcedFemales 79.6% Never married14.2% Now married0.0% Separated0.0% Widowed6.2% DivorcedWomen who did not give birth in the past 12 months Now married:
4.3% (6)Unmarried:
95.7% (126)
Marital status - Two or more races population 15 years and over
Males 59.5% Never married32.6% Now married0.0% Separated0.0% Widowed7.9% DivorcedFemales 29.6% Never married13.9% Now married35.4% Separated0.0% Widowed21.2% DivorcedWomen who did not give birth in the past 12 months Now married:
18.1% (44)Unmarried:
81.9% (198)
Marital status - White alone, not Hispanic / Latino population 15 years and over
Males 41.5% Never married26.9% Now married0.0% Separated3.8% Widowed27.8% DivorcedFemales 58.6% Never married15.1% Now married0.0% Separated11.3% Widowed15.1% DivorcedWomen who did not give birth in the past 12 months Now married:
12.1% (17)Unmarried:
87.9% (121)
Marital status - Hispanic or Latino population 15 years and over
Males 45.2% Never married24.6% Now married2.7% Separated0.0% Widowed27.6% DivorcedFemales 38.4% Never married25.7% Now married11.9% Separated4.2% Widowed19.9% DivorcedWomen who gave birth in the past 12 months Now married:
14.3% (7)Unmarried:
85.7% (43)
Women who did not give birth in the past 12 months Now married:
30.3% (149)Unmarried:
69.7% (342)
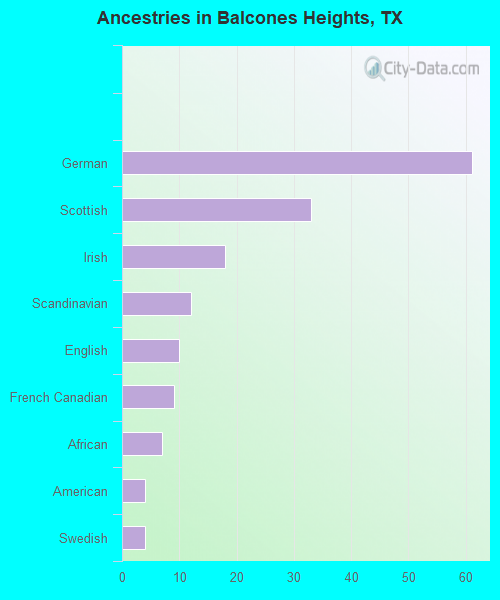
Ancestries in Balcones Heights
61 3.0% German33 1.6% Scottish18 0.9% Irish12 0.6% Scandinavian10 0.5% English9 0.4% French Canadian7 0.3% African4 0.2% American4 0.2% Swedish
Children Nativity (place of birth) in Balcones Heights
Children under 6 years - Living with two parents Both parents native 104 100.0% NativeOne native, one foreign-born parent 14 100.0% NativeChildren under 6 years - Living with one parent Native parent 52 100.0% NativeChildren 6 to 17 years - Living with two parents Both parents native 17 100.0% NativeOne native, one foreign-born parent 65 100.0% NativeChildren 6 to 17 years - Living with one parent Native parent 161 100.0% NativeForeign-born parent 75 54.0% Native64 46.0% Foreign-born