Races in Bailey's Crossroads, Virginia (VA) Detailed Stats
Data:
Races - White alone (%)
Races - White alone (% change since 2000)
Races - Black alone (%)
Races - Black alone (% change since 2000)
Races - American Indian alone (%)
Races - American Indian alone (% change since 2000)
Races - Asian alone (%)
Races - Asian alone (% change since 2000)
Races - Hispanic (%)
Races - Hispanic (% change since 2000)
Races - Native Hawaiian and Other Pacific Islander alone (%)
Races - Native Hawaiian and Other Pacific Islander alone (% change since 2000)
Races - Two or more races(%)
Races - Two or more races(% change since 2000)
Races - Other race alone (%)
Races - Other race alone (% change since 2000)
Racial diversity
Place of birth - Born in state of residence (%)
Place of birth - Born in state of residence (%) - White
Place of birth - Born in state of residence (%) - Black or African American
Place of birth - Born in state of residence (%) - Asian
Place of birth - Born in state of residence (%) - Hispanic or Latino
Place of birth - Born in state of residence (%) - American Indian and Alaska Native
Place of birth - Born in state of residence (%) - Multirace
Place of birth - Born in state of residence (%) - Other Race
Place of birth - Born in other state (%)
Place of birth - Born in other state (%) - White
Place of birth - Born in other state (%) - Black or African American
Place of birth - Born in other state (%) - Asian
Place of birth - Born in other state (%) - Hispanic or Latino
Place of birth - Born in other state (%) - American Indian and Alaska Native
Place of birth - Born in other state (%) - Multirace
Place of birth - Born in other state (%) - Other Race
Place of birth - Native, outside of US (%)
Place of birth - Native, outside of US (%) - White
Place of birth - Native, outside of US (%) - Black or African American
Place of birth - Native, outside of US (%) - Asian
Place of birth - Native, outside of US (%) - Hispanic or Latino
Place of birth - Native, outside of US (%) - American Indian and Alaska Native
Place of birth - Native, outside of US (%) - Multirace
Place of birth - Native, outside of US (%) - Other Race
Place of birth - Foreign born (%)
Place of birth - Foreign born (%) - White
Place of birth - Foreign born (%) - Black or African American
Place of birth - Foreign born (%) - Asian
Place of birth - Foreign born (%) - Hispanic or Latino
Place of birth - Foreign born (%) - American Indian and Alaska Native
Place of birth - Foreign born (%) - Multirace
Place of birth - Foreign born (%) - Other Race
Residents speaking English at home (%)
Residents speaking English at home - Born in the United States (%)
Residents speaking English at home - Native, born elsewhere (%)
Residents speaking English at home - Foreign born (%)
Residents speaking Spanish at home (%)
Residents speaking Spanish at home - Born in the United States (%)
Residents speaking Spanish at home - Native, born elsewhere (%)
Residents speaking Spanish at home - Foreign born (%)
Residents speaking other language at home (%)
Residents speaking other language at home - Born in the United States (%)
Residents speaking other language at home - Native, born elsewhere (%)
Residents speaking other language at home - Foreign born (%)
Marital status - Never married (%)
Marital status - Now married (%)
Marital status - Separated (%)
Marital status - Widowed (%)
Marital status - Divorced (%)
Ancestries Reported - Arab (%)
Ancestries Reported - Czech (%)
Ancestries Reported - Danish (%)
Ancestries Reported - Dutch (%)
Ancestries Reported - English (%)
Ancestries Reported - French (%)
Ancestries Reported - French Canadian (%)
Ancestries Reported - German (%)
Ancestries Reported - Greek (%)
Ancestries Reported - Hungarian (%)
Ancestries Reported - Irish (%)
Ancestries Reported - Italian (%)
Ancestries Reported - Lithuanian (%)
Ancestries Reported - Norwegian (%)
Ancestries Reported - Polish (%)
Ancestries Reported - Portuguese (%)
Ancestries Reported - Russian (%)
Ancestries Reported - Scotch-Irish (%)
Ancestries Reported - Scottish (%)
Ancestries Reported - Slovak (%)
Ancestries Reported - Subsaharan African (%)
Ancestries Reported - Swedish (%)
Ancestries Reported - Swiss (%)
Ancestries Reported - Ukrainian (%)
Ancestries Reported - United States (%)
Ancestries Reported - Welsh (%)
Ancestries Reported - West Indian (%)
Ancestries Reported - Other (%)
Geographical mobility - Same house 1 year ago (%)
Geographical mobility - Same house 1 year ago (%) - White
Geographical mobility - Same house 1 year ago (%) - Black or African American
Geographical mobility - Same house 1 year ago (%) - Asian
Geographical mobility - Same house 1 year ago (%) - Hispanic or Latino
Geographical mobility - Same house 1 year ago (%) - American Indian and Alaska Native
Geographical mobility - Same house 1 year ago (%) - Multirace
Geographical mobility - Same house 1 year ago (%) - Other Race
Geographical mobility - Moved within same county (%)
Geographical mobility - Moved within same county (%) - White
Geographical mobility - Moved within same county (%) - Black or African American
Geographical mobility - Moved within same county (%) - Asian
Geographical mobility - Moved within same county (%) - Hispanic or Latino
Geographical mobility - Moved within same county (%) - American Indian and Alaska Native
Geographical mobility - Moved within same county (%) - Multirace
Geographical mobility - Moved within same county (%) - Other Race
Geographical mobility - Moved from different county within same state (%)
Geographical mobility - Moved from different county within same state (%) - White
Geographical mobility - Moved from different county within same state (%) - Black or African American
Geographical mobility - Moved from different county within same state (%) - Asian
Geographical mobility - Moved from different county within same state (%) - Hispanic or Latino
Geographical mobility - Moved from different county within same state (%) - American Indian and Alaska Native
Geographical mobility - Moved from different county within same state (%) - Multirace
Geographical mobility - Moved from different county within same state (%) - Other Race
Geographical mobility - Moved from different state (%)
Geographical mobility - Moved from different state (%) - White
Geographical mobility - Moved from different state (%) - Black or African American
Geographical mobility - Moved from different state (%) - Asian
Geographical mobility - Moved from different state (%) - Hispanic or Latino
Geographical mobility - Moved from different state (%) - American Indian and Alaska Native
Geographical mobility - Moved from different state (%) - Multirace
Geographical mobility - Moved from different state (%) - Other Race
Geographical mobility - Moved from abroad (%)
Geographical mobility - Moved from abroad (%) - White
Geographical mobility - Moved from abroad (%) - Black or African American
Geographical mobility - Moved from abroad (%) - Asian
Geographical mobility - Moved from abroad (%) - Hispanic or Latino
Geographical mobility - Moved from abroad (%) - American Indian and Alaska Native
Geographical mobility - Moved from abroad (%) - Multirace
Geographical mobility - Moved from abroad (%) - Other Race
Place of birth for the foreign-born population - Ireland (%)
Place of birth for the foreign-born population - Denmark (%)
Place of birth for the foreign-born population - Norway (%)
Place of birth for the foreign-born population - Sweden (%)
Place of birth for the foreign-born population - United Kingdom (%)
Place of birth for the foreign-born population - England (%)
Place of birth for the foreign-born population - Scotland (%)
Place of birth for the foreign-born population - Other Northern Europe (%)
Place of birth for the foreign-born population - Austria (%)
Place of birth for the foreign-born population - Belgium (%)
Place of birth for the foreign-born population - France (%)
Place of birth for the foreign-born population - Germany (%)
Place of birth for the foreign-born population - Netherlands (%)
Place of birth for the foreign-born population - Switzerland (%)
Place of birth for the foreign-born population - Other Western Europe (%)
Place of birth for the foreign-born population - Greece (%)
Place of birth for the foreign-born population - Italy (%)
Place of birth for the foreign-born population - Portugal (%)
Place of birth for the foreign-born population - Spain (%)
Place of birth for the foreign-born population - Other Southern Europe (%)
Place of birth for the foreign-born population - Albania (%)
Place of birth for the foreign-born population - Belarus (%)
Place of birth for the foreign-born population - Bosnia and Herzegovina (%)
Place of birth for the foreign-born population - Bulgaria (%)
Place of birth for the foreign-born population - Croatia (%)
Place of birth for the foreign-born population - Czechoslovakia (%)
Place of birth for the foreign-born population - Hungary (%)
Place of birth for the foreign-born population - Latvia (%)
Place of birth for the foreign-born population - Lithuania (%)
Place of birth for the foreign-born population - North Macedonia (Macedonia) (%)
Place of birth for the foreign-born population - Moldova (%)
Place of birth for the foreign-born population - Poland (%)
Place of birth for the foreign-born population - Romania (%)
Place of birth for the foreign-born population - Russia (%)
Place of birth for the foreign-born population - Serbia (%)
Place of birth for the foreign-born population - Ukraine (%)
Place of birth for the foreign-born population - Other Eastern Europe (%)
Place of birth for the foreign-born population - China (%)
Place of birth for the foreign-born population - Hong Kong (%)
Place of birth for the foreign-born population - Taiwan (%)
Place of birth for the foreign-born population - Japan (%)
Place of birth for the foreign-born population - Korea (%)
Place of birth for the foreign-born population - Other Eastern Asia (%)
Place of birth for the foreign-born population - Afghanistan (%)
Place of birth for the foreign-born population - Bangladesh (%)
Place of birth for the foreign-born population - India (%)
Place of birth for the foreign-born population - Iran (%)
Place of birth for the foreign-born population - Kazakhstan (%)
Place of birth for the foreign-born population - Nepal (%)
Place of birth for the foreign-born population - Pakistan (%)
Place of birth for the foreign-born population - Sri Lanka (%)
Place of birth for the foreign-born population - Uzbekistan (%)
Place of birth for the foreign-born population - Other South Central Asia (%)
Place of birth for the foreign-born population - Burma (%)
Place of birth for the foreign-born population - Cambodia (%)
Place of birth for the foreign-born population - Indonesia (%)
Place of birth for the foreign-born population - Laos (%)
Place of birth for the foreign-born population - Malaysia (%)
Place of birth for the foreign-born population - Philippines (%)
Place of birth for the foreign-born population - Singapore (%)
Place of birth for the foreign-born population - Thailand (%)
Place of birth for the foreign-born population - Vietnam (%)
Place of birth for the foreign-born population - Other South Eastern Asia (%)
Place of birth for the foreign-born population - Armenia (%)
Place of birth for the foreign-born population - Iraq (%)
Place of birth for the foreign-born population - Israel (%)
Place of birth for the foreign-born population - Jordan (%)
Place of birth for the foreign-born population - Kuwait (%)
Place of birth for the foreign-born population - Lebanon (%)
Place of birth for the foreign-born population - Saudi Arabia (%)
Place of birth for the foreign-born population - Syria (%)
Place of birth for the foreign-born population - Turkey (%)
Place of birth for the foreign-born population - Yemen (%)
Place of birth for the foreign-born population - Other Western Asia (%)
Place of birth for the foreign-born population - Eritrea (%)
Place of birth for the foreign-born population - Ethiopia (%)
Place of birth for the foreign-born population - Kenya (%)
Place of birth for the foreign-born population - Somalia (%)
Place of birth for the foreign-born population - Uganda (%)
Place of birth for the foreign-born population - Zimbabwe (%)
Place of birth for the foreign-born population - Other Eastern Africa (%)
Place of birth for the foreign-born population - Cameroon (%)
Place of birth for the foreign-born population - Congo (%)
Place of birth for the foreign-born population - Democratic Republic of Congo (Zaire) (%)
Place of birth for the foreign-born population - Other Middle Africa (%)
Place of birth for the foreign-born population - Egypt (%)
Place of birth for the foreign-born population - Morocco (%)
Place of birth for the foreign-born population - Sudan (%)
Place of birth for the foreign-born population - Other Northern Africa (%)
Place of birth for the foreign-born population - South Africa (%)
Place of birth for the foreign-born population - Other Southern Africa (%)
Place of birth for the foreign-born population - Cabo Verde (%)
Place of birth for the foreign-born population - Ghana (%)
Place of birth for the foreign-born population - Liberia (%)
Place of birth for the foreign-born population - Nigeria (%)
Place of birth for the foreign-born population - Senegal (%)
Place of birth for the foreign-born population - Sierra Leone (%)
Place of birth for the foreign-born population - Other Western Africa (%)
Place of birth for the foreign-born population - Australia (%)
Place of birth for the foreign-born population - New Zealand (%)
Place of birth for the foreign-born population - Fiji (%)
Place of birth for the foreign-born population - Micronesia (%)
Place of birth for the foreign-born population - Bahamas (%)
Place of birth for the foreign-born population - Barbados (%)
Place of birth for the foreign-born population - Cuba (%)
Place of birth for the foreign-born population - Dominica (%)
Place of birth for the foreign-born population - Dominican Republic (%)
Place of birth for the foreign-born population - Grenada (%)
Place of birth for the foreign-born population - Haiti (%)
Place of birth for the foreign-born population - Jamaica (%)
Place of birth for the foreign-born population - St. Vincent and the Grenadines (%)
Place of birth for the foreign-born population - Trinidad and Tobago (%)
Place of birth for the foreign-born population - West Indies (%)
Place of birth for the foreign-born population - Other Caribbean (%)
Place of birth for the foreign-born population - Belize (%)
Place of birth for the foreign-born population - Costa Rica (%)
Place of birth for the foreign-born population - El Salvador (%)
Place of birth for the foreign-born population - Guatemala (%)
Place of birth for the foreign-born population - Honduras (%)
Place of birth for the foreign-born population - Mexico (%)
Place of birth for the foreign-born population - Nicaragua (%)
Place of birth for the foreign-born population - Panama (%)
Place of birth for the foreign-born population - Other Central America (%)
Place of birth for the foreign-born population - Argentina (%)
Place of birth for the foreign-born population - Bolivia (%)
Place of birth for the foreign-born population - Brazil (%)
Place of birth for the foreign-born population - Chile (%)
Place of birth for the foreign-born population - Colombia (%)
Place of birth for the foreign-born population - Ecuador (%)
Place of birth for the foreign-born population - Guyana (%)
Place of birth for the foreign-born population - Peru (%)
Place of birth for the foreign-born population - Uruguay (%)
Place of birth for the foreign-born population - Venezuela (%)
Place of birth for the foreign-born population - Other South America (%)
Place of birth for the foreign-born population - Canada (%)
Place of birth for the foreign-born population - Other Northern America (%)
Place of birth for the foreign-born population - Other (%)
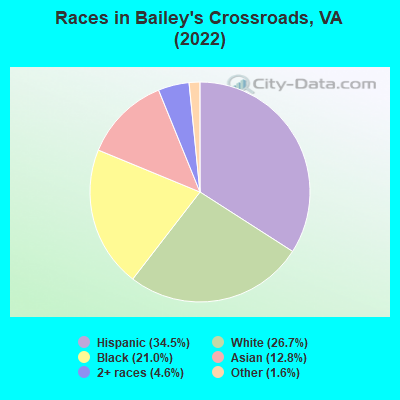
According to 2022 data, the most numerous races in Bailey's Crossroads, VA are White alone (6,583 residents), Black alone (5,169 residents), and Hispanic (8,499 residents). 38.7% of Bailey's Crossroads residents speak English at home. 49.1% of Bailey's Crossroads, VA residents are foreign-born (20.9% born in Latin America, 14.5% born in Asia, 12.1% born in Africa), which is 75.5% greater than the foreign-born rate of 12.0% across the entire state of Virginia.
Race distribution in Bailey's Crossroads
2000 2022
8,596 37.1% Hispanic 7,741 33.4% White alone 2,847 12.3% Asian alone 2,391 10.3% Black alone 1,403 6.1% Two or more races 102 0.4% Other race alone 65 0.3% American Indian alone 21 0.09% Native Hawaiian and Other
8,499 34.5% Hispanic 6,583 26.7% White alone 5,169 21.0% Black alone 3,147 12.8% Asian alone 1,124 4.6% Two or more races 400 1.6% Other race alone 12 0.05% American Indian alone 4 0.02% Native Hawaiian and Other
2000 2022
4,965,637 70.2% White alone 1,376,378 19.4% Black alone 329,540 4.7% Hispanic 259,277 3.7% Asian alone 114,022 1.6% Two or more races 18,596 0.3% American Indian alone 11,685 0.2% Other race alone 3,380 0.05% Native Hawaiian and Other
5,095,130 58.7% White alone 1,594,785 18.4% Black alone 905,750 10.4% Hispanic 602,881 6.9% Asian alone 406,047 4.7% Two or more races 60,419 0.7% Other race alone 11,738 0.1% American Indian alone 6,869 0.08% Native Hawaiian and Other
Income and house value in Bailey's Crossroads Median household income in 2022 $104,586 White non-Hispanic householders$82,134 Black householders$51,930 Asian householders$54,857 Some other race householders$68,577 Two or more races householders$56,379 Hispanic or Latino race householdersMedian 2022 house value $670,346 White Non-Hispanic householders$635,200 Black or African American householders $566,622 Asian householders$607,197 Some other race householders$714,350 Two or more races householders$666,060 Hispanic or Latino householders
Median age by race in Bailey's Crossroads
40.1 Median age for White residents35.4 42.2 44.3 Median age for Black or African American residents43.3 46.9 2.7 Median age for American Indian / Alaska Native residents3.0 7.9 34.1 Median age for Asian residents34.2 32.9 -666,666,666.0 Median age for Native Hawaiian / Pacific Islander residents-558,791,801.0 -584,518,166.9 27.9 Median age for Other race residents28.8 27.3 36.6 Median age for Two or more races residents33.2 41.1 41.9 Median age for White alone residents38.2 46.2 26.5 Median age for Hispanic or Latino residents25.1 29.1
Owner/renter occupied households by race in Bailey's Crossroads
House owners and renters - White residents 2,340 61.9% Owner occupied1,440 38.1% Renter occupiedHouse owners and renters - Black or African American residents 751 39.9% Owner occupied1,129 60.1% Renter occupiedHouse owners and renters - American Indian / Alaska Native residents 20 100.0% Renter occupiedHouse owners and renters - Asian residents 590 43.0% Owner occupied783 57.0% Renter occupiedHouse owners and renters - Other race residents 425 20.6% Owner occupied1,641 79.4% Renter occupiedHouse owners and renters - Two or more races residents 342 38.3% Owner occupied551 61.7% Renter occupiedHouse owners and renters - White alone residents 2,210 62.5% Owner occupied1,326 37.5% Renter occupiedHouse owners and renters - Hispanic or Latino residents 578 25.5% Owner occupied1,685 74.5% Renter occupied
Language usage in Bailey's Crossroads
English speakers - Total 38.7% of residents of Bailey's Crossroads speak English at home.
29.3% of residents speak Spanish at home 2,501 38.4% Speak English very well4,018 61.6% Speak English less than very well31.5% of residents speak other language at home 4,181 59.5% Speak English very well2,842 40.5% Speak English less than very well
English speakers - Born in the United States 89.3% of residents of Bailey's Crossroads speak English at home.
4.5% of residents speak Spanish at home 196 73.4% Speak English very well71 26.6% Speak English less than very well6.5% of residents speak other language at home 255 66.6% Speak English very well128 33.4% Speak English less than very well
English speakers - Native, born elsewhere 42.0% of residents of Bailey's Crossroads speak English at home.
43.4% of residents speak Spanish at home 75 40.3% Speak English very well111 59.7% Speak English less than very well15.2% of residents speak other language at home 39 60.0% Speak English very well26 40.0% Speak English less than very well
English speakers - Foreign-born 9.3% of residents of Bailey's Crossroads speak English at home.
38.7% of residents speak Spanish at home 1,075 24.1% Speak English very well3,377 75.9% Speak English less than very well51.7% of residents speak other language at home 3,231 54.3% Speak English very well2,720 45.7% Speak English less than very well
White (Caucasian) - Speak only English Native:
84.2% (4,542)Foreign-born:
25.7% (339)
White (Caucasian) - Speak another language Native:
13.2% (712)Foreign-born:
74.3% (979)
Black or African American - Speak only English Native:
79.9% (1,704)Foreign-born:
4.2% (115)
Black or African American - Speak another language Native:
21.9% (467)Foreign-born:
91.2% (2,490)
American Indian / Alaska Native - Speak another language Native:
89.5% (94)Foreign-born:
100.0% (117)
Asian - Speak only English Native:
65.1% (302)Foreign-born:
11.4% (252)
Asian - Speak another language Native:
33.5% (156)Foreign-born:
88.3% (1,954)
Other race - Speak only English Native:
13.6% (239)Foreign-born:
7.6% (362)
Other race - Speak another language Native:
77.4% (1,364)Foreign-born:
92.3% (4,399)
Two or more races - Speak only English Native:
69.7% (838)Foreign-born:
5.0% (60)
Two or more races - Speak another language Native:
30.6% (368)Foreign-born:
95.1% (1,156)
White alone - Speak only English Native:
87.9% (4,518)Foreign-born:
29.4% (360)
White alone - Speak another language Native:
11.3% (582)Foreign-born:
70.8% (868)
Hispanic or Latino - Speak only English Native:
14.2% (339)Foreign-born:
4.7% (228)
Hispanic or Latino - Speak another language Native:
79.9% (1,908)Foreign-born:
95.2% (4,585)
Foreign-born residents in Bailey's Crossroads 12,083 residents are foreign born (20.9% Latin America , 14.5% Asia , 12.1% Africa ).
This city:
49.1%Virginia:
12.6%
Marital status for residents in Bailey's Crossroads Marital status - White (Caucasian) population 15 years and over
Males 42.5% Never married46.2% Now married0.0% Separated2.7% Widowed8.6% DivorcedFemales 38.1% Never married34.9% Now married1.5% Separated12.0% Widowed13.5% DivorcedWomen who gave birth in the past 12 months Now married:
100.0% (115)Unmarried:
0.0% (0)
Women who did not give birth in the past 12 months Now married:
34.2% (555)Unmarried:
65.8% (1,069)
Marital status - Black or African American population 15 years and over
Males 37.4% Never married50.5% Now married3.1% Separated2.1% Widowed6.9% DivorcedFemales 26.5% Never married47.8% Now married2.8% Separated8.8% Widowed14.1% DivorcedWomen who gave birth in the past 12 months Now married:
100.0% (289)Unmarried:
0.0% (0)
Women who did not give birth in the past 12 months Now married:
37.5% (371)Unmarried:
62.5% (618)
Marital status - American Indian / Alaska Native population 15 years and over
Males 77.4% Never married22.6% Now married0.0% Separated0.0% Widowed0.0% DivorcedFemales 0.0% Never married100.0% Now married0.0% Separated0.0% Widowed0.0% DivorcedWomen who did not give birth in the past 12 months Now married:
100.0% (23)Unmarried:
0.0% (0)
Marital status - Asian population 15 years and over
Males 26.7% Never married67.6% Now married0.0% Separated0.0% Widowed5.7% DivorcedFemales 31.0% Never married55.2% Now married0.0% Separated2.9% Widowed10.9% DivorcedWomen who gave birth in the past 12 months Now married:
100.0% (142)Unmarried:
0.0% (0)
Women who did not give birth in the past 12 months Now married:
60.7% (337)Unmarried:
39.3% (218)
Marital status - Other race population 15 years and over
Males 58.0% Never married36.0% Now married0.9% Separated0.0% Widowed5.0% DivorcedFemales 42.3% Never married44.1% Now married0.0% Separated3.3% Widowed10.3% DivorcedWomen who gave birth in the past 12 months Now married:
26.2% (66)Unmarried:
73.8% (187)
Women who did not give birth in the past 12 months Now married:
49.0% (564)Unmarried:
51.0% (588)
Marital status - Two or more races population 15 years and over
Males 52.7% Never married35.4% Now married0.0% Separated0.0% Widowed11.9% DivorcedFemales 32.5% Never married31.4% Now married0.0% Separated15.5% Widowed20.6% DivorcedWomen who gave birth in the past 12 months Now married:
100.0% (37)Unmarried:
0.0% (0)
Women who did not give birth in the past 12 months Now married:
23.5% (111)Unmarried:
76.5% (361)
Marital status - White alone, not Hispanic / Latino population 15 years and over
Males 41.7% Never married45.5% Now married0.0% Separated3.1% Widowed9.8% DivorcedFemales 39.6% Never married34.6% Now married0.5% Separated11.9% Widowed13.3% DivorcedWomen who gave birth in the past 12 months Now married:
100.0% (78)Unmarried:
0.0% (0)
Women who did not give birth in the past 12 months Now married:
33.8% (513)Unmarried:
66.2% (1,003)
Marital status - Hispanic or Latino population 15 years and over
Males 58.6% Never married35.1% Now married0.7% Separated0.0% Widowed5.6% DivorcedFemales 39.5% Never married40.5% Now married1.8% Separated8.4% Widowed9.9% DivorcedWomen who gave birth in the past 12 months Now married:
39.2% (97)Unmarried:
60.8% (151)
Women who did not give birth in the past 12 months Now married:
43.5% (530)Unmarried:
56.5% (688)
Ancestries in Bailey's Crossroads
1,253 7.6% Ethiopian1,164 7.1% African1,001 6.1% Afghan356 2.2% Irish298 1.8% American296 1.8% Sudanese260 1.6% European257 1.6% Moroccan189 1.2% English180 1.1% Somali162 1.0% German148 0.9% Palestinian141 0.9% Slavic124 0.8% Arab109 0.7% Polish103 0.6% Iraqi89 0.5% Italian75 0.5% Armenian66 0.4% Eastern European59 0.4% Sierra Leonean56 0.3% British54 0.3% Egyptian51 0.3% Jamaican50 0.3% Turkish48 0.3% Russian36 0.2% Ghanaian32 0.2% Brazilian30 0.2% Scotch-Irish28 0.2% Ukrainian27 0.2% Norwegian24 0.1% French Canadian24 0.1% Portuguese24 0.1% Lebanese23 0.1% Greek19 0.1% Swedish19 0.1% Iranian18 0.1% Yugoslavian15 0.09% Syrian15 0.09% Hungarian15 0.09% Slovak13 0.08% Lithuanian12 0.07% Northern European11 0.07% Scottish10 0.06% Dutch10 0.06% Guyanese10 0.06% French8 0.05% Czech8 0.05% Haitian
Geographical mobility in Bailey's Crossroads Same house 1 year ago 5,847 82.8% White (Caucasian)4,565 90.6% Black or African American581 96.1% American Indian / Alaska Native1,991 70.3% Asian6 95.3% Native Hawaiian / Pacific Islander6,117 82.9% Other race2,153 86.3% Two or more races5,345 82.0% White alone, not Hispanic / Latino6,824 81.8% Hispanic or LatinoMoved within same county 383 5.4% White / Caucasian188 3.7% Black or African American149 5.3% Asian546 7.4% Other race155 6.2% Two or more races337 5.2% White alone, not Hispanic / Latino1,050 12.6% Hispanic or LatinoMoved within same state 401 5.7% White / Caucasian82 1.6% Black or African American439 15.5% Asian116 1.6% Other race366 5.6% White alone, not Hispanic / Latino192 2.3% Hispanic or LatinoMoved from different state 254 3.6% White / Caucasian230 4.6% Black or African American42 1.5% Asian50 0.7% Other race107 4.3% Two or more races270 4.1% White alone, not Hispanic / Latino52 0.6% Hispanic or LatinoMoved from abroad 179 2.5% White6 0.1% Black or African American283 10.0% Asian375 5.1% Other race15 0.6% Two or more races202 3.1% White alone, not Hispanic / Latino215 2.6% Hispanic or Latino
Children Nativity (place of birth) in Bailey's Crossroads
Children under 6 years - Living with two parents Both parents native 166 100.0% NativeBoth parents foreign-born 1,264 78.1% Native354 21.9% Foreign-bornOne native, one foreign-born parent 150 100.0% NativeChildren under 6 years - Living with one parent Native parent 40 66.9% Native20 33.1% Foreign-bornForeign-born parent 317 79.0% Native84 21.0% Foreign-bornChildren 6 to 17 years - Living with two parents Both parents native 233 98.6% Native3 1.4% Foreign-bornBoth parents foreign-born 1,023 82.6% Native215 17.4% Foreign-bornOne native, one foreign-born parent 408 100.0% NativeChildren 6 to 17 years - Living with one parent Foreign-born parent 1,252 57.7% Native919 42.3% Foreign-born
Place of birth for residents in Bailey's Crossroads 5,241 Americas5,161 Latin America3,956 Central America3,590 Asia2,981 Africa1,974 South Central Asia1,748 Eastern Africa1,108 South America743 South Eastern Asia728 Northern Africa633 Western Asia285 Western Africa252 Europe184 Eastern Asia105 Eastern Europe96 Caribbean95 China79 Northern America75 Middle Africa58 Southern Africa53 Northern Europe51 Southern Europe41 Western Europe17 Oceania17 Australia and New Zealand Subregion2,085 Guatemala1,476 Ethiopia1,266 Afghanistan1,045 El Salvador571 Bolivia472 Honduras350 Sudan315 India289 Philippines248 Morocco229 Peru201 Mexico184 Sierra Leone180 Cambodia164 Vietnam156 Eritrea152 Iraq141 Nepal140 Yemen129 Egypt111 Pakistan105 Somalia101 Ghana99 Thailand86 United Arab Emirates80 Costa Rica80 Argentina79 Canada78 Korea76 Cuba74 Russia73 Bangladesh72 Chile71 Nicaragua58 Turkey58 South Africa56 Lebanon50 China48 Brazil44 Guyana42 Syria40 United Kingdom35 Sri Lanka34 Taiwan31 Democratic Republic of Congo (Zaire)31 Germany31 Congo28 Jordan27 Portugal23 Ecuador22 Armenia20 Venezuela19 Haiti17 Australia16 Iran15 Colombia13 Spain13 Israel12 Kazakhstan12 Scotland12 Georgia10 Poland10 Bosnia and Herzegovina9 Indonesia9 Kenya9 Japan9 Hong Kong9 Greece9 Austria8 Romania8 Kuwait7 Saudi Arabia
Grandparents responsible for own grandchildren in Bailey's Crossroads
Grandparents (30 to 59 years) White / Caucasian 13 100.0% Not responsible for grandchildrenBlack or African American 5 100.0% Not responsible for grandchildrenTwo or more races 44 100.0% Responsible for grandchildrenHispanic or Latino 21 100.0% Not responsible for grandchildrenGrandparents (60 years and over) White / Caucasian 24 100.0% Not responsible for grandchildrenBlack or African American 15 14.0% Responsible for grandchildren93 86.0% Not responsible for grandchildrenTwo or more races 27 100.0% Not responsible for grandchildren