Races in Azle, Texas (TX) Detailed Stats
Data:
Races - White alone (%)
Races - White alone (% change since 2000)
Races - Black alone (%)
Races - Black alone (% change since 2000)
Races - American Indian alone (%)
Races - American Indian alone (% change since 2000)
Races - Asian alone (%)
Races - Asian alone (% change since 2000)
Races - Hispanic (%)
Races - Hispanic (% change since 2000)
Races - Native Hawaiian and Other Pacific Islander alone (%)
Races - Native Hawaiian and Other Pacific Islander alone (% change since 2000)
Races - Two or more races(%)
Races - Two or more races(% change since 2000)
Races - Other race alone (%)
Races - Other race alone (% change since 2000)
Racial diversity
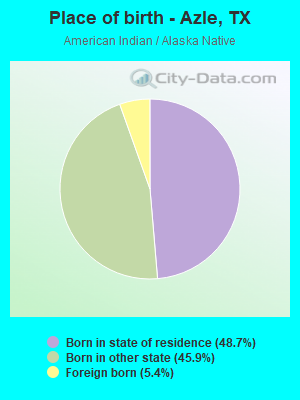
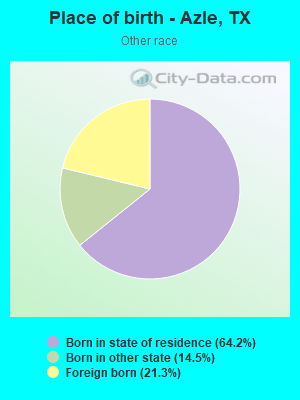
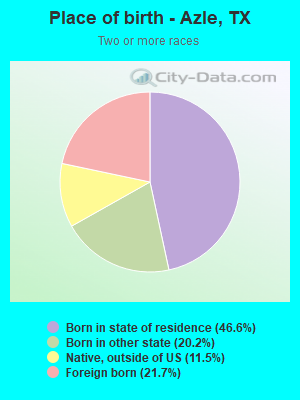
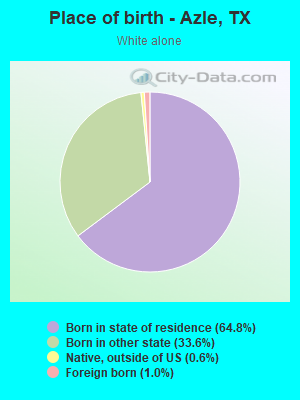
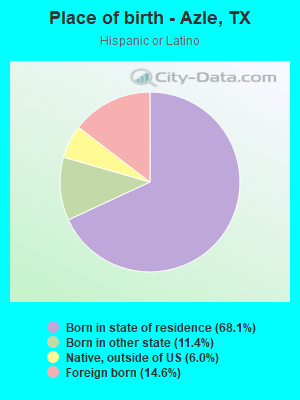
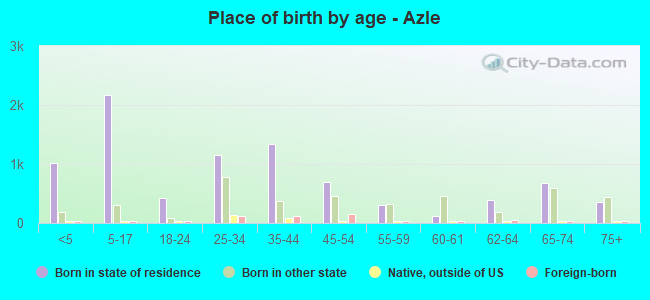
Place of birth - Born in state of residence (%)
Place of birth - Born in state of residence (%) - White
Place of birth - Born in state of residence (%) - Black or African American
Place of birth - Born in state of residence (%) - Asian
Place of birth - Born in state of residence (%) - Hispanic or Latino
Place of birth - Born in state of residence (%) - American Indian and Alaska Native
Place of birth - Born in state of residence (%) - Multirace
Place of birth - Born in state of residence (%) - Other Race
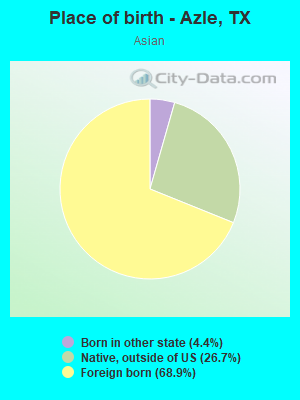
Place of birth - Born in other state (%)
Place of birth - Born in other state (%) - White
Place of birth - Born in other state (%) - Black or African American
Place of birth - Born in other state (%) - Asian
Place of birth - Born in other state (%) - Hispanic or Latino
Place of birth - Born in other state (%) - American Indian and Alaska Native
Place of birth - Born in other state (%) - Multirace
Place of birth - Born in other state (%) - Other Race
Place of birth - Native, outside of US (%)
Place of birth - Native, outside of US (%) - White
Place of birth - Native, outside of US (%) - Black or African American
Place of birth - Native, outside of US (%) - Asian
Place of birth - Native, outside of US (%) - Hispanic or Latino
Place of birth - Native, outside of US (%) - American Indian and Alaska Native
Place of birth - Native, outside of US (%) - Multirace
Place of birth - Native, outside of US (%) - Other Race
Place of birth - Foreign born (%)
Place of birth - Foreign born (%) - White
Place of birth - Foreign born (%) - Black or African American
Place of birth - Foreign born (%) - Asian
Place of birth - Foreign born (%) - Hispanic or Latino
Place of birth - Foreign born (%) - American Indian and Alaska Native
Place of birth - Foreign born (%) - Multirace
Place of birth - Foreign born (%) - Other Race
Residents speaking English at home (%)
Residents speaking English at home - Born in the United States (%)
Residents speaking English at home - Native, born elsewhere (%)
Residents speaking English at home - Foreign born (%)
Residents speaking Spanish at home (%)
Residents speaking Spanish at home - Born in the United States (%)
Residents speaking Spanish at home - Native, born elsewhere (%)
Residents speaking Spanish at home - Foreign born (%)
Residents speaking other language at home (%)
Residents speaking other language at home - Born in the United States (%)
Residents speaking other language at home - Native, born elsewhere (%)
Residents speaking other language at home - Foreign born (%)
Marital status - Never married (%)
Marital status - Now married (%)
Marital status - Separated (%)
Marital status - Widowed (%)
Marital status - Divorced (%)
Ancestries Reported - Arab (%)
Ancestries Reported - Czech (%)
Ancestries Reported - Danish (%)
Ancestries Reported - Dutch (%)
Ancestries Reported - English (%)
Ancestries Reported - French (%)
Ancestries Reported - French Canadian (%)
Ancestries Reported - German (%)
Ancestries Reported - Greek (%)
Ancestries Reported - Hungarian (%)
Ancestries Reported - Irish (%)
Ancestries Reported - Italian (%)
Ancestries Reported - Lithuanian (%)
Ancestries Reported - Norwegian (%)
Ancestries Reported - Polish (%)
Ancestries Reported - Portuguese (%)
Ancestries Reported - Russian (%)
Ancestries Reported - Scotch-Irish (%)
Ancestries Reported - Scottish (%)
Ancestries Reported - Slovak (%)
Ancestries Reported - Subsaharan African (%)
Ancestries Reported - Swedish (%)
Ancestries Reported - Swiss (%)
Ancestries Reported - Ukrainian (%)
Ancestries Reported - United States (%)
Ancestries Reported - Welsh (%)
Ancestries Reported - West Indian (%)
Ancestries Reported - Other (%)
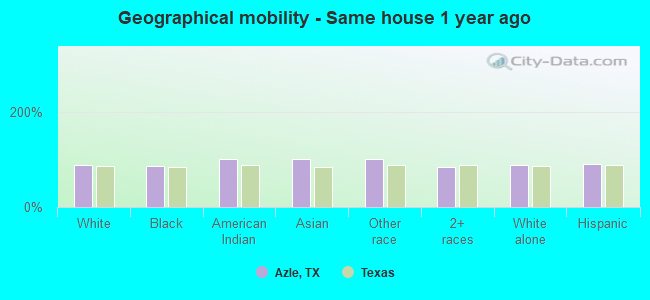
Geographical mobility - Same house 1 year ago (%)
Geographical mobility - Same house 1 year ago (%) - White
Geographical mobility - Same house 1 year ago (%) - Black or African American
Geographical mobility - Same house 1 year ago (%) - Asian
Geographical mobility - Same house 1 year ago (%) - Hispanic or Latino
Geographical mobility - Same house 1 year ago (%) - American Indian and Alaska Native
Geographical mobility - Same house 1 year ago (%) - Multirace
Geographical mobility - Same house 1 year ago (%) - Other Race
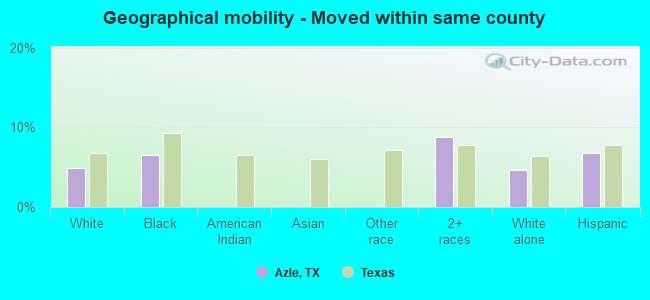
Geographical mobility - Moved within same county (%)
Geographical mobility - Moved within same county (%) - White
Geographical mobility - Moved within same county (%) - Black or African American
Geographical mobility - Moved within same county (%) - Asian
Geographical mobility - Moved within same county (%) - Hispanic or Latino
Geographical mobility - Moved within same county (%) - American Indian and Alaska Native
Geographical mobility - Moved within same county (%) - Multirace
Geographical mobility - Moved within same county (%) - Other Race
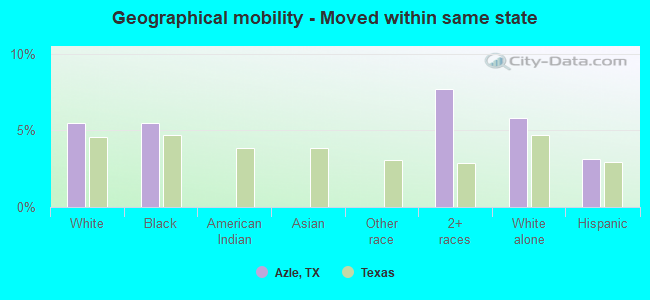
Geographical mobility - Moved from different county within same state (%)
Geographical mobility - Moved from different county within same state (%) - White
Geographical mobility - Moved from different county within same state (%) - Black or African American
Geographical mobility - Moved from different county within same state (%) - Asian
Geographical mobility - Moved from different county within same state (%) - Hispanic or Latino
Geographical mobility - Moved from different county within same state (%) - American Indian and Alaska Native
Geographical mobility - Moved from different county within same state (%) - Multirace
Geographical mobility - Moved from different county within same state (%) - Other Race
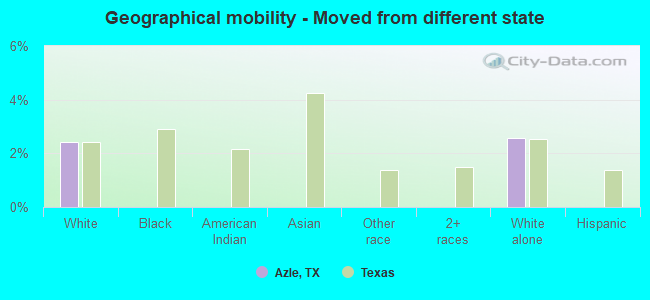
Geographical mobility - Moved from different state (%)
Geographical mobility - Moved from different state (%) - White
Geographical mobility - Moved from different state (%) - Black or African American
Geographical mobility - Moved from different state (%) - Asian
Geographical mobility - Moved from different state (%) - Hispanic or Latino
Geographical mobility - Moved from different state (%) - American Indian and Alaska Native
Geographical mobility - Moved from different state (%) - Multirace
Geographical mobility - Moved from different state (%) - Other Race
Geographical mobility - Moved from abroad (%)
Geographical mobility - Moved from abroad (%) - White
Geographical mobility - Moved from abroad (%) - Black or African American
Geographical mobility - Moved from abroad (%) - Asian
Geographical mobility - Moved from abroad (%) - Hispanic or Latino
Geographical mobility - Moved from abroad (%) - American Indian and Alaska Native
Geographical mobility - Moved from abroad (%) - Multirace
Geographical mobility - Moved from abroad (%) - Other Race
Place of birth for the foreign-born population - Ireland (%)
Place of birth for the foreign-born population - Denmark (%)
Place of birth for the foreign-born population - Norway (%)
Place of birth for the foreign-born population - Sweden (%)
Place of birth for the foreign-born population - United Kingdom (%)
Place of birth for the foreign-born population - England (%)
Place of birth for the foreign-born population - Scotland (%)
Place of birth for the foreign-born population - Other Northern Europe (%)
Place of birth for the foreign-born population - Austria (%)
Place of birth for the foreign-born population - Belgium (%)
Place of birth for the foreign-born population - France (%)
Place of birth for the foreign-born population - Germany (%)
Place of birth for the foreign-born population - Netherlands (%)
Place of birth for the foreign-born population - Switzerland (%)
Place of birth for the foreign-born population - Other Western Europe (%)
Place of birth for the foreign-born population - Greece (%)
Place of birth for the foreign-born population - Italy (%)
Place of birth for the foreign-born population - Portugal (%)
Place of birth for the foreign-born population - Spain (%)
Place of birth for the foreign-born population - Other Southern Europe (%)
Place of birth for the foreign-born population - Albania (%)
Place of birth for the foreign-born population - Belarus (%)
Place of birth for the foreign-born population - Bosnia and Herzegovina (%)
Place of birth for the foreign-born population - Bulgaria (%)
Place of birth for the foreign-born population - Croatia (%)
Place of birth for the foreign-born population - Czechoslovakia (%)
Place of birth for the foreign-born population - Hungary (%)
Place of birth for the foreign-born population - Latvia (%)
Place of birth for the foreign-born population - Lithuania (%)
Place of birth for the foreign-born population - North Macedonia (Macedonia) (%)
Place of birth for the foreign-born population - Moldova (%)
Place of birth for the foreign-born population - Poland (%)
Place of birth for the foreign-born population - Romania (%)
Place of birth for the foreign-born population - Russia (%)
Place of birth for the foreign-born population - Serbia (%)
Place of birth for the foreign-born population - Ukraine (%)
Place of birth for the foreign-born population - Other Eastern Europe (%)
Place of birth for the foreign-born population - China (%)
Place of birth for the foreign-born population - Hong Kong (%)
Place of birth for the foreign-born population - Taiwan (%)
Place of birth for the foreign-born population - Japan (%)
Place of birth for the foreign-born population - Korea (%)
Place of birth for the foreign-born population - Other Eastern Asia (%)
Place of birth for the foreign-born population - Afghanistan (%)
Place of birth for the foreign-born population - Bangladesh (%)
Place of birth for the foreign-born population - India (%)
Place of birth for the foreign-born population - Iran (%)
Place of birth for the foreign-born population - Kazakhstan (%)
Place of birth for the foreign-born population - Nepal (%)
Place of birth for the foreign-born population - Pakistan (%)
Place of birth for the foreign-born population - Sri Lanka (%)
Place of birth for the foreign-born population - Uzbekistan (%)
Place of birth for the foreign-born population - Other South Central Asia (%)
Place of birth for the foreign-born population - Burma (%)
Place of birth for the foreign-born population - Cambodia (%)
Place of birth for the foreign-born population - Indonesia (%)
Place of birth for the foreign-born population - Laos (%)
Place of birth for the foreign-born population - Malaysia (%)
Place of birth for the foreign-born population - Philippines (%)
Place of birth for the foreign-born population - Singapore (%)
Place of birth for the foreign-born population - Thailand (%)
Place of birth for the foreign-born population - Vietnam (%)
Place of birth for the foreign-born population - Other South Eastern Asia (%)
Place of birth for the foreign-born population - Armenia (%)
Place of birth for the foreign-born population - Iraq (%)
Place of birth for the foreign-born population - Israel (%)
Place of birth for the foreign-born population - Jordan (%)
Place of birth for the foreign-born population - Kuwait (%)
Place of birth for the foreign-born population - Lebanon (%)
Place of birth for the foreign-born population - Saudi Arabia (%)
Place of birth for the foreign-born population - Syria (%)
Place of birth for the foreign-born population - Turkey (%)
Place of birth for the foreign-born population - Yemen (%)
Place of birth for the foreign-born population - Other Western Asia (%)
Place of birth for the foreign-born population - Eritrea (%)
Place of birth for the foreign-born population - Ethiopia (%)
Place of birth for the foreign-born population - Kenya (%)
Place of birth for the foreign-born population - Somalia (%)
Place of birth for the foreign-born population - Uganda (%)
Place of birth for the foreign-born population - Zimbabwe (%)
Place of birth for the foreign-born population - Other Eastern Africa (%)
Place of birth for the foreign-born population - Cameroon (%)
Place of birth for the foreign-born population - Congo (%)
Place of birth for the foreign-born population - Democratic Republic of Congo (Zaire) (%)
Place of birth for the foreign-born population - Other Middle Africa (%)
Place of birth for the foreign-born population - Egypt (%)
Place of birth for the foreign-born population - Morocco (%)
Place of birth for the foreign-born population - Sudan (%)
Place of birth for the foreign-born population - Other Northern Africa (%)
Place of birth for the foreign-born population - South Africa (%)
Place of birth for the foreign-born population - Other Southern Africa (%)
Place of birth for the foreign-born population - Cabo Verde (%)
Place of birth for the foreign-born population - Ghana (%)
Place of birth for the foreign-born population - Liberia (%)
Place of birth for the foreign-born population - Nigeria (%)
Place of birth for the foreign-born population - Senegal (%)
Place of birth for the foreign-born population - Sierra Leone (%)
Place of birth for the foreign-born population - Other Western Africa (%)
Place of birth for the foreign-born population - Australia (%)
Place of birth for the foreign-born population - New Zealand (%)
Place of birth for the foreign-born population - Fiji (%)
Place of birth for the foreign-born population - Micronesia (%)
Place of birth for the foreign-born population - Bahamas (%)
Place of birth for the foreign-born population - Barbados (%)
Place of birth for the foreign-born population - Cuba (%)
Place of birth for the foreign-born population - Dominica (%)
Place of birth for the foreign-born population - Dominican Republic (%)
Place of birth for the foreign-born population - Grenada (%)
Place of birth for the foreign-born population - Haiti (%)
Place of birth for the foreign-born population - Jamaica (%)
Place of birth for the foreign-born population - St. Vincent and the Grenadines (%)
Place of birth for the foreign-born population - Trinidad and Tobago (%)
Place of birth for the foreign-born population - West Indies (%)
Place of birth for the foreign-born population - Other Caribbean (%)
Place of birth for the foreign-born population - Belize (%)
Place of birth for the foreign-born population - Costa Rica (%)
Place of birth for the foreign-born population - El Salvador (%)
Place of birth for the foreign-born population - Guatemala (%)
Place of birth for the foreign-born population - Honduras (%)
Place of birth for the foreign-born population - Mexico (%)
Place of birth for the foreign-born population - Nicaragua (%)
Place of birth for the foreign-born population - Panama (%)
Place of birth for the foreign-born population - Other Central America (%)
Place of birth for the foreign-born population - Argentina (%)
Place of birth for the foreign-born population - Bolivia (%)
Place of birth for the foreign-born population - Brazil (%)
Place of birth for the foreign-born population - Chile (%)
Place of birth for the foreign-born population - Colombia (%)
Place of birth for the foreign-born population - Ecuador (%)
Place of birth for the foreign-born population - Guyana (%)
Place of birth for the foreign-born population - Peru (%)
Place of birth for the foreign-born population - Uruguay (%)
Place of birth for the foreign-born population - Venezuela (%)
Place of birth for the foreign-born population - Other South America (%)
Place of birth for the foreign-born population - Canada (%)
Place of birth for the foreign-born population - Other Northern America (%)
Place of birth for the foreign-born population - Other (%)
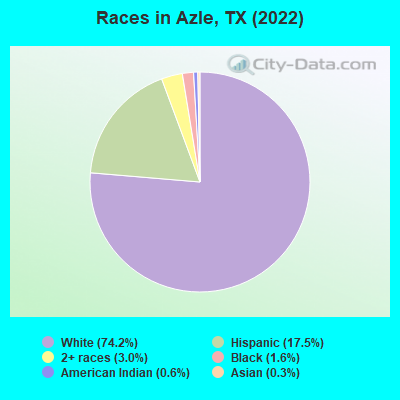
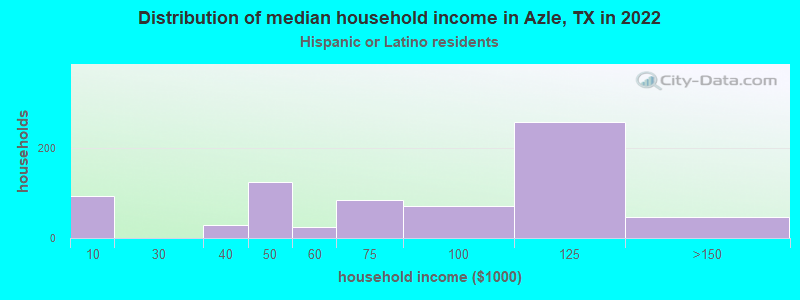
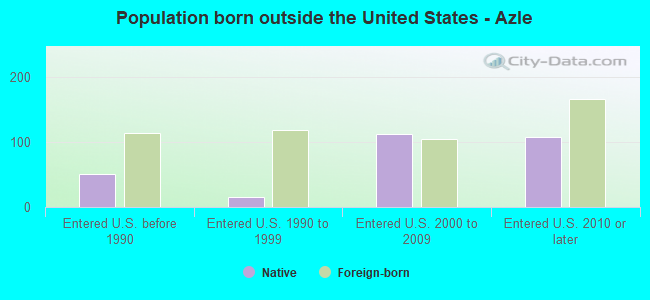
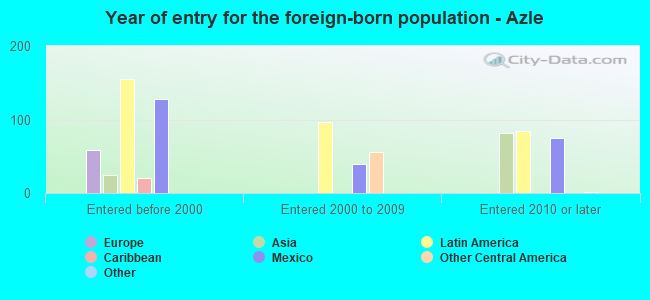
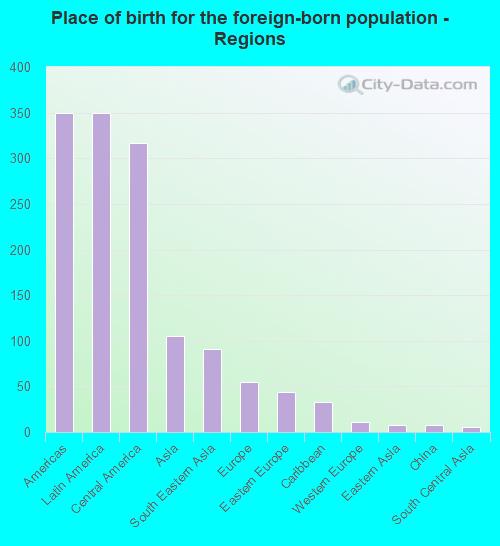
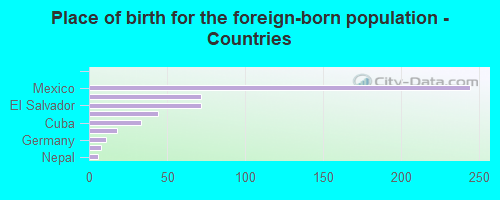
According to 2022 data, the most numerous races in Azle, TX are Hispanic (2,390 residents), White alone (10,143 residents), and Black alone (224 residents). 89.5% of Azle residents speak English at home. 3.7% of Azle, TX residents are foreign-born (2.5% born in Latin America, 0.8% born in Asia, 0.4% born in Europe), which is 353.8% less than the foreign-born rate of 17.0% across the entire state of Texas.
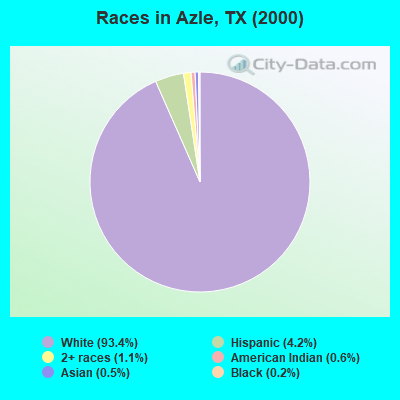
Race distribution in Azle
2000 2022
10,933,313 52.4% White alone 6,669,666 32.0% Hispanic 2,364,255 11.3% Black alone 554,445 2.7% Asian alone 230,567 1.1% Two or more races 68,859 0.3% American Indian alone 19,958 0.10% Other race alone 10,757 0.05% Native Hawaiian and Other
12,070,642 40.2% Hispanic 11,683,430 38.9% White alone 3,508,706 11.7% Black alone 1,608,173 5.4% Asian alone 956,560 3.2% Two or more races 125,763 0.4% Other race alone 47,023 0.2% American Indian alone 29,275 0.10% Native Hawaiian and Other
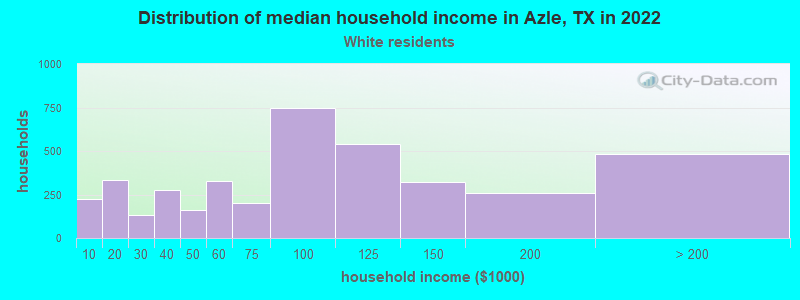
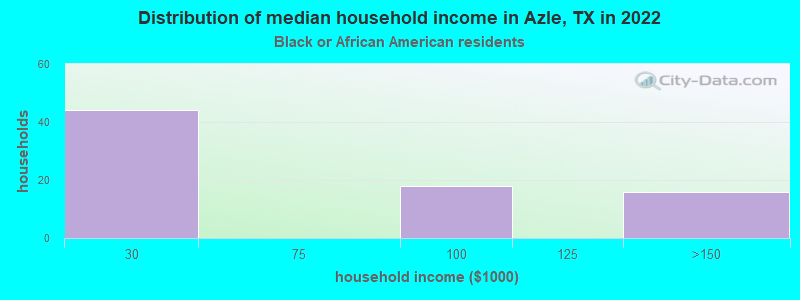
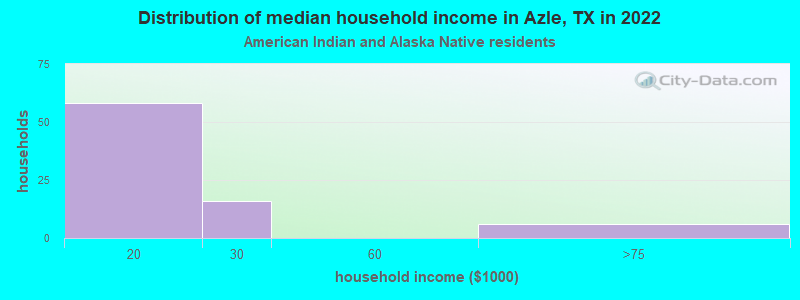
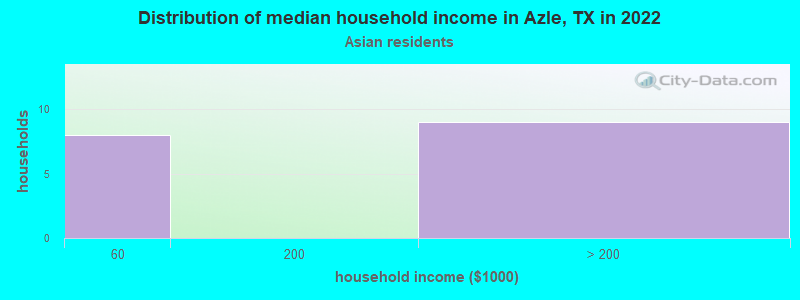
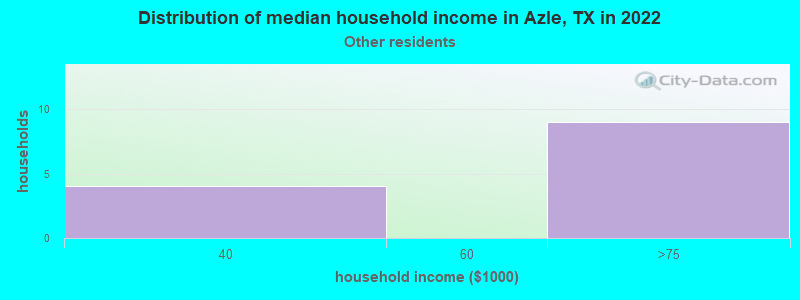
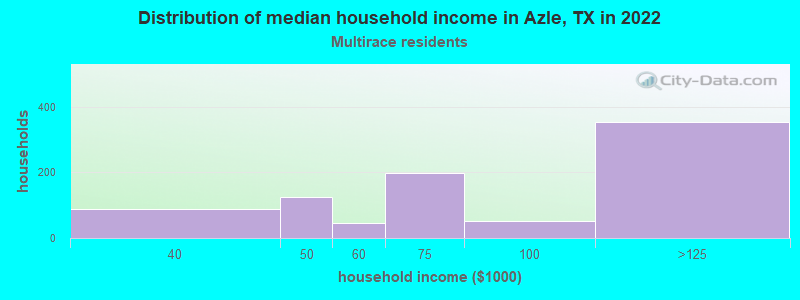
Income and house value in Azle Median household income in 2022 $81,110 White non-Hispanic householders$17,485 American Indian and Alaska Native householders$76,157 Two or more races householders$79,033 Hispanic or Latino race householdersMedian 2022 house value $266,397 White Non-Hispanic householders$182,841 Some other race householders$266,725 Two or more races householders$272,951 Hispanic or Latino householders
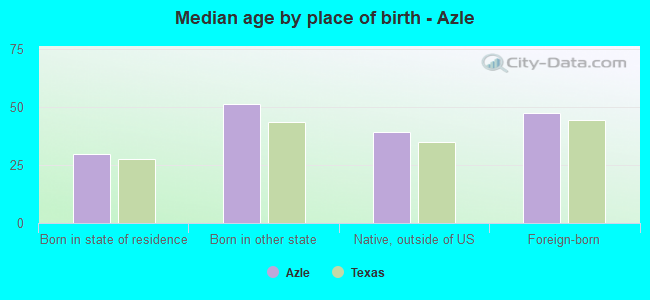
Median age by race in Azle
40.1 Median age for White residents37.8 41.0 29.1 Median age for Black or African American residents28.4 29.4 78.2 Median age for American Indian / Alaska Native residents-867,996,200.5 72.0 70.1 Median age for Asian residents-683,615,818.5 69.0 -565,040,649.8 Median age for Native Hawaiian / Pacific Islander residents-550,102,248.9 -551,928,782.8 43.1 Median age for Other race residents42.5 34.5 35.2 Median age for Two or more races residents33.3 38.2 40.5 Median age for White alone residents40.2 40.8 31.9 Median age for Hispanic or Latino residents24.5 33.9
Owner/renter occupied households by race in Azle
House owners and renters - White residents 3,039 75.5% Owner occupied987 24.5% Renter occupiedHouse owners and renters - Black or African American residents 38 43.2% Owner occupied50 56.8% Renter occupiedHouse owners and renters - American Indian / Alaska Native residents 59 81.3% Owner occupied14 18.7% Renter occupiedHouse owners and renters - Asian residents 17 100.0% Owner occupiedHouse owners and renters - Other race residents 12 65.6% Owner occupied6 34.4% Renter occupiedHouse owners and renters - Two or more races residents 701 79.4% Owner occupied182 20.6% Renter occupiedHouse owners and renters - White alone residents 3,160 76.9% Owner occupied950 23.1% Renter occupiedHouse owners and renters - Hispanic or Latino residents 486 67.1% Owner occupied238 32.9% Renter occupied
Language usage in Azle
English speakers - Total 89.5% of residents of Azle speak English at home.
9.1% of residents speak Spanish at home 863 76.5% Speak English very well265 23.5% Speak English less than very well1.0% of residents speak other language at home 57 46.3% Speak English very well66 53.7% Speak English less than very well
English speakers - Born in the United States 94.0% of residents of Azle speak English at home.
4.8% of residents speak Spanish at home 192 100.0% Speak English very well0.1% of residents speak other language at home 6 100.0% Speak English very well
English speakers - Native, born elsewhere 28.4% of residents of Azle speak English at home.
59.6% of residents speak Spanish at home 170 100.0% Speak English very well15.8% of residents speak other language at home 45 100.0% Speak English very well
English speakers - Foreign-born 18.9% of residents of Azle speak English at home.
63.6% of residents speak Spanish at home 119 37.2% Speak English very well201 62.8% Speak English less than very well16.9% of residents speak other language at home 20 23.5% Speak English very well65 76.5% Speak English less than very well
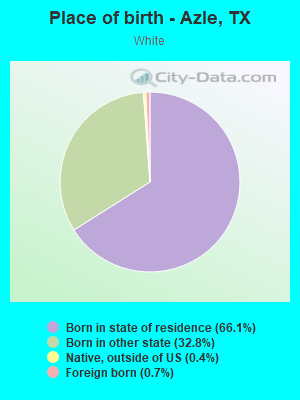
White (Caucasian) - Speak only English Native:
100.0% (9,471)Foreign-born:
82.4% (62)
White (Caucasian) - Speak another language Native:
1.7% (164)Foreign-born:
45.2% (34)
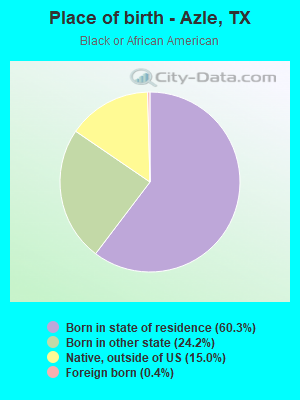
Black or African American - Speak another language Native:
16.3% (28)Foreign-born:
100.0% (1)
Asian - Speak another language Native:
88.1% (12)Foreign-born:
98.6% (33)
Other race - Speak another language Native:
78.3% (55)Foreign-born:
97.6% (18)
Two or more races - Speak only English Native:
49.1% (780)Foreign-born:
5.0% (29)
Two or more races - Speak another language Native:
51.6% (820)Foreign-born:
94.7% (540)
White alone - Speak only English Native:
99.7% (9,285)Foreign-born:
67.0% (68)
White alone - Speak another language Native:
0.6% (57)Foreign-born:
39.6% (40)
Hispanic or Latino - Speak only English Native:
57.0% (1,008)Foreign-born:
6.7% (23)
Hispanic or Latino - Speak another language Native:
41.8% (739)Foreign-born:
93.2% (324)
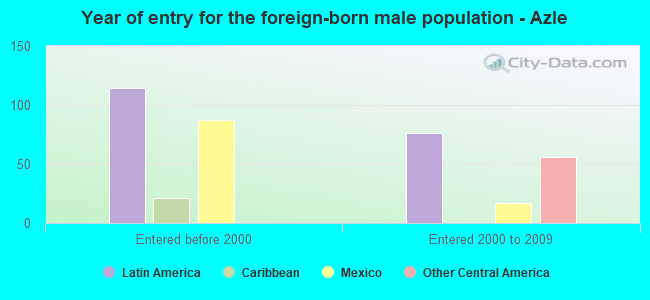
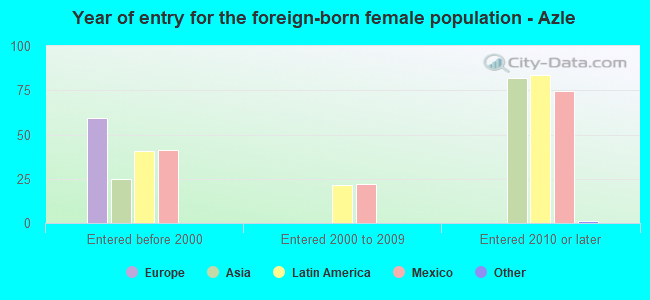
Foreign-born residents in Azle 512 residents are foreign born (2.5% Latin America , 0.8% Asia , 0.4% Europe ).
This city:
3.7%Texas:
17.1%
Marital status for residents in Azle Marital status - White (Caucasian) population 15 years and over
Males 20.6% Never married59.1% Now married1.1% Separated6.1% Widowed13.2% DivorcedFemales 13.2% Never married59.0% Now married1.5% Separated11.5% Widowed14.8% DivorcedWomen who gave birth in the past 12 months Now married:
68.3% (116)Unmarried:
31.7% (54)
Women who did not give birth in the past 12 months Now married:
62.4% (1,111)Unmarried:
37.6% (670)
Marital status - Black or African American population 15 years and over
Males 54.4% Never married44.3% Now married0.0% Separated0.0% Widowed1.3% DivorcedFemales 60.7% Never married22.6% Now married0.0% Separated15.5% Widowed1.2% DivorcedWomen who did not give birth in the past 12 months Now married:
0.0% (0)Unmarried:
100.0% (52)
Marital status - American Indian / Alaska Native population 15 years and over
Males 26.7% Never married73.3% Now married0.0% Separated0.0% Widowed0.0% DivorcedFemales 0.0% Never married8.0% Now married0.0% Separated31.0% Widowed60.9% DivorcedWomen who did not give birth in the past 12 months Now married:
100.0% (10)Unmarried:
0.0% (0)
Marital status - Asian population 15 years and over
Males 0.0% Never married100.0% Now married0.0% Separated0.0% Widowed0.0% DivorcedFemales 0.0% Never married70.6% Now married0.0% Separated29.4% Widowed0.0% DivorcedWomen who did not give birth in the past 12 months Now married:
100.0% (6)Unmarried:
0.0% (0)
Marital status - Other race population 15 years and over
Males 0.0% Never married42.6% Now married0.0% Separated0.0% Widowed57.4% DivorcedFemales 61.3% Never married0.0% Now married0.0% Separated38.7% Widowed0.0% DivorcedWomen who did not give birth in the past 12 months Now married:
0.0% (0)Unmarried:
100.0% (18)
Marital status - Two or more races population 15 years and over
Males 16.8% Never married75.7% Now married0.0% Separated0.8% Widowed6.7% DivorcedFemales 0.0% Never married100.0% Now married0.0% Separated0.0% Widowed0.0% DivorcedWomen who gave birth in the past 12 months Now married:
100.0% (121)Unmarried:
0.0% (0)
Women who did not give birth in the past 12 months Now married:
100.0% (401)Unmarried:
0.0% (0)
Marital status - White alone, not Hispanic / Latino population 15 years and over
Males 17.0% Never married61.2% Now married1.2% Separated6.5% Widowed14.1% DivorcedFemales 11.4% Never married60.8% Now married1.6% Separated11.8% Widowed14.4% DivorcedWomen who gave birth in the past 12 months Now married:
68.3% (131)Unmarried:
31.7% (61)
Women who did not give birth in the past 12 months Now married:
65.9% (1,185)Unmarried:
34.1% (613)
Marital status - Hispanic or Latino population 15 years and over
Males 30.1% Never married60.4% Now married0.1% Separated0.0% Widowed9.4% DivorcedFemales 19.9% Never married66.2% Now married0.0% Separated5.0% Widowed8.8% DivorcedWomen who gave birth in the past 12 months Now married:
100.0% (74)Unmarried:
0.0% (0)
Women who did not give birth in the past 12 months Now married:
64.5% (328)Unmarried:
35.5% (181)
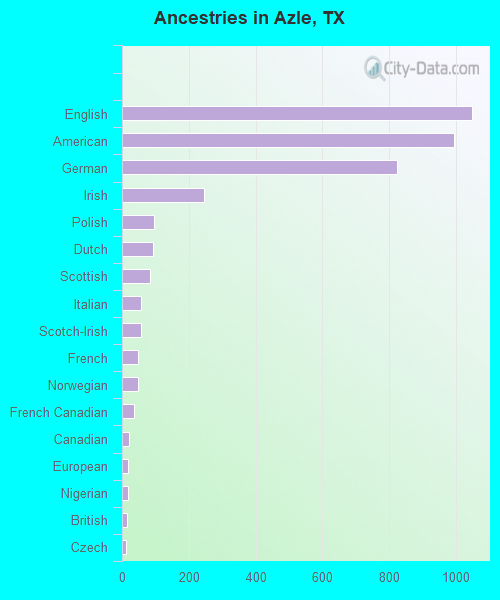
Ancestries in Azle
1,047 17.4% English996 16.5% American824 13.7% German247 4.1% Irish95 1.6% Polish93 1.5% Dutch83 1.4% Scottish57 0.9% Italian56 0.9% Scotch-Irish47 0.8% French47 0.8% Norwegian37 0.6% French Canadian21 0.3% Canadian18 0.3% European18 0.3% Nigerian16 0.3% British13 0.2% Czech6 0.10% Welsh
Children Nativity (place of birth) in Azle
Children under 6 years - Living with two parents Both parents native 890 100.0% NativeOne native, one foreign-born parent 223 100.0% NativeChildren under 6 years - Living with one parent Native parent 347 100.0% NativeChildren 6 to 17 years - Living with two parents Both parents native 1,483 100.0% NativeBoth parents foreign-born 75 100.0% NativeOne native, one foreign-born parent 28 100.0% NativeChildren 6 to 17 years - Living with one parent Native parent 653 100.0% NativeForeign-born parent 14 49.9% Native14 50.1% Foreign-born
Grandparents responsible for own grandchildren in Azle
Grandparents (30 to 59 years) White / Caucasian 21 58.3% Responsible for grandchildren15 41.7% Not responsible for grandchildrenOther race 6 100.0% Responsible for grandchildrenTwo or more races 9 22.4% Responsible for grandchildren30 77.6% Not responsible for grandchildrenWhite alone, not Hispanic / Latino 25 88.9% Responsible for grandchildren3 11.1% Not responsible for grandchildrenHispanic or Latino 13 28.0% Responsible for grandchildren32 72.0% Not responsible for grandchildren
Grandparents (60 years and over) White / Caucasian 44 100.0% Not responsible for grandchildrenWhite alone, not Hispanic / Latino 45 100.0% Not responsible for grandchildren