Races in Ashton-Sandy Spring, Maryland (MD) Detailed Stats
Data:
Races - White alone (%)
Races - White alone (% change since 2000)
Races - Black alone (%)
Races - Black alone (% change since 2000)
Races - American Indian alone (%)
Races - American Indian alone (% change since 2000)
Races - Asian alone (%)
Races - Asian alone (% change since 2000)
Races - Hispanic (%)
Races - Hispanic (% change since 2000)
Races - Native Hawaiian and Other Pacific Islander alone (%)
Races - Native Hawaiian and Other Pacific Islander alone (% change since 2000)
Races - Two or more races(%)
Races - Two or more races(% change since 2000)
Races - Other race alone (%)
Races - Other race alone (% change since 2000)
Racial diversity
Place of birth - Born in state of residence (%)
Place of birth - Born in state of residence (%) - White
Place of birth - Born in state of residence (%) - Black or African American
Place of birth - Born in state of residence (%) - Asian
Place of birth - Born in state of residence (%) - Hispanic or Latino
Place of birth - Born in state of residence (%) - American Indian and Alaska Native
Place of birth - Born in state of residence (%) - Multirace
Place of birth - Born in state of residence (%) - Other Race
Place of birth - Born in other state (%)
Place of birth - Born in other state (%) - White
Place of birth - Born in other state (%) - Black or African American
Place of birth - Born in other state (%) - Asian
Place of birth - Born in other state (%) - Hispanic or Latino
Place of birth - Born in other state (%) - American Indian and Alaska Native
Place of birth - Born in other state (%) - Multirace
Place of birth - Born in other state (%) - Other Race
Place of birth - Native, outside of US (%)
Place of birth - Native, outside of US (%) - White
Place of birth - Native, outside of US (%) - Black or African American
Place of birth - Native, outside of US (%) - Asian
Place of birth - Native, outside of US (%) - Hispanic or Latino
Place of birth - Native, outside of US (%) - American Indian and Alaska Native
Place of birth - Native, outside of US (%) - Multirace
Place of birth - Native, outside of US (%) - Other Race
Place of birth - Foreign born (%)
Place of birth - Foreign born (%) - White
Place of birth - Foreign born (%) - Black or African American
Place of birth - Foreign born (%) - Asian
Place of birth - Foreign born (%) - Hispanic or Latino
Place of birth - Foreign born (%) - American Indian and Alaska Native
Place of birth - Foreign born (%) - Multirace
Place of birth - Foreign born (%) - Other Race
Residents speaking English at home (%)
Residents speaking English at home - Born in the United States (%)
Residents speaking English at home - Native, born elsewhere (%)
Residents speaking English at home - Foreign born (%)
Residents speaking Spanish at home (%)
Residents speaking Spanish at home - Born in the United States (%)
Residents speaking Spanish at home - Native, born elsewhere (%)
Residents speaking Spanish at home - Foreign born (%)
Residents speaking other language at home (%)
Residents speaking other language at home - Born in the United States (%)
Residents speaking other language at home - Native, born elsewhere (%)
Residents speaking other language at home - Foreign born (%)
Marital status - Never married (%)
Marital status - Now married (%)
Marital status - Separated (%)
Marital status - Widowed (%)
Marital status - Divorced (%)
Ancestries Reported - Arab (%)
Ancestries Reported - Czech (%)
Ancestries Reported - Danish (%)
Ancestries Reported - Dutch (%)
Ancestries Reported - English (%)
Ancestries Reported - French (%)
Ancestries Reported - French Canadian (%)
Ancestries Reported - German (%)
Ancestries Reported - Greek (%)
Ancestries Reported - Hungarian (%)
Ancestries Reported - Irish (%)
Ancestries Reported - Italian (%)
Ancestries Reported - Lithuanian (%)
Ancestries Reported - Norwegian (%)
Ancestries Reported - Polish (%)
Ancestries Reported - Portuguese (%)
Ancestries Reported - Russian (%)
Ancestries Reported - Scotch-Irish (%)
Ancestries Reported - Scottish (%)
Ancestries Reported - Slovak (%)
Ancestries Reported - Subsaharan African (%)
Ancestries Reported - Swedish (%)
Ancestries Reported - Swiss (%)
Ancestries Reported - Ukrainian (%)
Ancestries Reported - United States (%)
Ancestries Reported - Welsh (%)
Ancestries Reported - West Indian (%)
Ancestries Reported - Other (%)
Geographical mobility - Same house 1 year ago (%)
Geographical mobility - Same house 1 year ago (%) - White
Geographical mobility - Same house 1 year ago (%) - Black or African American
Geographical mobility - Same house 1 year ago (%) - Asian
Geographical mobility - Same house 1 year ago (%) - Hispanic or Latino
Geographical mobility - Same house 1 year ago (%) - American Indian and Alaska Native
Geographical mobility - Same house 1 year ago (%) - Multirace
Geographical mobility - Same house 1 year ago (%) - Other Race
Geographical mobility - Moved within same county (%)
Geographical mobility - Moved within same county (%) - White
Geographical mobility - Moved within same county (%) - Black or African American
Geographical mobility - Moved within same county (%) - Asian
Geographical mobility - Moved within same county (%) - Hispanic or Latino
Geographical mobility - Moved within same county (%) - American Indian and Alaska Native
Geographical mobility - Moved within same county (%) - Multirace
Geographical mobility - Moved within same county (%) - Other Race
Geographical mobility - Moved from different county within same state (%)
Geographical mobility - Moved from different county within same state (%) - White
Geographical mobility - Moved from different county within same state (%) - Black or African American
Geographical mobility - Moved from different county within same state (%) - Asian
Geographical mobility - Moved from different county within same state (%) - Hispanic or Latino
Geographical mobility - Moved from different county within same state (%) - American Indian and Alaska Native
Geographical mobility - Moved from different county within same state (%) - Multirace
Geographical mobility - Moved from different county within same state (%) - Other Race
Geographical mobility - Moved from different state (%)
Geographical mobility - Moved from different state (%) - White
Geographical mobility - Moved from different state (%) - Black or African American
Geographical mobility - Moved from different state (%) - Asian
Geographical mobility - Moved from different state (%) - Hispanic or Latino
Geographical mobility - Moved from different state (%) - American Indian and Alaska Native
Geographical mobility - Moved from different state (%) - Multirace
Geographical mobility - Moved from different state (%) - Other Race
Geographical mobility - Moved from abroad (%)
Geographical mobility - Moved from abroad (%) - White
Geographical mobility - Moved from abroad (%) - Black or African American
Geographical mobility - Moved from abroad (%) - Asian
Geographical mobility - Moved from abroad (%) - Hispanic or Latino
Geographical mobility - Moved from abroad (%) - American Indian and Alaska Native
Geographical mobility - Moved from abroad (%) - Multirace
Geographical mobility - Moved from abroad (%) - Other Race
Place of birth for the foreign-born population - Ireland (%)
Place of birth for the foreign-born population - Denmark (%)
Place of birth for the foreign-born population - Norway (%)
Place of birth for the foreign-born population - Sweden (%)
Place of birth for the foreign-born population - United Kingdom (%)
Place of birth for the foreign-born population - England (%)
Place of birth for the foreign-born population - Scotland (%)
Place of birth for the foreign-born population - Other Northern Europe (%)
Place of birth for the foreign-born population - Austria (%)
Place of birth for the foreign-born population - Belgium (%)
Place of birth for the foreign-born population - France (%)
Place of birth for the foreign-born population - Germany (%)
Place of birth for the foreign-born population - Netherlands (%)
Place of birth for the foreign-born population - Switzerland (%)
Place of birth for the foreign-born population - Other Western Europe (%)
Place of birth for the foreign-born population - Greece (%)
Place of birth for the foreign-born population - Italy (%)
Place of birth for the foreign-born population - Portugal (%)
Place of birth for the foreign-born population - Spain (%)
Place of birth for the foreign-born population - Other Southern Europe (%)
Place of birth for the foreign-born population - Albania (%)
Place of birth for the foreign-born population - Belarus (%)
Place of birth for the foreign-born population - Bosnia and Herzegovina (%)
Place of birth for the foreign-born population - Bulgaria (%)
Place of birth for the foreign-born population - Croatia (%)
Place of birth for the foreign-born population - Czechoslovakia (%)
Place of birth for the foreign-born population - Hungary (%)
Place of birth for the foreign-born population - Latvia (%)
Place of birth for the foreign-born population - Lithuania (%)
Place of birth for the foreign-born population - North Macedonia (Macedonia) (%)
Place of birth for the foreign-born population - Moldova (%)
Place of birth for the foreign-born population - Poland (%)
Place of birth for the foreign-born population - Romania (%)
Place of birth for the foreign-born population - Russia (%)
Place of birth for the foreign-born population - Serbia (%)
Place of birth for the foreign-born population - Ukraine (%)
Place of birth for the foreign-born population - Other Eastern Europe (%)
Place of birth for the foreign-born population - China (%)
Place of birth for the foreign-born population - Hong Kong (%)
Place of birth for the foreign-born population - Taiwan (%)
Place of birth for the foreign-born population - Japan (%)
Place of birth for the foreign-born population - Korea (%)
Place of birth for the foreign-born population - Other Eastern Asia (%)
Place of birth for the foreign-born population - Afghanistan (%)
Place of birth for the foreign-born population - Bangladesh (%)
Place of birth for the foreign-born population - India (%)
Place of birth for the foreign-born population - Iran (%)
Place of birth for the foreign-born population - Kazakhstan (%)
Place of birth for the foreign-born population - Nepal (%)
Place of birth for the foreign-born population - Pakistan (%)
Place of birth for the foreign-born population - Sri Lanka (%)
Place of birth for the foreign-born population - Uzbekistan (%)
Place of birth for the foreign-born population - Other South Central Asia (%)
Place of birth for the foreign-born population - Burma (%)
Place of birth for the foreign-born population - Cambodia (%)
Place of birth for the foreign-born population - Indonesia (%)
Place of birth for the foreign-born population - Laos (%)
Place of birth for the foreign-born population - Malaysia (%)
Place of birth for the foreign-born population - Philippines (%)
Place of birth for the foreign-born population - Singapore (%)
Place of birth for the foreign-born population - Thailand (%)
Place of birth for the foreign-born population - Vietnam (%)
Place of birth for the foreign-born population - Other South Eastern Asia (%)
Place of birth for the foreign-born population - Armenia (%)
Place of birth for the foreign-born population - Iraq (%)
Place of birth for the foreign-born population - Israel (%)
Place of birth for the foreign-born population - Jordan (%)
Place of birth for the foreign-born population - Kuwait (%)
Place of birth for the foreign-born population - Lebanon (%)
Place of birth for the foreign-born population - Saudi Arabia (%)
Place of birth for the foreign-born population - Syria (%)
Place of birth for the foreign-born population - Turkey (%)
Place of birth for the foreign-born population - Yemen (%)
Place of birth for the foreign-born population - Other Western Asia (%)
Place of birth for the foreign-born population - Eritrea (%)
Place of birth for the foreign-born population - Ethiopia (%)
Place of birth for the foreign-born population - Kenya (%)
Place of birth for the foreign-born population - Somalia (%)
Place of birth for the foreign-born population - Uganda (%)
Place of birth for the foreign-born population - Zimbabwe (%)
Place of birth for the foreign-born population - Other Eastern Africa (%)
Place of birth for the foreign-born population - Cameroon (%)
Place of birth for the foreign-born population - Congo (%)
Place of birth for the foreign-born population - Democratic Republic of Congo (Zaire) (%)
Place of birth for the foreign-born population - Other Middle Africa (%)
Place of birth for the foreign-born population - Egypt (%)
Place of birth for the foreign-born population - Morocco (%)
Place of birth for the foreign-born population - Sudan (%)
Place of birth for the foreign-born population - Other Northern Africa (%)
Place of birth for the foreign-born population - South Africa (%)
Place of birth for the foreign-born population - Other Southern Africa (%)
Place of birth for the foreign-born population - Cabo Verde (%)
Place of birth for the foreign-born population - Ghana (%)
Place of birth for the foreign-born population - Liberia (%)
Place of birth for the foreign-born population - Nigeria (%)
Place of birth for the foreign-born population - Senegal (%)
Place of birth for the foreign-born population - Sierra Leone (%)
Place of birth for the foreign-born population - Other Western Africa (%)
Place of birth for the foreign-born population - Australia (%)
Place of birth for the foreign-born population - New Zealand (%)
Place of birth for the foreign-born population - Fiji (%)
Place of birth for the foreign-born population - Micronesia (%)
Place of birth for the foreign-born population - Bahamas (%)
Place of birth for the foreign-born population - Barbados (%)
Place of birth for the foreign-born population - Cuba (%)
Place of birth for the foreign-born population - Dominica (%)
Place of birth for the foreign-born population - Dominican Republic (%)
Place of birth for the foreign-born population - Grenada (%)
Place of birth for the foreign-born population - Haiti (%)
Place of birth for the foreign-born population - Jamaica (%)
Place of birth for the foreign-born population - St. Vincent and the Grenadines (%)
Place of birth for the foreign-born population - Trinidad and Tobago (%)
Place of birth for the foreign-born population - West Indies (%)
Place of birth for the foreign-born population - Other Caribbean (%)
Place of birth for the foreign-born population - Belize (%)
Place of birth for the foreign-born population - Costa Rica (%)
Place of birth for the foreign-born population - El Salvador (%)
Place of birth for the foreign-born population - Guatemala (%)
Place of birth for the foreign-born population - Honduras (%)
Place of birth for the foreign-born population - Mexico (%)
Place of birth for the foreign-born population - Nicaragua (%)
Place of birth for the foreign-born population - Panama (%)
Place of birth for the foreign-born population - Other Central America (%)
Place of birth for the foreign-born population - Argentina (%)
Place of birth for the foreign-born population - Bolivia (%)
Place of birth for the foreign-born population - Brazil (%)
Place of birth for the foreign-born population - Chile (%)
Place of birth for the foreign-born population - Colombia (%)
Place of birth for the foreign-born population - Ecuador (%)
Place of birth for the foreign-born population - Guyana (%)
Place of birth for the foreign-born population - Peru (%)
Place of birth for the foreign-born population - Uruguay (%)
Place of birth for the foreign-born population - Venezuela (%)
Place of birth for the foreign-born population - Other South America (%)
Place of birth for the foreign-born population - Canada (%)
Place of birth for the foreign-born population - Other Northern America (%)
Place of birth for the foreign-born population - Other (%)
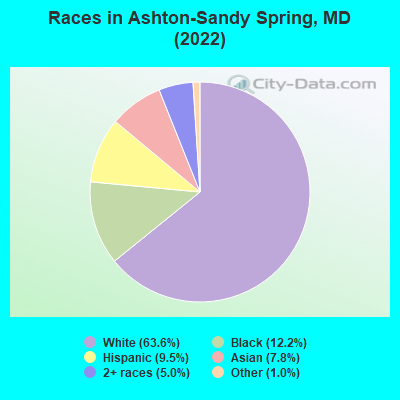
According to 2022 data, the most numerous races in Ashton-Sandy Spring, MD are White alone (3,531 residents), Black alone (675 residents), and Hispanic (527 residents). 80.8% of Ashton-Sandy Spring residents speak English at home. 16.0% of Ashton-Sandy Spring, MD residents are foreign-born (5.5% born in Asia, 5.1% born in Latin America, 3.2% born in Europe), which is about the same as the foreign-born rate of 16.0% across the entire state of Maryland.
Race distribution in Ashton-Sandy Spring
2000 2022
3,286,547 62.1% White alone 1,464,735 27.7% Black alone 227,916 4.3% Hispanic 209,738 4.0% Asian alone 82,946 1.6% Two or more races 13,312 0.3% American Indian alone 9,379 0.2% Other race alone 1,913 0.04% Native Hawaiian and Other
2,906,492 47.1% White alone 1,800,914 29.2% Black alone 705,842 11.4% Hispanic 401,818 6.5% Asian alone 291,317 4.7% Two or more races 46,930 0.8% Other race alone 8,930 0.1% American Indian alone 2,417 0.04% Native Hawaiian and Other
Income and house value in Ashton-Sandy Spring Median household income in 2022 $160,077 White non-Hispanic householders$140,184 Black householdersover $200,000 Asian householdersover $200,000 Two or more races householders$113,800 Hispanic or Latino race householdersMedian 2022 house value $862,134 White Non-Hispanic householders$505,347 Black or African American householders $526,229 Asian householders$410,184 Two or more races householders
Median age by race in Ashton-Sandy Spring
50.3 Median age for White residents50.2 45.3 60.5 Median age for Black or African American residents61.0 60.3 -610,526,315.2 Median age for American Indian / Alaska Native residents-555,555,555.0 -671,704,449.4 45.2 Median age for Asian residents50.3 35.7 -763,333,332.6 Median age for Native Hawaiian / Pacific Islander residents-720,061,021.4 -760,942,760.2 50.9 Median age for Other race residents23.7 62.2 33.8 Median age for Two or more races residents8.1 42.8 49.5 Median age for White alone residents49.8 44.0 41.1 Median age for Hispanic or Latino residents23.7 65.9
Owner/renter occupied households by race in Ashton-Sandy Spring
House owners and renters - White residents 1,037 90.1% Owner occupied113 9.9% Renter occupiedHouse owners and renters - Black or African American residents 294 93.3% Owner occupied21 6.7% Renter occupiedHouse owners and renters - Asian residents 161 100.0% Owner occupiedHouse owners and renters - Other race residents 208 92.2% Owner occupied18 7.8% Renter occupiedHouse owners and renters - Two or more races residents 101 100.0% Owner occupiedHouse owners and renters - White alone residents 1,081 90.1% Owner occupied119 9.9% Renter occupiedHouse owners and renters - Hispanic or Latino residents 181 92.2% Owner occupied15 7.8% Renter occupied
Language usage in Ashton-Sandy Spring
English speakers - Total 80.8% of residents of Ashton-Sandy Spring speak English at home.
7.5% of residents speak Spanish at home 124 30.9% Speak English very well277 69.1% Speak English less than very well10.6% of residents speak other language at home 365 64.5% Speak English very well201 35.5% Speak English less than very well
English speakers - Born in the United States 98.4% of residents of Ashton-Sandy Spring speak English at home.
1.4% of residents speak Spanish at home 21 65.6% Speak English very well11 34.4% Speak English less than very well
English speakers - Native, born elsewhere 72.4% of residents of Ashton-Sandy Spring speak English at home.
20.7% of residents speak Spanish at home 12 100.0% Speak English very well
English speakers - Foreign-born 12.0% of residents of Ashton-Sandy Spring speak English at home.
31.6% of residents speak Spanish at home 14 5.0% Speak English very well266 95.0% Speak English less than very well58.1% of residents speak other language at home 318 61.7% Speak English very well197 38.3% Speak English less than very well
White (Caucasian) - Speak only English Native:
100.0% (3,154)Foreign-born:
35.9% (73)
White (Caucasian) - Speak another language Native:
1.0% (33)Foreign-born:
67.4% (137)
Black or African American - Speak only English Native:
98.7% (620)Foreign-born:
37.0% (15)
Asian - Speak only English Native:
91.2% (179)Foreign-born:
7.8% (17)
Other race - Speak another language Native:
70.3% (92)Foreign-born:
100.0% (319)
Two or more races - Speak another language Native:
33.3% (62)Foreign-born:
99.0% (124)
White alone - Speak only English Native:
99.0% (3,149)Foreign-born:
27.1% (73)
White alone - Speak another language Native:
1.3% (43)Foreign-born:
72.5% (196)
Hispanic or Latino - Speak another language Native:
50.4% (111)Foreign-born:
100.0% (264)
Foreign-born residents in Ashton-Sandy Spring 889 residents are foreign born (5.5% Asia , 5.1% Latin America , 3.2% Europe ).
This city:
16.0%Maryland:
15.7%
Marital status for residents in Ashton-Sandy Spring Marital status - White (Caucasian) population 15 years and over
Males 25.9% Never married60.2% Now married0.0% Separated3.7% Widowed10.2% DivorcedFemales 28.9% Never married57.0% Now married0.0% Separated5.0% Widowed9.1% DivorcedWomen who did not give birth in the past 12 months Now married:
39.3% (280)Unmarried:
60.7% (432)
Marital status - Black or African American population 15 years and over
Males 48.3% Never married47.3% Now married2.5% Separated0.0% Widowed1.8% DivorcedFemales 29.0% Never married47.2% Now married0.0% Separated12.9% Widowed10.8% DivorcedWomen who did not give birth in the past 12 months Now married:
23.0% (17)Unmarried:
77.0% (57)
Marital status - Asian population 15 years and over
Males 33.6% Never married50.9% Now married0.0% Separated0.0% Widowed15.5% DivorcedFemales 0.0% Never married81.6% Now married0.0% Separated18.4% Widowed0.0% DivorcedWomen who gave birth in the past 12 months Now married:
100.0% (20)Unmarried:
0.0% (0)
Women who did not give birth in the past 12 months Now married:
100.0% (68)Unmarried:
0.0% (0)
Marital status - Other race population 15 years and over
Males 100.0% Never married0.0% Now married0.0% Separated0.0% Widowed0.0% DivorcedFemales 17.1% Never married8.6% Now married0.0% Separated8.6% Widowed65.8% DivorcedWomen who did not give birth in the past 12 months Now married:
50.0% (28)Unmarried:
50.0% (28)
Marital status - Two or more races population 15 years and over
Males 0.0% Never married96.6% Now married0.0% Separated0.0% Widowed3.4% DivorcedFemales 16.8% Never married60.7% Now married0.0% Separated0.0% Widowed22.4% DivorcedWomen who gave birth in the past 12 months Now married:
100.0% (23)Unmarried:
0.0% (0)
Women who did not give birth in the past 12 months Now married:
100.0% (37)Unmarried:
0.0% (0)
Marital status - White alone, not Hispanic / Latino population 15 years and over
Males 26.3% Never married59.6% Now married0.0% Separated3.8% Widowed10.3% DivorcedFemales 28.9% Never married57.0% Now married0.0% Separated5.0% Widowed9.1% DivorcedWomen who did not give birth in the past 12 months Now married:
39.3% (306)Unmarried:
60.7% (472)
Marital status - Hispanic or Latino population 15 years and over
Males 81.1% Never married18.9% Now married0.0% Separated0.0% Widowed0.0% DivorcedFemales 16.3% Never married13.1% Now married0.0% Separated8.1% Widowed62.5% DivorcedWomen who gave birth in the past 12 months Now married:
100.0% (13)Unmarried:
0.0% (0)
Women who did not give birth in the past 12 months Now married:
32.4% (11)Unmarried:
67.6% (23)
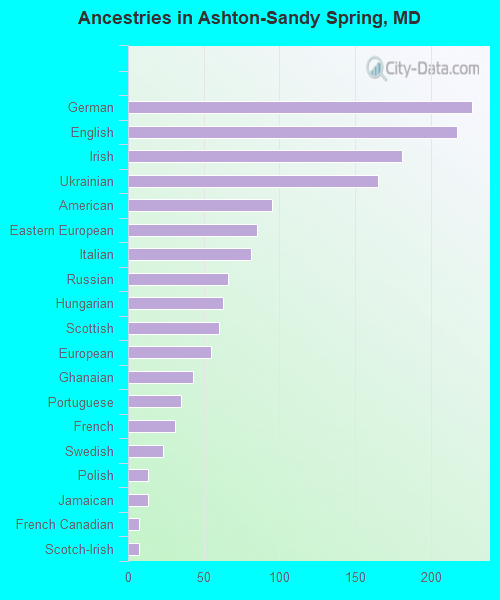
Ancestries in Ashton-Sandy Spring
227 8.1% German217 7.7% English181 6.5% Irish165 5.9% Ukrainian95 3.4% American85 3.0% Eastern European81 2.9% Italian66 2.4% Russian63 2.2% Hungarian60 2.1% Scottish55 2.0% European43 1.5% Ghanaian35 1.2% Portuguese31 1.1% French23 0.8% Swedish13 0.5% Polish13 0.5% Jamaican7 0.2% French Canadian7 0.2% Scotch-Irish2 0.07% British2 0.07% Iranian1 0.04% Ethiopian
Children Nativity (place of birth) in Ashton-Sandy Spring
Children under 6 years - Living with two parents Both parents native 215 100.0% NativeBoth parents foreign-born 38 100.0% NativeChildren under 6 years - Living with one parent Native parent 36 100.0% NativeForeign-born parent 9 100.0% NativeChildren 6 to 17 years - Living with two parents Both parents native 546 100.0% Native0 0.0% Foreign-bornBoth parents foreign-born 111 72.6% Native42 27.4% Foreign-bornChildren 6 to 17 years - Living with one parent Native parent 93 100.0% NativeForeign-born parent 37 49.5% Native38 50.5% Foreign-born
Grandparents responsible for own grandchildren in Ashton-Sandy Spring
Grandparents (30 to 59 years) Black or African American 14 100.0% Not responsible for grandchildren
Grandparents (60 years and over) Black or African American 17 100.0% Not responsible for grandchildren