Races in Apex, North Carolina (NC) Detailed Stats
Data:
Races - White alone (%)
Races - White alone (% change since 2000)
Races - Black alone (%)
Races - Black alone (% change since 2000)
Races - American Indian alone (%)
Races - American Indian alone (% change since 2000)
Races - Asian alone (%)
Races - Asian alone (% change since 2000)
Races - Hispanic (%)
Races - Hispanic (% change since 2000)
Races - Native Hawaiian and Other Pacific Islander alone (%)
Races - Native Hawaiian and Other Pacific Islander alone (% change since 2000)
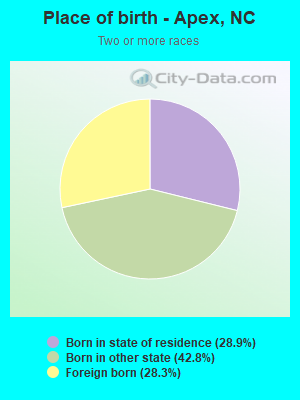
Races - Two or more races(%)
Races - Two or more races(% change since 2000)
Races - Other race alone (%)
Races - Other race alone (% change since 2000)
Racial diversity
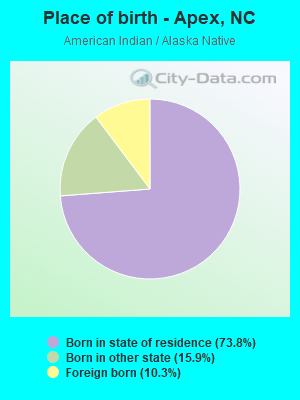
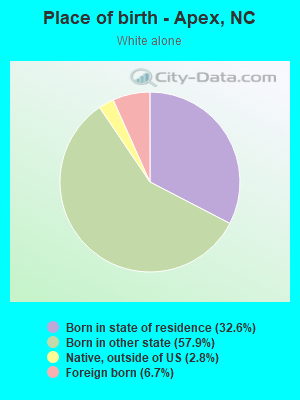
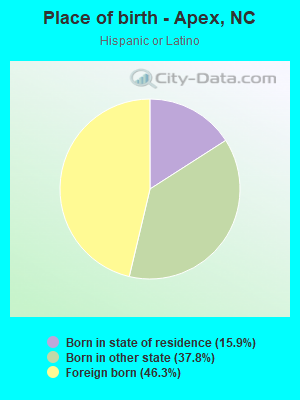
Place of birth - Born in state of residence (%)
Place of birth - Born in state of residence (%) - White
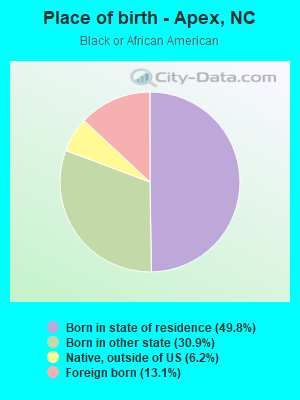
Place of birth - Born in state of residence (%) - Black or African American
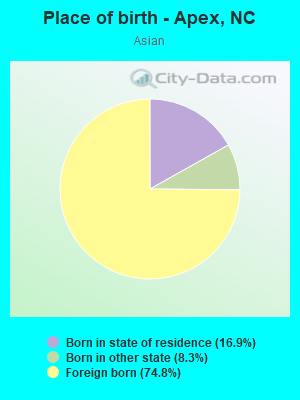
Place of birth - Born in state of residence (%) - Asian
Place of birth - Born in state of residence (%) - Hispanic or Latino
Place of birth - Born in state of residence (%) - American Indian and Alaska Native
Place of birth - Born in state of residence (%) - Multirace
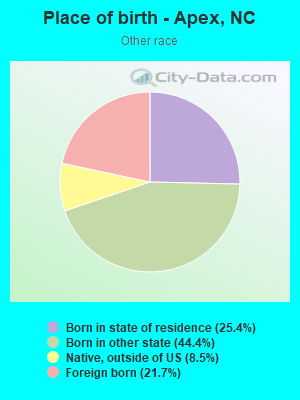
Place of birth - Born in state of residence (%) - Other Race
Place of birth - Born in other state (%)
Place of birth - Born in other state (%) - White
Place of birth - Born in other state (%) - Black or African American
Place of birth - Born in other state (%) - Asian
Place of birth - Born in other state (%) - Hispanic or Latino
Place of birth - Born in other state (%) - American Indian and Alaska Native
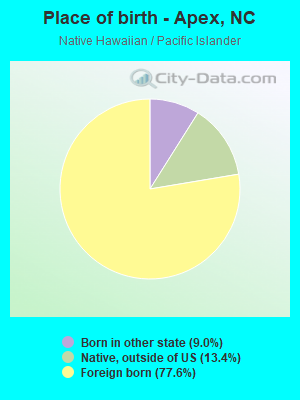
Place of birth - Born in other state (%) - Multirace
Place of birth - Born in other state (%) - Other Race
Place of birth - Native, outside of US (%)
Place of birth - Native, outside of US (%) - White
Place of birth - Native, outside of US (%) - Black or African American
Place of birth - Native, outside of US (%) - Asian
Place of birth - Native, outside of US (%) - Hispanic or Latino
Place of birth - Native, outside of US (%) - American Indian and Alaska Native
Place of birth - Native, outside of US (%) - Multirace
Place of birth - Native, outside of US (%) - Other Race
Place of birth - Foreign born (%)
Place of birth - Foreign born (%) - White
Place of birth - Foreign born (%) - Black or African American
Place of birth - Foreign born (%) - Asian
Place of birth - Foreign born (%) - Hispanic or Latino
Place of birth - Foreign born (%) - American Indian and Alaska Native
Place of birth - Foreign born (%) - Multirace
Place of birth - Foreign born (%) - Other Race
Residents speaking English at home (%)
Residents speaking English at home - Born in the United States (%)
Residents speaking English at home - Native, born elsewhere (%)
Residents speaking English at home - Foreign born (%)
Residents speaking Spanish at home (%)
Residents speaking Spanish at home - Born in the United States (%)
Residents speaking Spanish at home - Native, born elsewhere (%)
Residents speaking Spanish at home - Foreign born (%)
Residents speaking other language at home (%)
Residents speaking other language at home - Born in the United States (%)
Residents speaking other language at home - Native, born elsewhere (%)
Residents speaking other language at home - Foreign born (%)
Marital status - Never married (%)
Marital status - Now married (%)
Marital status - Separated (%)
Marital status - Widowed (%)
Marital status - Divorced (%)
Ancestries Reported - Arab (%)
Ancestries Reported - Czech (%)
Ancestries Reported - Danish (%)
Ancestries Reported - Dutch (%)
Ancestries Reported - English (%)
Ancestries Reported - French (%)
Ancestries Reported - French Canadian (%)
Ancestries Reported - German (%)
Ancestries Reported - Greek (%)
Ancestries Reported - Hungarian (%)
Ancestries Reported - Irish (%)
Ancestries Reported - Italian (%)
Ancestries Reported - Lithuanian (%)
Ancestries Reported - Norwegian (%)
Ancestries Reported - Polish (%)
Ancestries Reported - Portuguese (%)
Ancestries Reported - Russian (%)
Ancestries Reported - Scotch-Irish (%)
Ancestries Reported - Scottish (%)
Ancestries Reported - Slovak (%)
Ancestries Reported - Subsaharan African (%)
Ancestries Reported - Swedish (%)
Ancestries Reported - Swiss (%)
Ancestries Reported - Ukrainian (%)
Ancestries Reported - United States (%)
Ancestries Reported - Welsh (%)
Ancestries Reported - West Indian (%)
Ancestries Reported - Other (%)
Geographical mobility - Same house 1 year ago (%)
Geographical mobility - Same house 1 year ago (%) - White
Geographical mobility - Same house 1 year ago (%) - Black or African American
Geographical mobility - Same house 1 year ago (%) - Asian
Geographical mobility - Same house 1 year ago (%) - Hispanic or Latino
Geographical mobility - Same house 1 year ago (%) - American Indian and Alaska Native
Geographical mobility - Same house 1 year ago (%) - Multirace
Geographical mobility - Same house 1 year ago (%) - Other Race
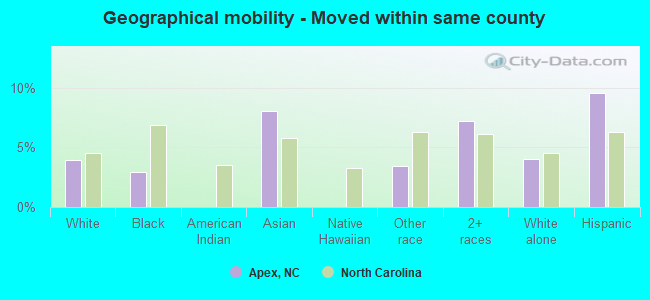
Geographical mobility - Moved within same county (%)
Geographical mobility - Moved within same county (%) - White
Geographical mobility - Moved within same county (%) - Black or African American
Geographical mobility - Moved within same county (%) - Asian
Geographical mobility - Moved within same county (%) - Hispanic or Latino
Geographical mobility - Moved within same county (%) - American Indian and Alaska Native
Geographical mobility - Moved within same county (%) - Multirace
Geographical mobility - Moved within same county (%) - Other Race
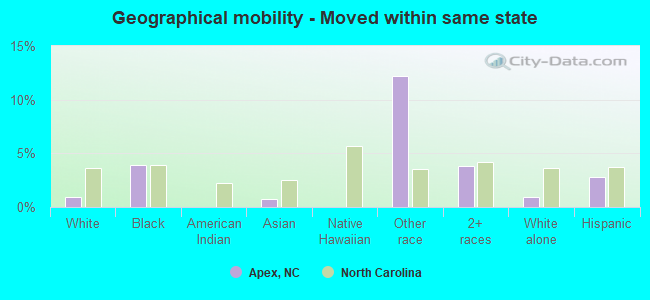
Geographical mobility - Moved from different county within same state (%)
Geographical mobility - Moved from different county within same state (%) - White
Geographical mobility - Moved from different county within same state (%) - Black or African American
Geographical mobility - Moved from different county within same state (%) - Asian
Geographical mobility - Moved from different county within same state (%) - Hispanic or Latino
Geographical mobility - Moved from different county within same state (%) - American Indian and Alaska Native
Geographical mobility - Moved from different county within same state (%) - Multirace
Geographical mobility - Moved from different county within same state (%) - Other Race
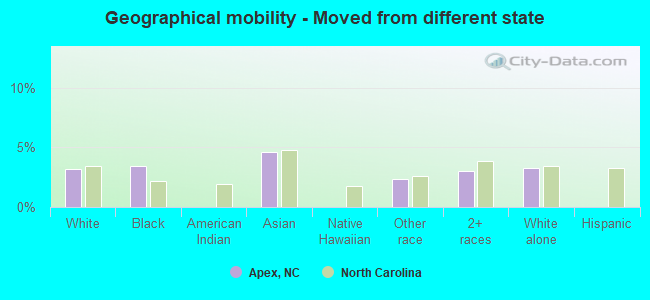
Geographical mobility - Moved from different state (%)
Geographical mobility - Moved from different state (%) - White
Geographical mobility - Moved from different state (%) - Black or African American
Geographical mobility - Moved from different state (%) - Asian
Geographical mobility - Moved from different state (%) - Hispanic or Latino
Geographical mobility - Moved from different state (%) - American Indian and Alaska Native
Geographical mobility - Moved from different state (%) - Multirace
Geographical mobility - Moved from different state (%) - Other Race
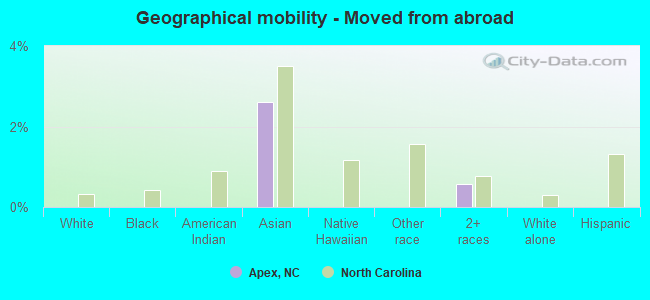
Geographical mobility - Moved from abroad (%)
Geographical mobility - Moved from abroad (%) - White
Geographical mobility - Moved from abroad (%) - Black or African American
Geographical mobility - Moved from abroad (%) - Asian
Geographical mobility - Moved from abroad (%) - Hispanic or Latino
Geographical mobility - Moved from abroad (%) - American Indian and Alaska Native
Geographical mobility - Moved from abroad (%) - Multirace
Geographical mobility - Moved from abroad (%) - Other Race
Place of birth for the foreign-born population - Ireland (%)
Place of birth for the foreign-born population - Denmark (%)
Place of birth for the foreign-born population - Norway (%)
Place of birth for the foreign-born population - Sweden (%)
Place of birth for the foreign-born population - United Kingdom (%)
Place of birth for the foreign-born population - England (%)
Place of birth for the foreign-born population - Scotland (%)
Place of birth for the foreign-born population - Other Northern Europe (%)
Place of birth for the foreign-born population - Austria (%)
Place of birth for the foreign-born population - Belgium (%)
Place of birth for the foreign-born population - France (%)
Place of birth for the foreign-born population - Germany (%)
Place of birth for the foreign-born population - Netherlands (%)
Place of birth for the foreign-born population - Switzerland (%)
Place of birth for the foreign-born population - Other Western Europe (%)
Place of birth for the foreign-born population - Greece (%)
Place of birth for the foreign-born population - Italy (%)
Place of birth for the foreign-born population - Portugal (%)
Place of birth for the foreign-born population - Spain (%)
Place of birth for the foreign-born population - Other Southern Europe (%)
Place of birth for the foreign-born population - Albania (%)
Place of birth for the foreign-born population - Belarus (%)
Place of birth for the foreign-born population - Bosnia and Herzegovina (%)
Place of birth for the foreign-born population - Bulgaria (%)
Place of birth for the foreign-born population - Croatia (%)
Place of birth for the foreign-born population - Czechoslovakia (%)
Place of birth for the foreign-born population - Hungary (%)
Place of birth for the foreign-born population - Latvia (%)
Place of birth for the foreign-born population - Lithuania (%)
Place of birth for the foreign-born population - North Macedonia (Macedonia) (%)
Place of birth for the foreign-born population - Moldova (%)
Place of birth for the foreign-born population - Poland (%)
Place of birth for the foreign-born population - Romania (%)
Place of birth for the foreign-born population - Russia (%)
Place of birth for the foreign-born population - Serbia (%)
Place of birth for the foreign-born population - Ukraine (%)
Place of birth for the foreign-born population - Other Eastern Europe (%)
Place of birth for the foreign-born population - China (%)
Place of birth for the foreign-born population - Hong Kong (%)
Place of birth for the foreign-born population - Taiwan (%)
Place of birth for the foreign-born population - Japan (%)
Place of birth for the foreign-born population - Korea (%)
Place of birth for the foreign-born population - Other Eastern Asia (%)
Place of birth for the foreign-born population - Afghanistan (%)
Place of birth for the foreign-born population - Bangladesh (%)
Place of birth for the foreign-born population - India (%)
Place of birth for the foreign-born population - Iran (%)
Place of birth for the foreign-born population - Kazakhstan (%)
Place of birth for the foreign-born population - Nepal (%)
Place of birth for the foreign-born population - Pakistan (%)
Place of birth for the foreign-born population - Sri Lanka (%)
Place of birth for the foreign-born population - Uzbekistan (%)
Place of birth for the foreign-born population - Other South Central Asia (%)
Place of birth for the foreign-born population - Burma (%)
Place of birth for the foreign-born population - Cambodia (%)
Place of birth for the foreign-born population - Indonesia (%)
Place of birth for the foreign-born population - Laos (%)
Place of birth for the foreign-born population - Malaysia (%)
Place of birth for the foreign-born population - Philippines (%)
Place of birth for the foreign-born population - Singapore (%)
Place of birth for the foreign-born population - Thailand (%)
Place of birth for the foreign-born population - Vietnam (%)
Place of birth for the foreign-born population - Other South Eastern Asia (%)
Place of birth for the foreign-born population - Armenia (%)
Place of birth for the foreign-born population - Iraq (%)
Place of birth for the foreign-born population - Israel (%)
Place of birth for the foreign-born population - Jordan (%)
Place of birth for the foreign-born population - Kuwait (%)
Place of birth for the foreign-born population - Lebanon (%)
Place of birth for the foreign-born population - Saudi Arabia (%)
Place of birth for the foreign-born population - Syria (%)
Place of birth for the foreign-born population - Turkey (%)
Place of birth for the foreign-born population - Yemen (%)
Place of birth for the foreign-born population - Other Western Asia (%)
Place of birth for the foreign-born population - Eritrea (%)
Place of birth for the foreign-born population - Ethiopia (%)
Place of birth for the foreign-born population - Kenya (%)
Place of birth for the foreign-born population - Somalia (%)
Place of birth for the foreign-born population - Uganda (%)
Place of birth for the foreign-born population - Zimbabwe (%)
Place of birth for the foreign-born population - Other Eastern Africa (%)
Place of birth for the foreign-born population - Cameroon (%)
Place of birth for the foreign-born population - Congo (%)
Place of birth for the foreign-born population - Democratic Republic of Congo (Zaire) (%)
Place of birth for the foreign-born population - Other Middle Africa (%)
Place of birth for the foreign-born population - Egypt (%)
Place of birth for the foreign-born population - Morocco (%)
Place of birth for the foreign-born population - Sudan (%)
Place of birth for the foreign-born population - Other Northern Africa (%)
Place of birth for the foreign-born population - South Africa (%)
Place of birth for the foreign-born population - Other Southern Africa (%)
Place of birth for the foreign-born population - Cabo Verde (%)
Place of birth for the foreign-born population - Ghana (%)
Place of birth for the foreign-born population - Liberia (%)
Place of birth for the foreign-born population - Nigeria (%)
Place of birth for the foreign-born population - Senegal (%)
Place of birth for the foreign-born population - Sierra Leone (%)
Place of birth for the foreign-born population - Other Western Africa (%)
Place of birth for the foreign-born population - Australia (%)
Place of birth for the foreign-born population - New Zealand (%)
Place of birth for the foreign-born population - Fiji (%)
Place of birth for the foreign-born population - Micronesia (%)
Place of birth for the foreign-born population - Bahamas (%)
Place of birth for the foreign-born population - Barbados (%)
Place of birth for the foreign-born population - Cuba (%)
Place of birth for the foreign-born population - Dominica (%)
Place of birth for the foreign-born population - Dominican Republic (%)
Place of birth for the foreign-born population - Grenada (%)
Place of birth for the foreign-born population - Haiti (%)
Place of birth for the foreign-born population - Jamaica (%)
Place of birth for the foreign-born population - St. Vincent and the Grenadines (%)
Place of birth for the foreign-born population - Trinidad and Tobago (%)
Place of birth for the foreign-born population - West Indies (%)
Place of birth for the foreign-born population - Other Caribbean (%)
Place of birth for the foreign-born population - Belize (%)
Place of birth for the foreign-born population - Costa Rica (%)
Place of birth for the foreign-born population - El Salvador (%)
Place of birth for the foreign-born population - Guatemala (%)
Place of birth for the foreign-born population - Honduras (%)
Place of birth for the foreign-born population - Mexico (%)
Place of birth for the foreign-born population - Nicaragua (%)
Place of birth for the foreign-born population - Panama (%)
Place of birth for the foreign-born population - Other Central America (%)
Place of birth for the foreign-born population - Argentina (%)
Place of birth for the foreign-born population - Bolivia (%)
Place of birth for the foreign-born population - Brazil (%)
Place of birth for the foreign-born population - Chile (%)
Place of birth for the foreign-born population - Colombia (%)
Place of birth for the foreign-born population - Ecuador (%)
Place of birth for the foreign-born population - Guyana (%)
Place of birth for the foreign-born population - Peru (%)
Place of birth for the foreign-born population - Uruguay (%)
Place of birth for the foreign-born population - Venezuela (%)
Place of birth for the foreign-born population - Other South America (%)
Place of birth for the foreign-born population - Canada (%)
Place of birth for the foreign-born population - Other Northern America (%)
Place of birth for the foreign-born population - Other (%)
Latest news about races in Apex, NC collected exclusively by city-data.com from local newspapers, TV, and radio stations
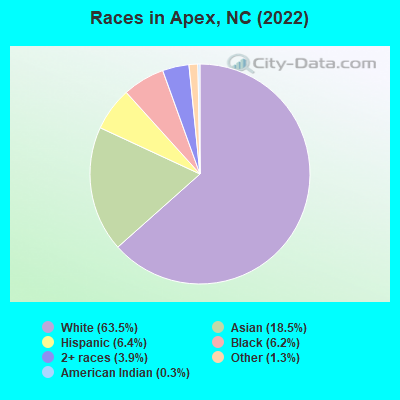
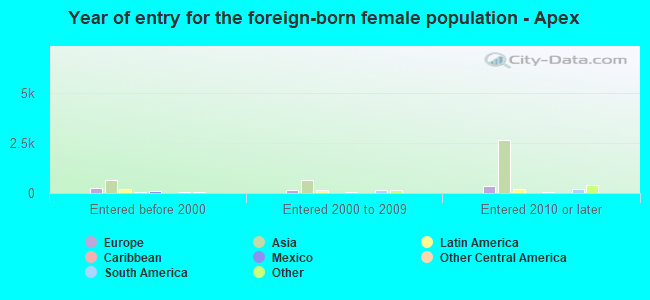
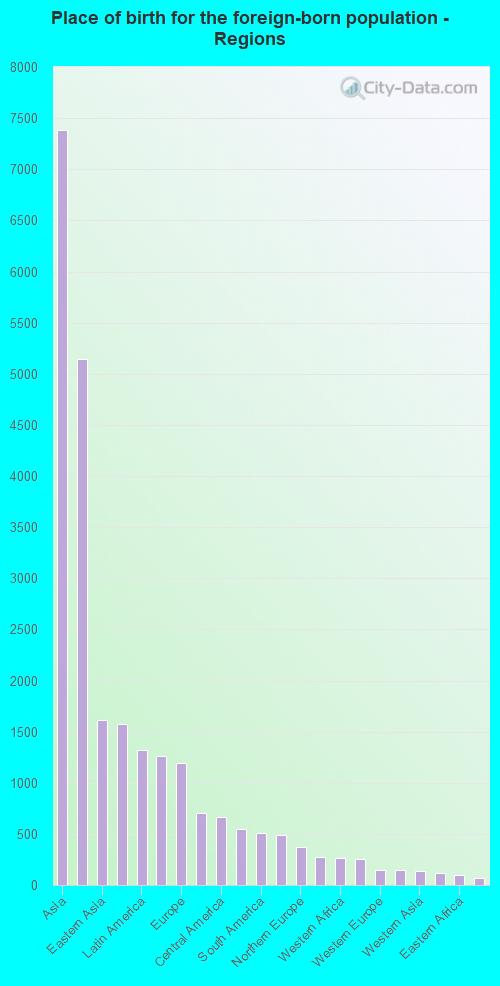
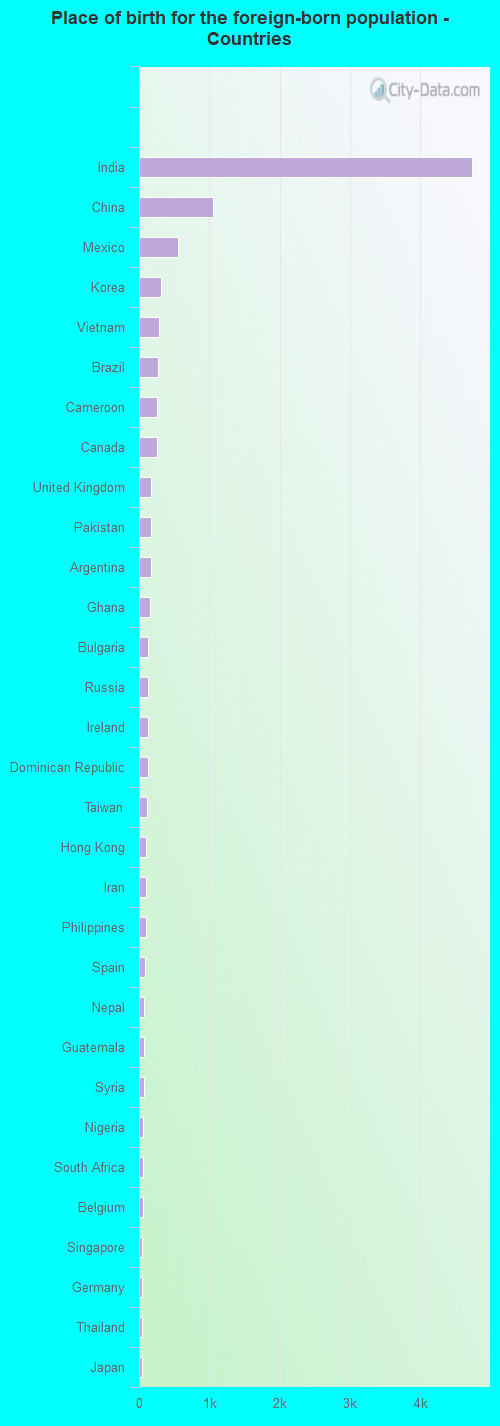
According to 2022 data, the most numerous races in Apex, NC are White alone (45,114 residents), Black alone (4,389 residents), and Hispanic (4,572 residents). 73.6% of Apex residents speak English at home. 16.0% of Apex, NC residents are foreign-born (10.7% born in Asia, 1.9% born in Latin America, 1.7% born in Europe), which is 50.1% greater than the foreign-born rate of 8.0% across the entire state of North Carolina.
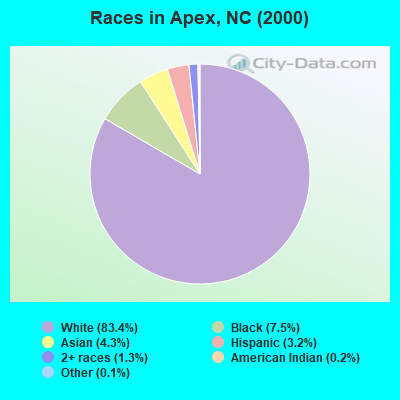
Race distribution in Apex
2000 2022
5,647,155 70.2% White alone 1,723,301 21.4% Black alone 378,963 4.7% Hispanic 112,416 1.4% Asian alone 95,333 1.2% American Indian alone 79,965 1.0% Two or more races 9,015 0.1% Other race alone 3,165 0.04% Native Hawaiian and Other
6,497,519 60.7% White alone 2,155,650 20.1% Black alone 1,114,799 10.4% Hispanic 438,061 4.1% Two or more races 341,052 3.2% Asian alone 91,758 0.9% American Indian alone 50,180 0.5% Other race alone 9,954 0.09% Native Hawaiian and Other
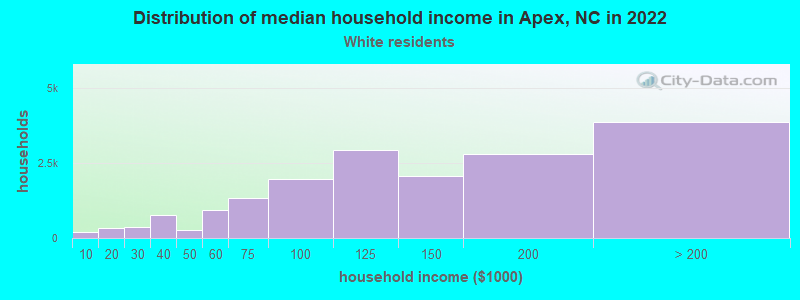
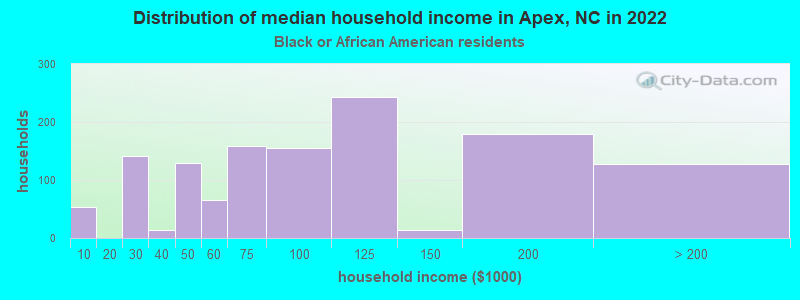
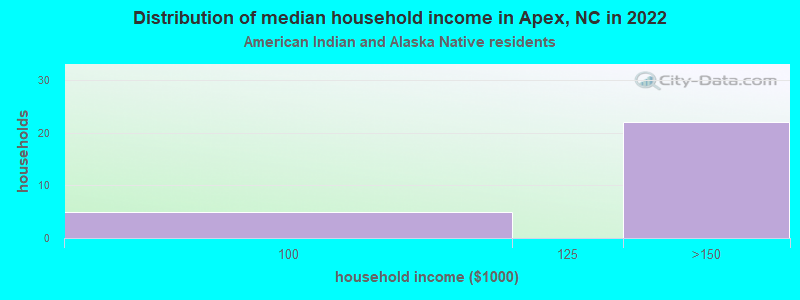
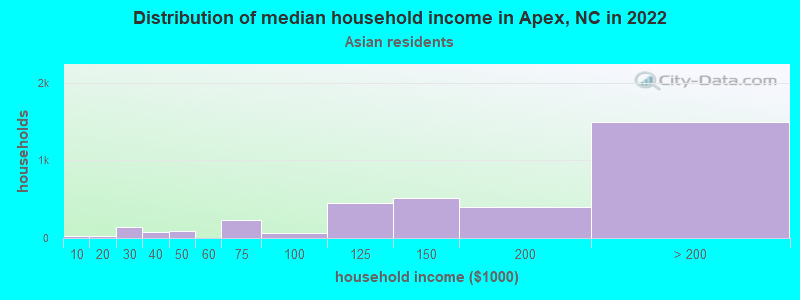
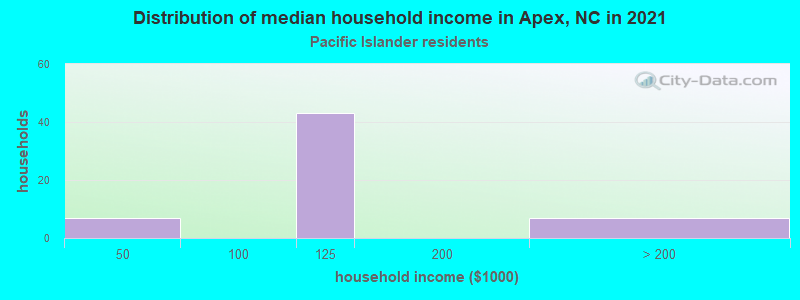
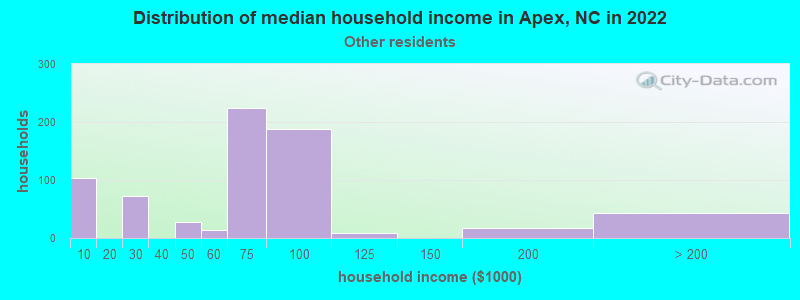
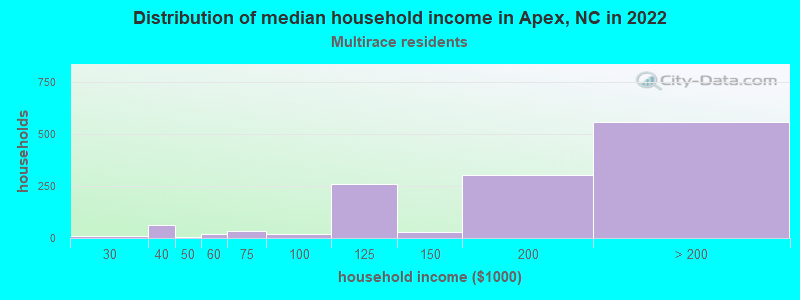
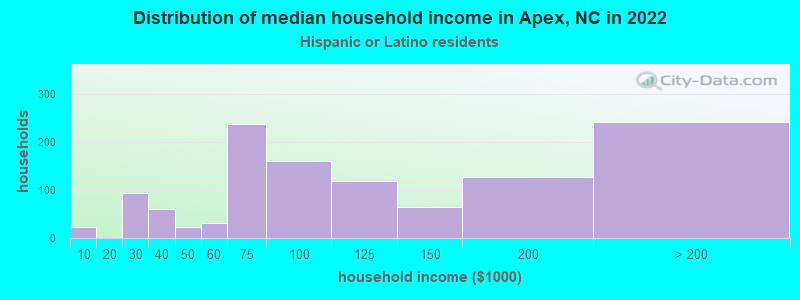
Income and house value in Apex Median household income in 2022 $119,152 White non-Hispanic householders$123,141 Black householdersover $200,000 Asian householders$74,365 Some other race householders$158,879 Two or more races householders$144,900 Hispanic or Latino race householdersMedian 2022 house value $570,763 White Non-Hispanic householders$521,131 Black or African American householders$516,995 American Indian or Alaska Native householders $610,531 Asian householders$443,184 Some other race householders$539,584 Two or more races householders$564,081 Hispanic or Latino householders
Median age by race in Apex
39.9 Median age for White residents40.0 39.8 29.9 Median age for Black or African American residents20.3 43.4 46.2 Median age for American Indian / Alaska Native residents-666,666,666.0 46.2 39.0 Median age for Asian residents39.7 38.2 -666,666,666.0 Median age for Native Hawaiian / Pacific Islander residents-666,666,666.0 -666,666,666.0 55.6 Median age for Other race residents62.2 39.8 17.5 Median age for Two or more races residents25.6 14.6 39.9 Median age for White alone residents40.1 39.8 33.5 Median age for Hispanic or Latino residents33.2 37.2
Owner/renter occupied households by race in Apex
House owners and renters - White residents 13,385 74.8% Owner occupied4,503 25.2% Renter occupiedHouse owners and renters - Black or African American residents 841 82.5% Owner occupied178 17.5% Renter occupiedHouse owners and renters - American Indian / Alaska Native residents 16 100.0% Owner occupiedHouse owners and renters - Asian residents 4,113 95.2% Owner occupied207 4.8% Renter occupiedHouse owners and renters - Native Hawaiian / Pacific Islander residents 114 100.0% Owner occupiedHouse owners and renters - Other race residents 444 64.2% Owner occupied247 35.8% Renter occupiedHouse owners and renters - Two or more races residents 1,058 87.5% Owner occupied151 12.5% Renter occupiedHouse owners and renters - White alone residents 13,162 74.7% Owner occupied4,454 25.3% Renter occupiedHouse owners and renters - Hispanic or Latino residents 903 85.5% Owner occupied153 14.5% Renter occupied
Language usage in Apex
English speakers - Total 73.6% of residents of Apex speak English at home.
4.7% of residents speak Spanish at home 2,206 68.0% Speak English very well1,036 32.0% Speak English less than very well21.6% of residents speak other language at home 11,070 74.5% Speak English very well3,785 25.5% Speak English less than very well
English speakers - Born in the United States 92.8% of residents of Apex speak English at home.
2.9% of residents speak Spanish at home 804 90.0% Speak English very well89 10.0% Speak English less than very well4.3% of residents speak other language at home 1,349 100.0% Speak English very well
All residents speak only English at home
English speakers - Foreign-born 11.8% of residents of Apex speak English at home.
12.9% of residents speak Spanish at home 1,120 54.2% Speak English very well947 45.8% Speak English less than very well75.3% of residents speak other language at home 8,430 69.7% Speak English very well3,664 30.3% Speak English less than very well
White (Caucasian) - Speak only English Native:
97.6% (40,400)Foreign-born:
30.4% (992)
White (Caucasian) - Speak another language Native:
2.4% (1,003)Foreign-born:
69.6% (2,269)
Black or African American - Speak only English Native:
90.8% (3,578)Foreign-born:
14.2% (98)
Black or African American - Speak another language Native:
10.2% (402)Foreign-born:
89.9% (621)
Asian - Speak only English Native:
47.9% (1,248)Foreign-born:
9.2% (899)
Asian - Speak another language Native:
52.1% (1,360)Foreign-born:
90.8% (8,877)
Native Hawaiian / Pacific Islander - Speak another language Native:
58.0% (15)Foreign-born:
71.9% (72)
Other race - Speak only English Native:
61.2% (637)Foreign-born:
10.7% (32)
Other race - Speak another language Native:
43.1% (449)Foreign-born:
89.4% (266)
Two or more races - Speak only English Native:
83.1% (3,688)Foreign-born:
1.5% (12)
Two or more races - Speak another language Native:
17.0% (753)Foreign-born:
100.0% (826)
White alone - Speak only English Native:
98.0% (40,172)Foreign-born:
31.2% (943)
White alone - Speak another language Native:
2.0% (840)Foreign-born:
68.8% (2,077)
Hispanic or Latino - Speak only English Native:
53.4% (1,073)Foreign-born:
2.3% (49)
Hispanic or Latino - Speak another language Native:
46.6% (937)Foreign-born:
97.7% (2,067)
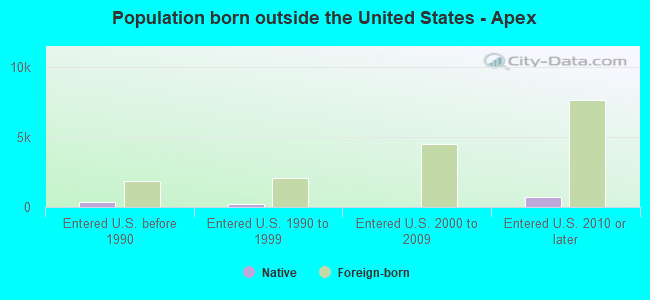
Foreign-born residents in Apex 10,916 residents are foreign born (10.7% Asia , 1.9% Latin America , 1.7% Europe ).
This city:
16.0%North Carolina:
8.3%
Marital status for residents in Apex Marital status - White (Caucasian) population 15 years and over
Males 27.5% Never married64.2% Now married2.6% Separated0.8% Widowed4.9% DivorcedFemales 24.9% Never married52.0% Now married1.3% Separated4.7% Widowed17.1% DivorcedWomen who gave birth in the past 12 months Now married:
100.0% (371)Unmarried:
0.0% (0)
Women who did not give birth in the past 12 months Now married:
46.5% (5,388)Unmarried:
53.5% (6,197)
Marital status - Black or African American population 15 years and over
Males 39.8% Never married52.3% Now married1.7% Separated4.2% Widowed2.0% DivorcedFemales 36.0% Never married39.2% Now married2.3% Separated5.7% Widowed16.8% DivorcedWomen who gave birth in the past 12 months Now married:
100.0% (203)Unmarried:
0.0% (0)
Women who did not give birth in the past 12 months Now married:
24.0% (293)Unmarried:
76.0% (925)
Marital status - American Indian / Alaska Native population 15 years and over
Males 40.0% Never married60.0% Now married0.0% Separated0.0% Widowed0.0% DivorcedFemales 31.2% Never married48.1% Now married0.0% Separated0.0% Widowed20.8% DivorcedWomen who did not give birth in the past 12 months Now married:
57.1% (34)Unmarried:
42.9% (25)
Marital status - Asian population 15 years and over
Males 14.8% Never married84.2% Now married0.0% Separated0.7% Widowed0.3% DivorcedFemales 10.5% Never married81.6% Now married0.4% Separated3.2% Widowed4.3% DivorcedWomen who gave birth in the past 12 months Now married:
100.0% (264)Unmarried:
0.0% (0)
Women who did not give birth in the past 12 months Now married:
84.5% (3,339)Unmarried:
15.5% (613)
Marital status - Native Hawaiian / Pacific Islander population 15 years and over
Males 0.0% Never married0.0% Now married0.0% Separated0.0% Widowed100.0% DivorcedFemales 0.0% Never married100.0% Now married0.0% Separated0.0% Widowed0.0% DivorcedWomen who did not give birth in the past 12 months Now married:
100.0% (67)Unmarried:
0.0% (0)
Marital status - Other race population 15 years and over
Males 28.2% Never married50.8% Now married0.0% Separated0.0% Widowed21.0% DivorcedFemales 20.7% Never married65.7% Now married0.0% Separated0.0% Widowed13.7% DivorcedWomen who gave birth in the past 12 months Now married:
100.0% (37)Unmarried:
0.0% (0)
Women who did not give birth in the past 12 months Now married:
62.0% (290)Unmarried:
38.0% (177)
Marital status - Two or more races population 15 years and over
Males 51.2% Never married44.0% Now married2.9% Separated0.0% Widowed1.9% DivorcedFemales 40.3% Never married52.4% Now married0.0% Separated0.0% Widowed7.3% DivorcedWomen who did not give birth in the past 12 months Now married:
47.3% (536)Unmarried:
52.7% (596)
Marital status - White alone, not Hispanic / Latino population 15 years and over
Males 27.5% Never married64.1% Now married2.7% Separated0.8% Widowed5.0% DivorcedFemales 25.2% Never married51.4% Now married1.3% Separated4.8% Widowed17.3% DivorcedWomen who gave birth in the past 12 months Now married:
100.0% (371)Unmarried:
0.0% (0)
Women who did not give birth in the past 12 months Now married:
45.6% (5,196)Unmarried:
54.4% (6,197)
Marital status - Hispanic or Latino population 15 years and over
Males 29.4% Never married57.5% Now married3.3% Separated0.0% Widowed9.9% DivorcedFemales 32.9% Never married59.0% Now married0.0% Separated0.7% Widowed7.4% DivorcedWomen who gave birth in the past 12 months Now married:
100.0% (44)Unmarried:
0.0% (0)
Women who did not give birth in the past 12 months Now married:
58.4% (608)Unmarried:
41.6% (433)
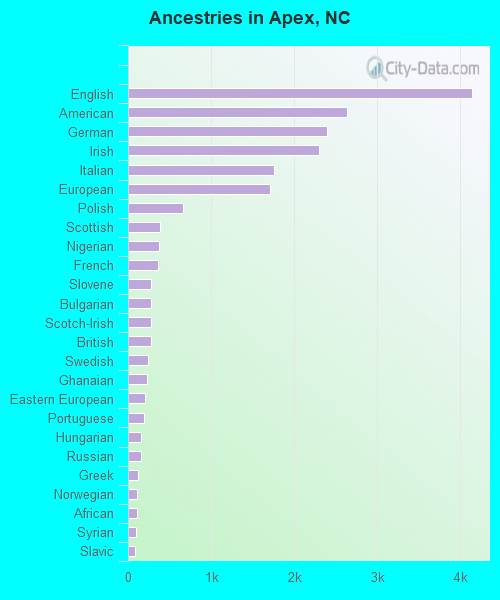
Ancestries in Apex
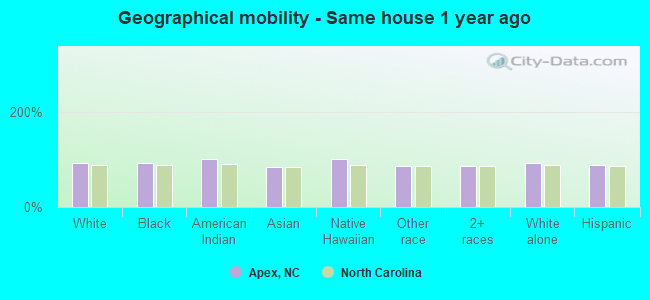
4,137 11.7% English2,637 7.4% American2,398 6.8% German2,300 6.5% Irish1,752 4.9% Italian1,714 4.8% European665 1.9% Polish387 1.1% Scottish373 1.1% Nigerian367 1.0% French281 0.8% Slovene278 0.8% Bulgarian277 0.8% Scotch-Irish273 0.8% British237 0.7% Swedish232 0.7% Ghanaian202 0.6% Eastern European196 0.6% Portuguese161 0.5% Hungarian157 0.4% Russian119 0.3% Greek113 0.3% Norwegian107 0.3% African95 0.3% Syrian85 0.2% Slavic84 0.2% Estonian83 0.2% Turkish76 0.2% Dutch75 0.2% Scandinavian62 0.2% Iranian58 0.2% Albanian55 0.2% Ethiopian48 0.1% Swiss45 0.1% Slovak37 0.1% Austrian35 0.10% Croatian34 0.10% Danish29 0.08% Romanian27 0.08% Finnish26 0.07% Palestinian25 0.07% Lebanese21 0.06% Welsh16 0.05% Northern European15 0.04% Brazilian14 0.04% Lithuanian14 0.04% Belgian14 0.04% South African11 0.03% Ukrainian9 0.03% Czech7 0.02% French Canadian7 0.02% Jamaican6 0.02% Kenyan4 0.01% Maltese
Geographical mobility in Apex Same house 1 year ago 41,855 91.9% White (Caucasian)4,602 91.9% Black or African American121 100.0% American Indian / Alaska Native8,978 83.3% Asian124 100.0% Native Hawaiian / Pacific Islander1,117 85.8% Other race4,915 84.8% Two or more races41,080 91.8% White alone, not Hispanic / Latino3,869 87.1% Hispanic or LatinoMoved within same county 1,786 3.9% White / Caucasian149 3.0% Black or African American865 8.0% Asian45 3.5% Other race417 7.2% Two or more races1,786 4.0% White alone, not Hispanic / Latino426 9.6% Hispanic or LatinoMoved within same state 430 0.9% White / Caucasian197 3.9% Black or African American79 0.7% Asian159 12.2% Other race220 3.8% Two or more races430 1.0% White alone, not Hispanic / Latino124 2.8% Hispanic or LatinoMoved from different state 1,469 3.2% White / Caucasian171 3.4% Black or African American498 4.6% Asian30 2.3% Other race173 3.0% Two or more races1,469 3.3% White alone, not Hispanic / LatinoMoved from abroad 280 2.6% Asian33 0.6% Two or more races
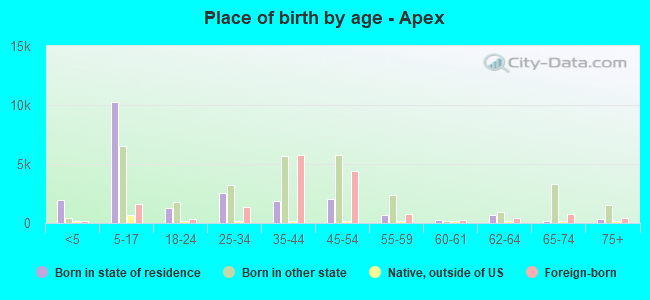
Children Nativity (place of birth) in Apex
Children under 6 years - Living with two parents Both parents native 1,575 100.0% NativeBoth parents foreign-born 1,219 91.4% Native115 8.6% Foreign-bornOne native, one foreign-born parent 582 100.0% NativeChildren under 6 years - Living with one parent Native parent 851 100.0% NativeChildren 6 to 17 years - Living with two parents Both parents native 8,612 100.0% NativeBoth parents foreign-born 2,138 59.6% Native1,448 40.4% Foreign-bornOne native, one foreign-born parent 2,316 100.0% NativeChildren 6 to 17 years - Living with one parent Native parent 1,382 100.0% NativeForeign-born parent 517 56.5% Native398 43.5% Foreign-born
Grandparents responsible for own grandchildren in Apex
Grandparents (30 to 59 years) White / Caucasian 12 100.0% Not responsible for grandchildrenAmerican Indian / Alaska Native 27 100.0% Not responsible for grandchildrenAsian 23 16.1% Responsible for grandchildren122 83.9% Not responsible for grandchildrenWhite alone, not Hispanic / Latino 12 100.0% Not responsible for grandchildren
Grandparents (60 years and over) White / Caucasian 161 100.0% Not responsible for grandchildrenAsian 454 100.0% Not responsible for grandchildrenWhite alone, not Hispanic / Latino 174 100.0% Not responsible for grandchildren