Races in Angleton, Texas (TX) Detailed Stats
Data:
Races - White alone (%)
Races - White alone (% change since 2000)
Races - Black alone (%)
Races - Black alone (% change since 2000)
Races - American Indian alone (%)
Races - American Indian alone (% change since 2000)
Races - Asian alone (%)
Races - Asian alone (% change since 2000)
Races - Hispanic (%)
Races - Hispanic (% change since 2000)
Races - Native Hawaiian and Other Pacific Islander alone (%)
Races - Native Hawaiian and Other Pacific Islander alone (% change since 2000)
Races - Two or more races(%)
Races - Two or more races(% change since 2000)
Races - Other race alone (%)
Races - Other race alone (% change since 2000)
Racial diversity
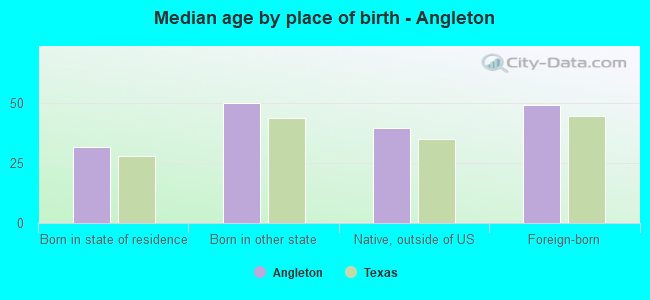
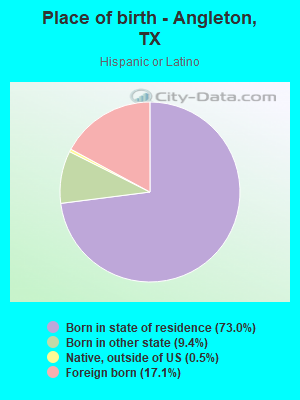
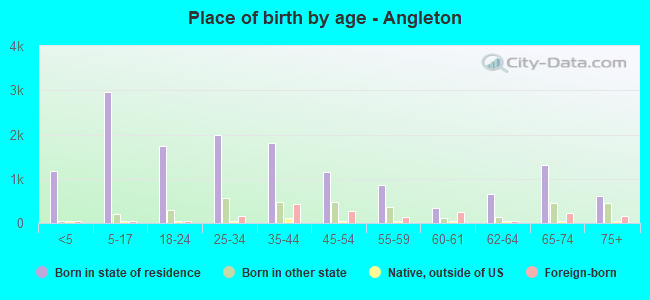
Place of birth - Born in state of residence (%)
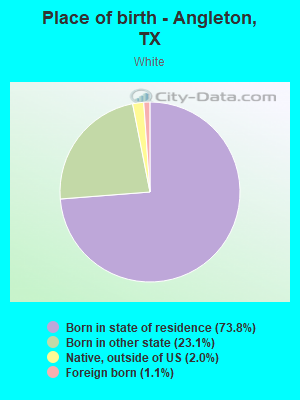
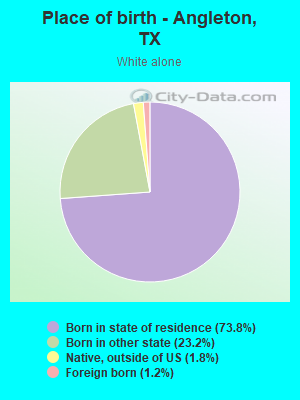
Place of birth - Born in state of residence (%) - White
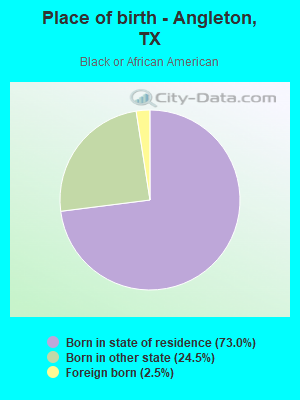
Place of birth - Born in state of residence (%) - Black or African American
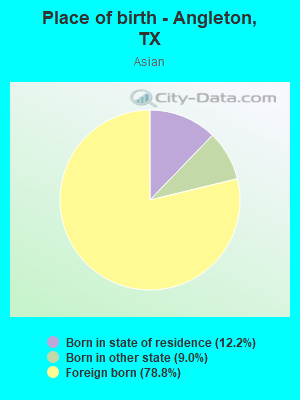
Place of birth - Born in state of residence (%) - Asian
Place of birth - Born in state of residence (%) - Hispanic or Latino
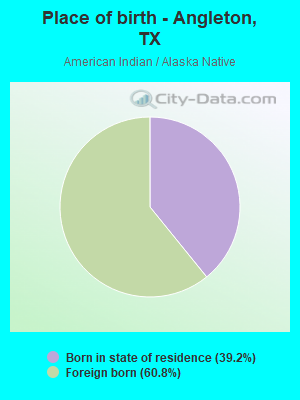
Place of birth - Born in state of residence (%) - American Indian and Alaska Native
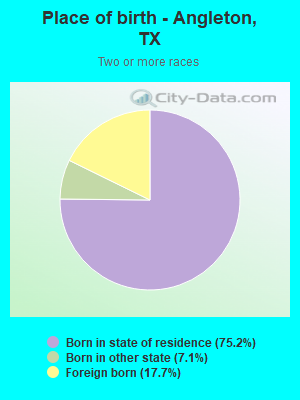
Place of birth - Born in state of residence (%) - Multirace
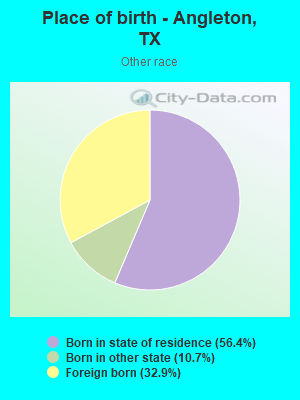
Place of birth - Born in state of residence (%) - Other Race
Place of birth - Born in other state (%)
Place of birth - Born in other state (%) - White
Place of birth - Born in other state (%) - Black or African American
Place of birth - Born in other state (%) - Asian
Place of birth - Born in other state (%) - Hispanic or Latino
Place of birth - Born in other state (%) - American Indian and Alaska Native
Place of birth - Born in other state (%) - Multirace
Place of birth - Born in other state (%) - Other Race
Place of birth - Native, outside of US (%)
Place of birth - Native, outside of US (%) - White
Place of birth - Native, outside of US (%) - Black or African American
Place of birth - Native, outside of US (%) - Asian
Place of birth - Native, outside of US (%) - Hispanic or Latino
Place of birth - Native, outside of US (%) - American Indian and Alaska Native
Place of birth - Native, outside of US (%) - Multirace
Place of birth - Native, outside of US (%) - Other Race
Place of birth - Foreign born (%)
Place of birth - Foreign born (%) - White
Place of birth - Foreign born (%) - Black or African American
Place of birth - Foreign born (%) - Asian
Place of birth - Foreign born (%) - Hispanic or Latino
Place of birth - Foreign born (%) - American Indian and Alaska Native
Place of birth - Foreign born (%) - Multirace
Place of birth - Foreign born (%) - Other Race
Residents speaking English at home (%)
Residents speaking English at home - Born in the United States (%)
Residents speaking English at home - Native, born elsewhere (%)
Residents speaking English at home - Foreign born (%)
Residents speaking Spanish at home (%)
Residents speaking Spanish at home - Born in the United States (%)
Residents speaking Spanish at home - Native, born elsewhere (%)
Residents speaking Spanish at home - Foreign born (%)
Residents speaking other language at home (%)
Residents speaking other language at home - Born in the United States (%)
Residents speaking other language at home - Native, born elsewhere (%)
Residents speaking other language at home - Foreign born (%)
Marital status - Never married (%)
Marital status - Now married (%)
Marital status - Separated (%)
Marital status - Widowed (%)
Marital status - Divorced (%)
Ancestries Reported - Arab (%)
Ancestries Reported - Czech (%)
Ancestries Reported - Danish (%)
Ancestries Reported - Dutch (%)
Ancestries Reported - English (%)
Ancestries Reported - French (%)
Ancestries Reported - French Canadian (%)
Ancestries Reported - German (%)
Ancestries Reported - Greek (%)
Ancestries Reported - Hungarian (%)
Ancestries Reported - Irish (%)
Ancestries Reported - Italian (%)
Ancestries Reported - Lithuanian (%)
Ancestries Reported - Norwegian (%)
Ancestries Reported - Polish (%)
Ancestries Reported - Portuguese (%)
Ancestries Reported - Russian (%)
Ancestries Reported - Scotch-Irish (%)
Ancestries Reported - Scottish (%)
Ancestries Reported - Slovak (%)
Ancestries Reported - Subsaharan African (%)
Ancestries Reported - Swedish (%)
Ancestries Reported - Swiss (%)
Ancestries Reported - Ukrainian (%)
Ancestries Reported - United States (%)
Ancestries Reported - Welsh (%)
Ancestries Reported - West Indian (%)
Ancestries Reported - Other (%)
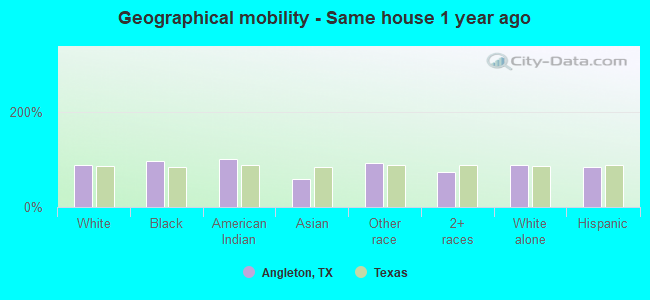
Geographical mobility - Same house 1 year ago (%)
Geographical mobility - Same house 1 year ago (%) - White
Geographical mobility - Same house 1 year ago (%) - Black or African American
Geographical mobility - Same house 1 year ago (%) - Asian
Geographical mobility - Same house 1 year ago (%) - Hispanic or Latino
Geographical mobility - Same house 1 year ago (%) - American Indian and Alaska Native
Geographical mobility - Same house 1 year ago (%) - Multirace
Geographical mobility - Same house 1 year ago (%) - Other Race
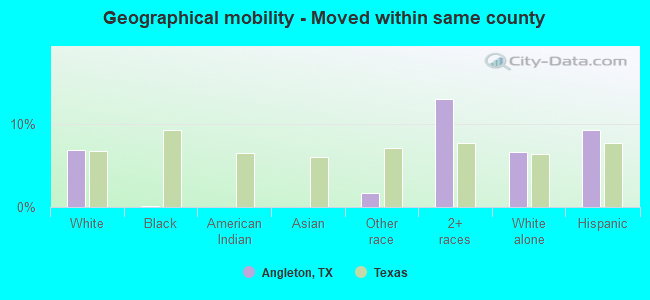
Geographical mobility - Moved within same county (%)
Geographical mobility - Moved within same county (%) - White
Geographical mobility - Moved within same county (%) - Black or African American
Geographical mobility - Moved within same county (%) - Asian
Geographical mobility - Moved within same county (%) - Hispanic or Latino
Geographical mobility - Moved within same county (%) - American Indian and Alaska Native
Geographical mobility - Moved within same county (%) - Multirace
Geographical mobility - Moved within same county (%) - Other Race
Geographical mobility - Moved from different county within same state (%)
Geographical mobility - Moved from different county within same state (%) - White
Geographical mobility - Moved from different county within same state (%) - Black or African American
Geographical mobility - Moved from different county within same state (%) - Asian
Geographical mobility - Moved from different county within same state (%) - Hispanic or Latino
Geographical mobility - Moved from different county within same state (%) - American Indian and Alaska Native
Geographical mobility - Moved from different county within same state (%) - Multirace
Geographical mobility - Moved from different county within same state (%) - Other Race
Geographical mobility - Moved from different state (%)
Geographical mobility - Moved from different state (%) - White
Geographical mobility - Moved from different state (%) - Black or African American
Geographical mobility - Moved from different state (%) - Asian
Geographical mobility - Moved from different state (%) - Hispanic or Latino
Geographical mobility - Moved from different state (%) - American Indian and Alaska Native
Geographical mobility - Moved from different state (%) - Multirace
Geographical mobility - Moved from different state (%) - Other Race
Geographical mobility - Moved from abroad (%)
Geographical mobility - Moved from abroad (%) - White
Geographical mobility - Moved from abroad (%) - Black or African American
Geographical mobility - Moved from abroad (%) - Asian
Geographical mobility - Moved from abroad (%) - Hispanic or Latino
Geographical mobility - Moved from abroad (%) - American Indian and Alaska Native
Geographical mobility - Moved from abroad (%) - Multirace
Geographical mobility - Moved from abroad (%) - Other Race
Place of birth for the foreign-born population - Ireland (%)
Place of birth for the foreign-born population - Denmark (%)
Place of birth for the foreign-born population - Norway (%)
Place of birth for the foreign-born population - Sweden (%)
Place of birth for the foreign-born population - United Kingdom (%)
Place of birth for the foreign-born population - England (%)
Place of birth for the foreign-born population - Scotland (%)
Place of birth for the foreign-born population - Other Northern Europe (%)
Place of birth for the foreign-born population - Austria (%)
Place of birth for the foreign-born population - Belgium (%)
Place of birth for the foreign-born population - France (%)
Place of birth for the foreign-born population - Germany (%)
Place of birth for the foreign-born population - Netherlands (%)
Place of birth for the foreign-born population - Switzerland (%)
Place of birth for the foreign-born population - Other Western Europe (%)
Place of birth for the foreign-born population - Greece (%)
Place of birth for the foreign-born population - Italy (%)
Place of birth for the foreign-born population - Portugal (%)
Place of birth for the foreign-born population - Spain (%)
Place of birth for the foreign-born population - Other Southern Europe (%)
Place of birth for the foreign-born population - Albania (%)
Place of birth for the foreign-born population - Belarus (%)
Place of birth for the foreign-born population - Bosnia and Herzegovina (%)
Place of birth for the foreign-born population - Bulgaria (%)
Place of birth for the foreign-born population - Croatia (%)
Place of birth for the foreign-born population - Czechoslovakia (%)
Place of birth for the foreign-born population - Hungary (%)
Place of birth for the foreign-born population - Latvia (%)
Place of birth for the foreign-born population - Lithuania (%)
Place of birth for the foreign-born population - North Macedonia (Macedonia) (%)
Place of birth for the foreign-born population - Moldova (%)
Place of birth for the foreign-born population - Poland (%)
Place of birth for the foreign-born population - Romania (%)
Place of birth for the foreign-born population - Russia (%)
Place of birth for the foreign-born population - Serbia (%)
Place of birth for the foreign-born population - Ukraine (%)
Place of birth for the foreign-born population - Other Eastern Europe (%)
Place of birth for the foreign-born population - China (%)
Place of birth for the foreign-born population - Hong Kong (%)
Place of birth for the foreign-born population - Taiwan (%)
Place of birth for the foreign-born population - Japan (%)
Place of birth for the foreign-born population - Korea (%)
Place of birth for the foreign-born population - Other Eastern Asia (%)
Place of birth for the foreign-born population - Afghanistan (%)
Place of birth for the foreign-born population - Bangladesh (%)
Place of birth for the foreign-born population - India (%)
Place of birth for the foreign-born population - Iran (%)
Place of birth for the foreign-born population - Kazakhstan (%)
Place of birth for the foreign-born population - Nepal (%)
Place of birth for the foreign-born population - Pakistan (%)
Place of birth for the foreign-born population - Sri Lanka (%)
Place of birth for the foreign-born population - Uzbekistan (%)
Place of birth for the foreign-born population - Other South Central Asia (%)
Place of birth for the foreign-born population - Burma (%)
Place of birth for the foreign-born population - Cambodia (%)
Place of birth for the foreign-born population - Indonesia (%)
Place of birth for the foreign-born population - Laos (%)
Place of birth for the foreign-born population - Malaysia (%)
Place of birth for the foreign-born population - Philippines (%)
Place of birth for the foreign-born population - Singapore (%)
Place of birth for the foreign-born population - Thailand (%)
Place of birth for the foreign-born population - Vietnam (%)
Place of birth for the foreign-born population - Other South Eastern Asia (%)
Place of birth for the foreign-born population - Armenia (%)
Place of birth for the foreign-born population - Iraq (%)
Place of birth for the foreign-born population - Israel (%)
Place of birth for the foreign-born population - Jordan (%)
Place of birth for the foreign-born population - Kuwait (%)
Place of birth for the foreign-born population - Lebanon (%)
Place of birth for the foreign-born population - Saudi Arabia (%)
Place of birth for the foreign-born population - Syria (%)
Place of birth for the foreign-born population - Turkey (%)
Place of birth for the foreign-born population - Yemen (%)
Place of birth for the foreign-born population - Other Western Asia (%)
Place of birth for the foreign-born population - Eritrea (%)
Place of birth for the foreign-born population - Ethiopia (%)
Place of birth for the foreign-born population - Kenya (%)
Place of birth for the foreign-born population - Somalia (%)
Place of birth for the foreign-born population - Uganda (%)
Place of birth for the foreign-born population - Zimbabwe (%)
Place of birth for the foreign-born population - Other Eastern Africa (%)
Place of birth for the foreign-born population - Cameroon (%)
Place of birth for the foreign-born population - Congo (%)
Place of birth for the foreign-born population - Democratic Republic of Congo (Zaire) (%)
Place of birth for the foreign-born population - Other Middle Africa (%)
Place of birth for the foreign-born population - Egypt (%)
Place of birth for the foreign-born population - Morocco (%)
Place of birth for the foreign-born population - Sudan (%)
Place of birth for the foreign-born population - Other Northern Africa (%)
Place of birth for the foreign-born population - South Africa (%)
Place of birth for the foreign-born population - Other Southern Africa (%)
Place of birth for the foreign-born population - Cabo Verde (%)
Place of birth for the foreign-born population - Ghana (%)
Place of birth for the foreign-born population - Liberia (%)
Place of birth for the foreign-born population - Nigeria (%)
Place of birth for the foreign-born population - Senegal (%)
Place of birth for the foreign-born population - Sierra Leone (%)
Place of birth for the foreign-born population - Other Western Africa (%)
Place of birth for the foreign-born population - Australia (%)
Place of birth for the foreign-born population - New Zealand (%)
Place of birth for the foreign-born population - Fiji (%)
Place of birth for the foreign-born population - Micronesia (%)
Place of birth for the foreign-born population - Bahamas (%)
Place of birth for the foreign-born population - Barbados (%)
Place of birth for the foreign-born population - Cuba (%)
Place of birth for the foreign-born population - Dominica (%)
Place of birth for the foreign-born population - Dominican Republic (%)
Place of birth for the foreign-born population - Grenada (%)
Place of birth for the foreign-born population - Haiti (%)
Place of birth for the foreign-born population - Jamaica (%)
Place of birth for the foreign-born population - St. Vincent and the Grenadines (%)
Place of birth for the foreign-born population - Trinidad and Tobago (%)
Place of birth for the foreign-born population - West Indies (%)
Place of birth for the foreign-born population - Other Caribbean (%)
Place of birth for the foreign-born population - Belize (%)
Place of birth for the foreign-born population - Costa Rica (%)
Place of birth for the foreign-born population - El Salvador (%)
Place of birth for the foreign-born population - Guatemala (%)
Place of birth for the foreign-born population - Honduras (%)
Place of birth for the foreign-born population - Mexico (%)
Place of birth for the foreign-born population - Nicaragua (%)
Place of birth for the foreign-born population - Panama (%)
Place of birth for the foreign-born population - Other Central America (%)
Place of birth for the foreign-born population - Argentina (%)
Place of birth for the foreign-born population - Bolivia (%)
Place of birth for the foreign-born population - Brazil (%)
Place of birth for the foreign-born population - Chile (%)
Place of birth for the foreign-born population - Colombia (%)
Place of birth for the foreign-born population - Ecuador (%)
Place of birth for the foreign-born population - Guyana (%)
Place of birth for the foreign-born population - Peru (%)
Place of birth for the foreign-born population - Uruguay (%)
Place of birth for the foreign-born population - Venezuela (%)
Place of birth for the foreign-born population - Other South America (%)
Place of birth for the foreign-born population - Canada (%)
Place of birth for the foreign-born population - Other Northern America (%)
Place of birth for the foreign-born population - Other (%)
Latest news about races in Angleton, TX collected exclusively by city-data.com from local newspapers, TV, and radio stations
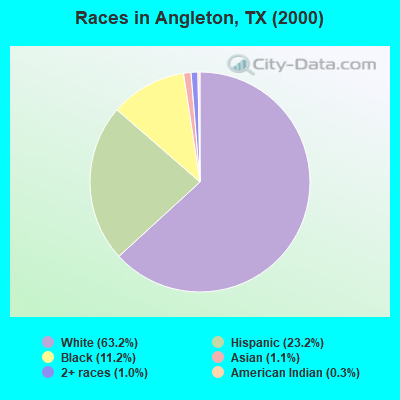
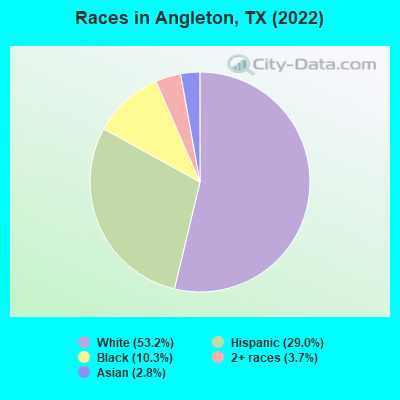
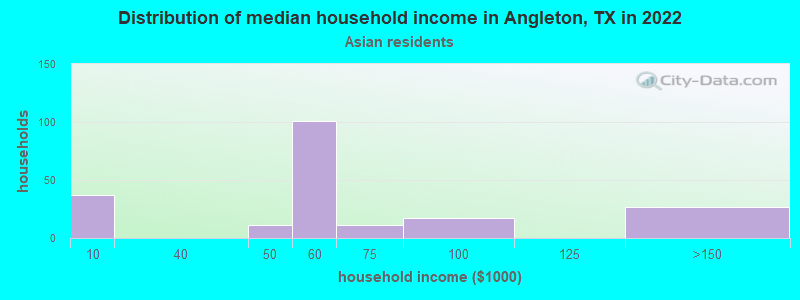
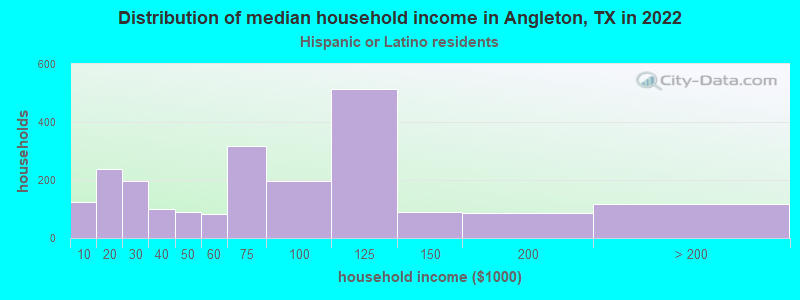
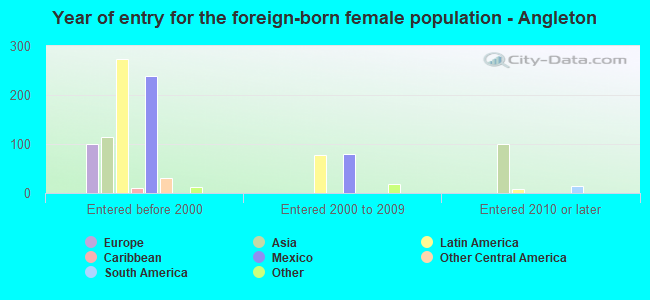
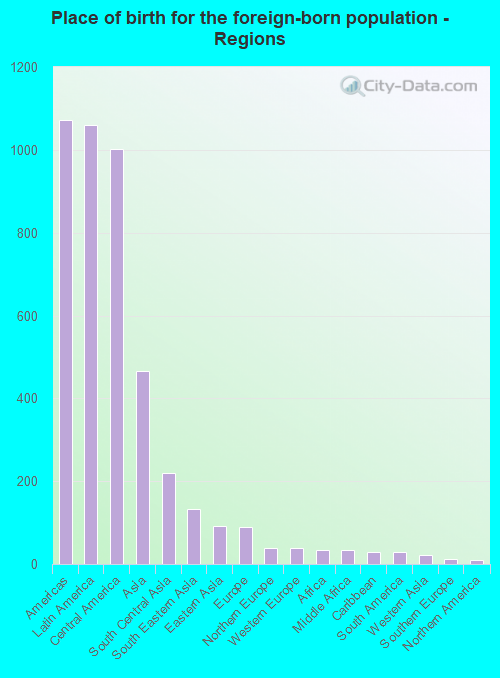
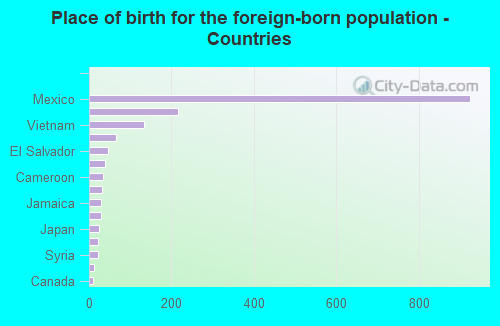
According to 2022 data, the most numerous races in Angleton, TX are Hispanic (5,851 residents), White alone (10,719 residents), and Black alone (2,077 residents). 79.6% of Angleton residents speak English at home. 8.2% of Angleton, TX residents are foreign-born (5.3% born in Latin America, 2.3% born in Asia), which is 106.2% less than the foreign-born rate of 17.0% across the entire state of Texas.
Race distribution in Angleton
2000 2022
10,933,313 52.4% White alone 6,669,666 32.0% Hispanic 2,364,255 11.3% Black alone 554,445 2.7% Asian alone 230,567 1.1% Two or more races 68,859 0.3% American Indian alone 19,958 0.10% Other race alone 10,757 0.05% Native Hawaiian and Other
12,070,642 40.2% Hispanic 11,683,430 38.9% White alone 3,508,706 11.7% Black alone 1,608,173 5.4% Asian alone 956,560 3.2% Two or more races 125,763 0.4% Other race alone 47,023 0.2% American Indian alone 29,275 0.10% Native Hawaiian and Other
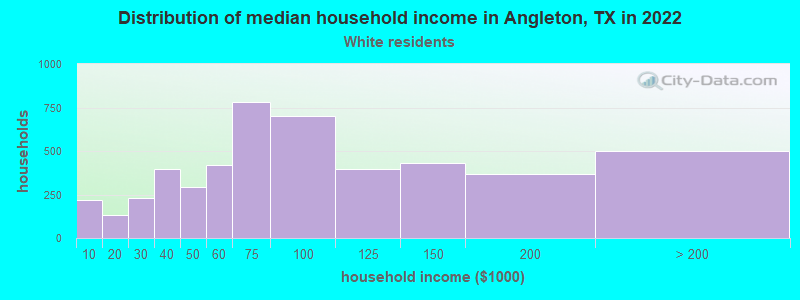
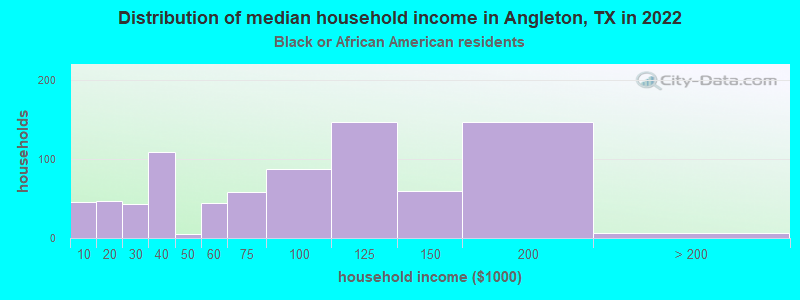
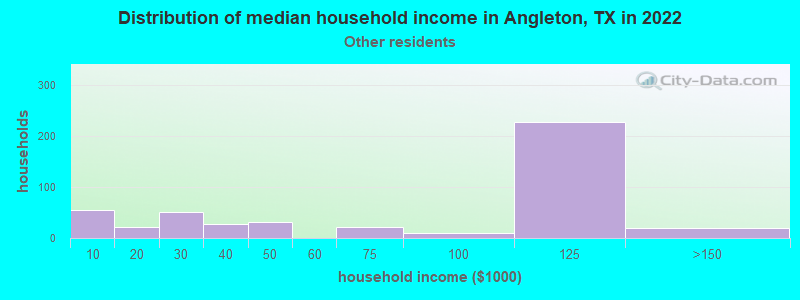
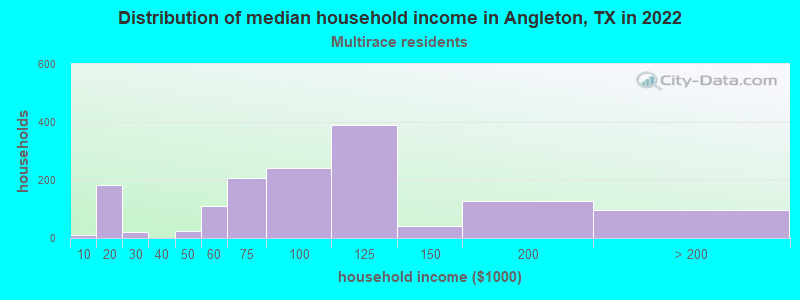
Income and house value in Angleton Median household income in 2022 $78,897 White non-Hispanic householders$71,512 Black householders$62,114 Asian householders$89,375 Some other race householders$79,428 Two or more races householders$65,691 Hispanic or Latino race householdersMedian 2022 house value $199,494 White Non-Hispanic householders$176,597 Black or African American householders $178,886 Asian householders$125,363 Some other race householders$219,530 Two or more races householders$174,593 Hispanic or Latino householders
Median age by race in Angleton
39.4 Median age for White residents39.4 39.8 42.0 Median age for Black or African American residents41.6 42.6 62.8 Median age for American Indian / Alaska Native residents-560,150,375.4 -726,368,158.5 61.9 Median age for Asian residents37.1 64.2 -1,307,359,306.1 Median age for Native Hawaiian / Pacific Islander residents-688,430,698.1 -577,777,777.2 48.7 Median age for Other race residents47.3 41.3 27.2 Median age for Two or more races residents26.1 28.1 39.4 Median age for White alone residents40.8 38.1 32.2 Median age for Hispanic or Latino residents32.2 32.5
Owner/renter occupied households by race in Angleton
House owners and renters - White residents 3,230 69.0% Owner occupied1,454 31.0% Renter occupiedHouse owners and renters - Black or African American residents 574 68.7% Owner occupied262 31.3% Renter occupiedHouse owners and renters - Asian residents 155 63.2% Owner occupied91 36.8% Renter occupiedHouse owners and renters - Other race residents 533 95.0% Owner occupied28 5.0% Renter occupiedHouse owners and renters - Two or more races residents 775 48.2% Owner occupied834 51.8% Renter occupiedHouse owners and renters - White alone residents 3,073 68.8% Owner occupied1,393 31.2% Renter occupiedHouse owners and renters - Hispanic or Latino residents 1,328 63.5% Owner occupied763 36.5% Renter occupied
Language usage in Angleton
English speakers - Total 79.6% of residents of Angleton speak English at home.
17.1% of residents speak Spanish at home 2,584 80.0% Speak English very well645 20.0% Speak English less than very well3.4% of residents speak other language at home 133 20.9% Speak English very well502 79.1% Speak English less than very well
English speakers - Born in the United States 88.4% of residents of Angleton speak English at home.
7.4% of residents speak Spanish at home 272 100.0% Speak English very well5.0% of residents speak other language at home 55 29.6% Speak English very well131 70.4% Speak English less than very well
English speakers - Native, born elsewhere 98.9% of residents of Angleton speak English at home.
8.2% of residents speak Spanish at home 2 9.1% Speak English very well20 90.9% Speak English less than very well
English speakers - Foreign-born 10.7% of residents of Angleton speak English at home.
60.8% of residents speak Spanish at home 575 59.2% Speak English very well396 40.8% Speak English less than very well28.6% of residents speak other language at home 78 17.1% Speak English very well378 82.9% Speak English less than very well
White (Caucasian) - Speak only English Native:
94.4% (10,115)Foreign-born:
56.2% (68)
White (Caucasian) - Speak another language Native:
6.4% (686)Foreign-born:
56.8% (69)
Black or African American - Speak only English Native:
100.0% (2,042)Foreign-born:
19.4% (10)
Black or African American - Speak another language Native:
0.4% (8)Foreign-born:
65.5% (35)
Asian - Speak only English Native:
31.3% (33)Foreign-born:
11.1% (51)
Asian - Speak another language Native:
72.0% (75)Foreign-born:
88.6% (404)
Other race - Speak only English Native:
45.9% (384)Foreign-born:
6.8% (29)
Other race - Speak another language Native:
54.2% (453)Foreign-born:
93.0% (404)
Two or more races - Speak another language Native:
34.2% (1,064)Foreign-born:
100.0% (811)
White alone - Speak only English Native:
95.6% (9,551)Foreign-born:
65.2% (79)
White alone - Speak another language Native:
3.9% (390)Foreign-born:
26.1% (32)
Hispanic or Latino - Speak only English Native:
59.8% (2,697)Foreign-born:
2.3% (23)
Hispanic or Latino - Speak another language Native:
40.8% (1,840)Foreign-born:
97.9% (983)
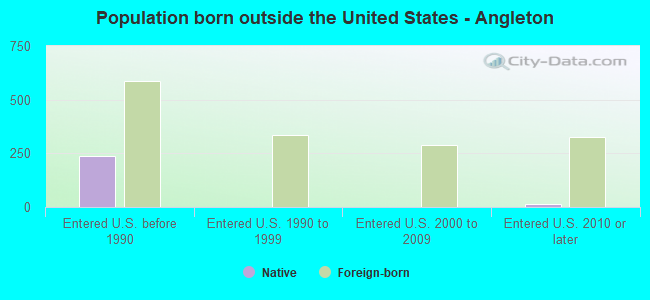
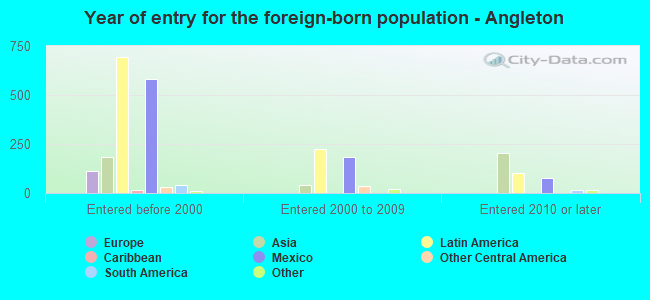
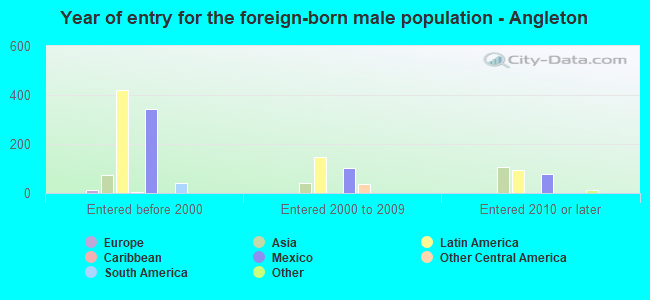
Foreign-born residents in Angleton 1,662 residents are foreign born (5.3% Latin America , 2.3% Asia ).
This city:
8.2%Texas:
17.1%
Marital status for residents in Angleton Marital status - White (Caucasian) population 15 years and over
Males 34.7% Never married48.8% Now married3.2% Separated1.7% Widowed11.6% DivorcedFemales 25.6% Never married42.6% Now married0.8% Separated10.8% Widowed20.2% DivorcedWomen who gave birth in the past 12 months Now married:
22.8% (19)Unmarried:
77.2% (64)
Women who did not give birth in the past 12 months Now married:
42.4% (1,012)Unmarried:
57.6% (1,376)
Marital status - Black or African American population 15 years and over
Males 36.7% Never married49.9% Now married4.1% Separated0.0% Widowed9.2% DivorcedFemales 30.1% Never married40.3% Now married0.8% Separated20.8% Widowed8.1% DivorcedWomen who gave birth in the past 12 months Now married:
0.0% (0)Unmarried:
100.0% (38)
Women who did not give birth in the past 12 months Now married:
40.4% (231)Unmarried:
59.6% (341)
Marital status - Asian population 15 years and over
Males 7.4% Never married56.7% Now married0.0% Separated7.8% Widowed28.0% DivorcedFemales 12.7% Never married85.7% Now married0.0% Separated1.6% Widowed0.0% DivorcedWomen who did not give birth in the past 12 months Now married:
36.7% (19)Unmarried:
63.3% (32)
Marital status - Other race population 15 years and over
Males 38.8% Never married56.0% Now married0.0% Separated0.0% Widowed5.2% DivorcedFemales 43.7% Never married44.6% Now married5.1% Separated4.5% Widowed2.1% DivorcedWomen who did not give birth in the past 12 months Now married:
31.1% (132)Unmarried:
68.9% (293)
Marital status - Two or more races population 15 years and over
Males 23.4% Never married60.7% Now married0.2% Separated2.9% Widowed12.8% DivorcedFemales 30.2% Never married49.7% Now married0.0% Separated4.8% Widowed15.3% DivorcedWomen who did not give birth in the past 12 months Now married:
50.0% (572)Unmarried:
50.0% (572)
Marital status - White alone, not Hispanic / Latino population 15 years and over
Males 32.1% Never married51.5% Now married3.3% Separated2.0% Widowed11.0% DivorcedFemales 24.4% Never married44.1% Now married0.2% Separated9.6% Widowed21.8% DivorcedWomen who gave birth in the past 12 months Now married:
22.8% (23)Unmarried:
77.2% (77)
Women who did not give birth in the past 12 months Now married:
42.1% (976)Unmarried:
57.9% (1,342)
Marital status - Hispanic or Latino population 15 years and over
Males 38.0% Never married48.2% Now married1.3% Separated0.9% Widowed11.7% DivorcedFemales 34.7% Never married40.2% Now married2.6% Separated9.6% Widowed12.8% DivorcedWomen who did not give birth in the past 12 months Now married:
41.3% (629)Unmarried:
58.7% (894)
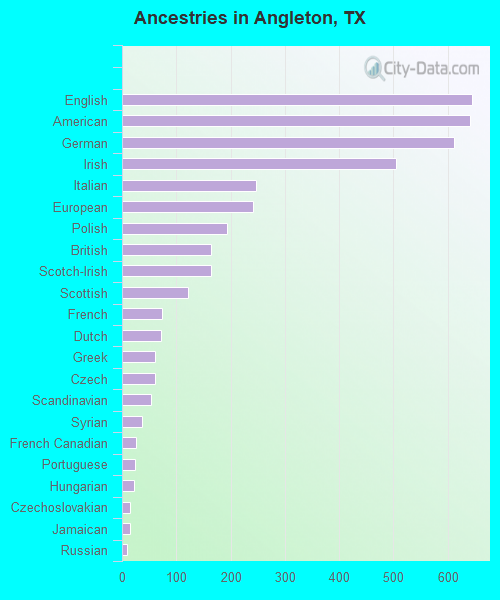
Ancestries in Angleton
644 5.8% English642 5.8% American612 5.5% German504 4.6% Irish246 2.2% Italian241 2.2% European193 1.7% Polish164 1.5% British164 1.5% Scotch-Irish121 1.1% Scottish74 0.7% French72 0.7% Dutch61 0.6% Greek60 0.5% Czech54 0.5% Scandinavian37 0.3% Syrian25 0.2% French Canadian24 0.2% Portuguese22 0.2% Hungarian14 0.1% Czechoslovakian14 0.1% Jamaican10 0.09% Russian
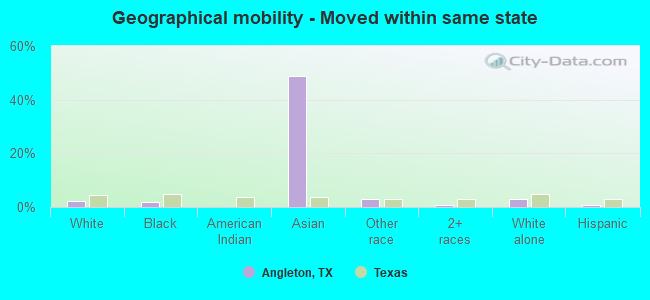
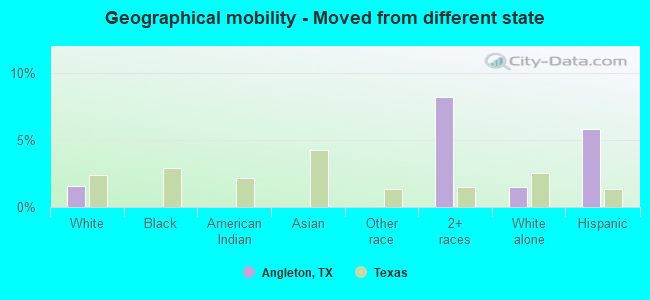
Geographical mobility in Angleton Same house 1 year ago 9,756 88.2% White (Caucasian)1,993 97.0% Black or African American80 100.0% American Indian / Alaska Native335 57.6% Asian1,192 92.9% Other race3,366 73.7% Two or more races9,372 88.3% White alone, not Hispanic / Latino4,850 82.7% Hispanic or LatinoMoved within same county 765 6.9% White / Caucasian1 0.1% Black or African American21 1.7% Other race597 13.1% Two or more races709 6.7% White alone, not Hispanic / Latino550 9.4% Hispanic or LatinoMoved within same state 268 2.4% White / Caucasian39 1.9% Black or African American284 48.8% Asian37 2.9% Other race42 0.9% Two or more races311 2.9% White alone, not Hispanic / Latino53 0.9% Hispanic or LatinoMoved from different state 176 1.6% White / Caucasian373 8.2% Two or more races158 1.5% White alone, not Hispanic / Latino340 5.8% Hispanic or Latino
Children Nativity (place of birth) in Angleton
Children under 6 years - Living with two parents Both parents native 609 100.0% NativeBoth parents foreign-born 36 100.0% NativeOne native, one foreign-born parent 198 100.0% NativeChildren under 6 years - Living with one parent Native parent 779 100.0% NativeChildren 6 to 17 years - Living with two parents Both parents native 1,153 100.0% NativeBoth parents foreign-born 65 100.0% NativeOne native, one foreign-born parent 107 100.0% NativeChildren 6 to 17 years - Living with one parent Native parent 1,344 100.0% NativeForeign-born parent 24 48.9% Native25 51.1% Foreign-born
Grandparents responsible for own grandchildren in Angleton
Grandparents (30 to 59 years) White / Caucasian 21 21.8% Responsible for grandchildren75 78.2% Not responsible for grandchildrenBlack or African American 5 6.5% Responsible for grandchildren67 93.5% Not responsible for grandchildrenTwo or more races 131 100.0% Responsible for grandchildrenWhite alone, not Hispanic / Latino 29 22.7% Responsible for grandchildren99 77.3% Not responsible for grandchildrenHispanic or Latino 91 83.6% Responsible for grandchildren18 16.4% Not responsible for grandchildrenGrandparents (60 years and over) White / Caucasian 50 100.0% Not responsible for grandchildrenBlack or African American 4 40.6% Responsible for grandchildren5 59.4% Not responsible for grandchildrenTwo or more races 70 100.0% Responsible for grandchildrenWhite alone, not Hispanic / Latino 42 100.0% Not responsible for grandchildrenHispanic or Latino 43 66.4% Responsible for grandchildren22 33.6% Not responsible for grandchildren