Races in Andover, Minnesota (MN) Detailed Stats
Data:
Races - White alone (%)
Races - White alone (% change since 2000)
Races - Black alone (%)
Races - Black alone (% change since 2000)
Races - American Indian alone (%)
Races - American Indian alone (% change since 2000)
Races - Asian alone (%)
Races - Asian alone (% change since 2000)
Races - Hispanic (%)
Races - Hispanic (% change since 2000)
Races - Native Hawaiian and Other Pacific Islander alone (%)
Races - Native Hawaiian and Other Pacific Islander alone (% change since 2000)
Races - Two or more races(%)
Races - Two or more races(% change since 2000)
Races - Other race alone (%)
Races - Other race alone (% change since 2000)
Racial diversity
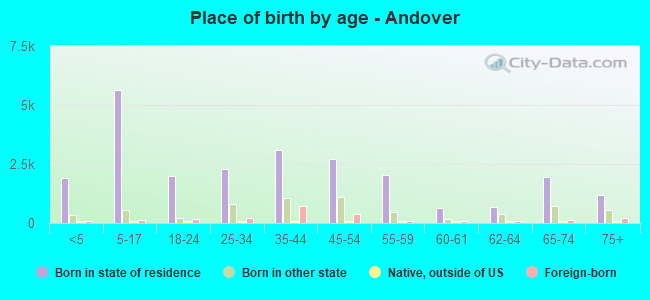
Place of birth - Born in state of residence (%)
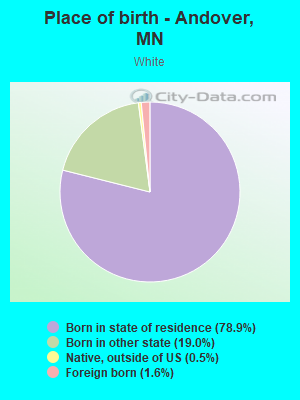
Place of birth - Born in state of residence (%) - White
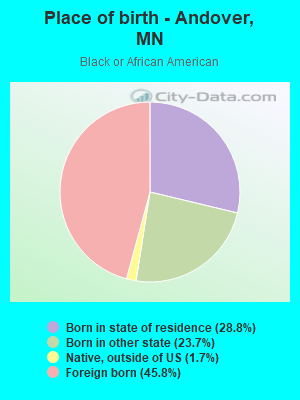
Place of birth - Born in state of residence (%) - Black or African American
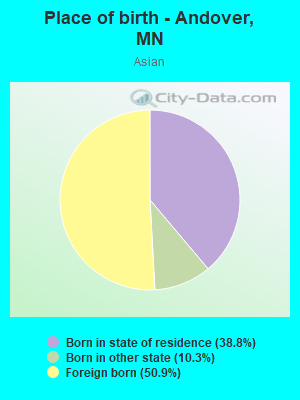
Place of birth - Born in state of residence (%) - Asian
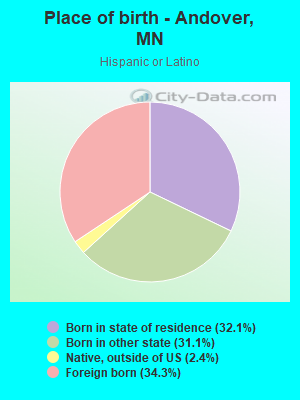
Place of birth - Born in state of residence (%) - Hispanic or Latino
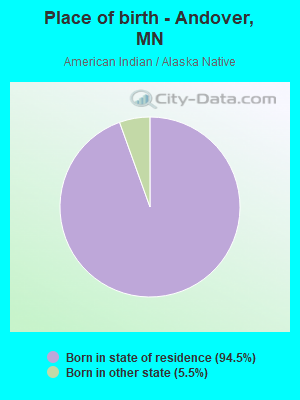
Place of birth - Born in state of residence (%) - American Indian and Alaska Native
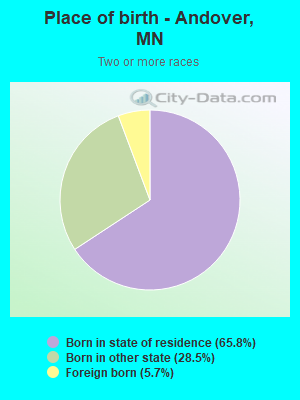
Place of birth - Born in state of residence (%) - Multirace
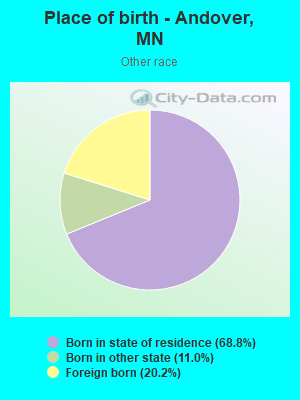
Place of birth - Born in state of residence (%) - Other Race
Place of birth - Born in other state (%)
Place of birth - Born in other state (%) - White
Place of birth - Born in other state (%) - Black or African American
Place of birth - Born in other state (%) - Asian
Place of birth - Born in other state (%) - Hispanic or Latino
Place of birth - Born in other state (%) - American Indian and Alaska Native
Place of birth - Born in other state (%) - Multirace
Place of birth - Born in other state (%) - Other Race
Place of birth - Native, outside of US (%)
Place of birth - Native, outside of US (%) - White
Place of birth - Native, outside of US (%) - Black or African American
Place of birth - Native, outside of US (%) - Asian
Place of birth - Native, outside of US (%) - Hispanic or Latino
Place of birth - Native, outside of US (%) - American Indian and Alaska Native
Place of birth - Native, outside of US (%) - Multirace
Place of birth - Native, outside of US (%) - Other Race
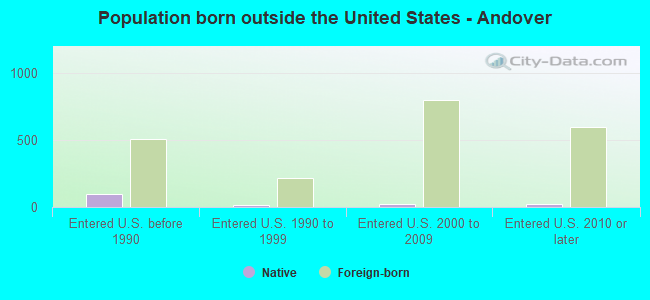
Place of birth - Foreign born (%)
Place of birth - Foreign born (%) - White
Place of birth - Foreign born (%) - Black or African American
Place of birth - Foreign born (%) - Asian
Place of birth - Foreign born (%) - Hispanic or Latino
Place of birth - Foreign born (%) - American Indian and Alaska Native
Place of birth - Foreign born (%) - Multirace
Place of birth - Foreign born (%) - Other Race
Residents speaking English at home (%)
Residents speaking English at home - Born in the United States (%)
Residents speaking English at home - Native, born elsewhere (%)
Residents speaking English at home - Foreign born (%)
Residents speaking Spanish at home (%)
Residents speaking Spanish at home - Born in the United States (%)
Residents speaking Spanish at home - Native, born elsewhere (%)
Residents speaking Spanish at home - Foreign born (%)
Residents speaking other language at home (%)
Residents speaking other language at home - Born in the United States (%)
Residents speaking other language at home - Native, born elsewhere (%)
Residents speaking other language at home - Foreign born (%)
Marital status - Never married (%)
Marital status - Now married (%)
Marital status - Separated (%)
Marital status - Widowed (%)
Marital status - Divorced (%)
Ancestries Reported - Arab (%)
Ancestries Reported - Czech (%)
Ancestries Reported - Danish (%)
Ancestries Reported - Dutch (%)
Ancestries Reported - English (%)
Ancestries Reported - French (%)
Ancestries Reported - French Canadian (%)
Ancestries Reported - German (%)
Ancestries Reported - Greek (%)
Ancestries Reported - Hungarian (%)
Ancestries Reported - Irish (%)
Ancestries Reported - Italian (%)
Ancestries Reported - Lithuanian (%)
Ancestries Reported - Norwegian (%)
Ancestries Reported - Polish (%)
Ancestries Reported - Portuguese (%)
Ancestries Reported - Russian (%)
Ancestries Reported - Scotch-Irish (%)
Ancestries Reported - Scottish (%)
Ancestries Reported - Slovak (%)
Ancestries Reported - Subsaharan African (%)
Ancestries Reported - Swedish (%)
Ancestries Reported - Swiss (%)
Ancestries Reported - Ukrainian (%)
Ancestries Reported - United States (%)
Ancestries Reported - Welsh (%)
Ancestries Reported - West Indian (%)
Ancestries Reported - Other (%)
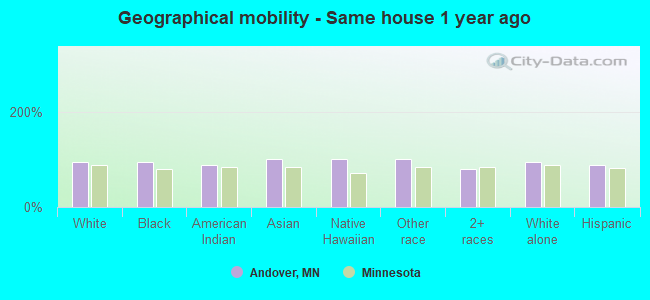
Geographical mobility - Same house 1 year ago (%)
Geographical mobility - Same house 1 year ago (%) - White
Geographical mobility - Same house 1 year ago (%) - Black or African American
Geographical mobility - Same house 1 year ago (%) - Asian
Geographical mobility - Same house 1 year ago (%) - Hispanic or Latino
Geographical mobility - Same house 1 year ago (%) - American Indian and Alaska Native
Geographical mobility - Same house 1 year ago (%) - Multirace
Geographical mobility - Same house 1 year ago (%) - Other Race
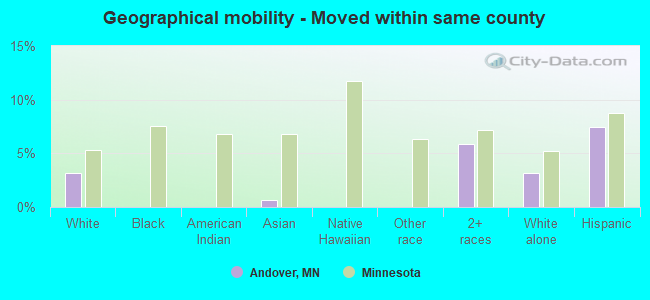
Geographical mobility - Moved within same county (%)
Geographical mobility - Moved within same county (%) - White
Geographical mobility - Moved within same county (%) - Black or African American
Geographical mobility - Moved within same county (%) - Asian
Geographical mobility - Moved within same county (%) - Hispanic or Latino
Geographical mobility - Moved within same county (%) - American Indian and Alaska Native
Geographical mobility - Moved within same county (%) - Multirace
Geographical mobility - Moved within same county (%) - Other Race
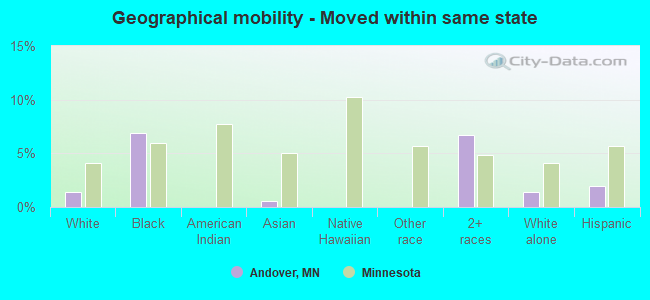
Geographical mobility - Moved from different county within same state (%)
Geographical mobility - Moved from different county within same state (%) - White
Geographical mobility - Moved from different county within same state (%) - Black or African American
Geographical mobility - Moved from different county within same state (%) - Asian
Geographical mobility - Moved from different county within same state (%) - Hispanic or Latino
Geographical mobility - Moved from different county within same state (%) - American Indian and Alaska Native
Geographical mobility - Moved from different county within same state (%) - Multirace
Geographical mobility - Moved from different county within same state (%) - Other Race
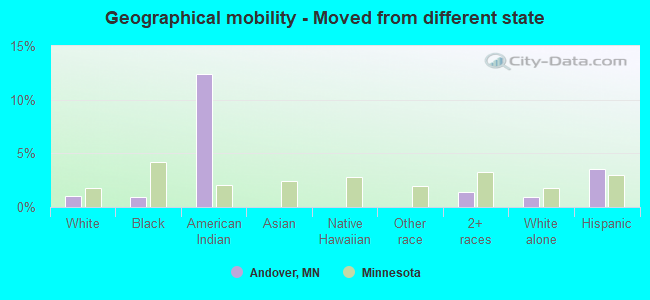
Geographical mobility - Moved from different state (%)
Geographical mobility - Moved from different state (%) - White
Geographical mobility - Moved from different state (%) - Black or African American
Geographical mobility - Moved from different state (%) - Asian
Geographical mobility - Moved from different state (%) - Hispanic or Latino
Geographical mobility - Moved from different state (%) - American Indian and Alaska Native
Geographical mobility - Moved from different state (%) - Multirace
Geographical mobility - Moved from different state (%) - Other Race
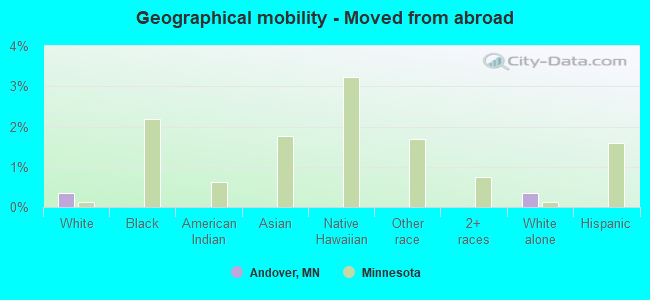
Geographical mobility - Moved from abroad (%)
Geographical mobility - Moved from abroad (%) - White
Geographical mobility - Moved from abroad (%) - Black or African American
Geographical mobility - Moved from abroad (%) - Asian
Geographical mobility - Moved from abroad (%) - Hispanic or Latino
Geographical mobility - Moved from abroad (%) - American Indian and Alaska Native
Geographical mobility - Moved from abroad (%) - Multirace
Geographical mobility - Moved from abroad (%) - Other Race
Place of birth for the foreign-born population - Ireland (%)
Place of birth for the foreign-born population - Denmark (%)
Place of birth for the foreign-born population - Norway (%)
Place of birth for the foreign-born population - Sweden (%)
Place of birth for the foreign-born population - United Kingdom (%)
Place of birth for the foreign-born population - England (%)
Place of birth for the foreign-born population - Scotland (%)
Place of birth for the foreign-born population - Other Northern Europe (%)
Place of birth for the foreign-born population - Austria (%)
Place of birth for the foreign-born population - Belgium (%)
Place of birth for the foreign-born population - France (%)
Place of birth for the foreign-born population - Germany (%)
Place of birth for the foreign-born population - Netherlands (%)
Place of birth for the foreign-born population - Switzerland (%)
Place of birth for the foreign-born population - Other Western Europe (%)
Place of birth for the foreign-born population - Greece (%)
Place of birth for the foreign-born population - Italy (%)
Place of birth for the foreign-born population - Portugal (%)
Place of birth for the foreign-born population - Spain (%)
Place of birth for the foreign-born population - Other Southern Europe (%)
Place of birth for the foreign-born population - Albania (%)
Place of birth for the foreign-born population - Belarus (%)
Place of birth for the foreign-born population - Bosnia and Herzegovina (%)
Place of birth for the foreign-born population - Bulgaria (%)
Place of birth for the foreign-born population - Croatia (%)
Place of birth for the foreign-born population - Czechoslovakia (%)
Place of birth for the foreign-born population - Hungary (%)
Place of birth for the foreign-born population - Latvia (%)
Place of birth for the foreign-born population - Lithuania (%)
Place of birth for the foreign-born population - North Macedonia (Macedonia) (%)
Place of birth for the foreign-born population - Moldova (%)
Place of birth for the foreign-born population - Poland (%)
Place of birth for the foreign-born population - Romania (%)
Place of birth for the foreign-born population - Russia (%)
Place of birth for the foreign-born population - Serbia (%)
Place of birth for the foreign-born population - Ukraine (%)
Place of birth for the foreign-born population - Other Eastern Europe (%)
Place of birth for the foreign-born population - China (%)
Place of birth for the foreign-born population - Hong Kong (%)
Place of birth for the foreign-born population - Taiwan (%)
Place of birth for the foreign-born population - Japan (%)
Place of birth for the foreign-born population - Korea (%)
Place of birth for the foreign-born population - Other Eastern Asia (%)
Place of birth for the foreign-born population - Afghanistan (%)
Place of birth for the foreign-born population - Bangladesh (%)
Place of birth for the foreign-born population - India (%)
Place of birth for the foreign-born population - Iran (%)
Place of birth for the foreign-born population - Kazakhstan (%)
Place of birth for the foreign-born population - Nepal (%)
Place of birth for the foreign-born population - Pakistan (%)
Place of birth for the foreign-born population - Sri Lanka (%)
Place of birth for the foreign-born population - Uzbekistan (%)
Place of birth for the foreign-born population - Other South Central Asia (%)
Place of birth for the foreign-born population - Burma (%)
Place of birth for the foreign-born population - Cambodia (%)
Place of birth for the foreign-born population - Indonesia (%)
Place of birth for the foreign-born population - Laos (%)
Place of birth for the foreign-born population - Malaysia (%)
Place of birth for the foreign-born population - Philippines (%)
Place of birth for the foreign-born population - Singapore (%)
Place of birth for the foreign-born population - Thailand (%)
Place of birth for the foreign-born population - Vietnam (%)
Place of birth for the foreign-born population - Other South Eastern Asia (%)
Place of birth for the foreign-born population - Armenia (%)
Place of birth for the foreign-born population - Iraq (%)
Place of birth for the foreign-born population - Israel (%)
Place of birth for the foreign-born population - Jordan (%)
Place of birth for the foreign-born population - Kuwait (%)
Place of birth for the foreign-born population - Lebanon (%)
Place of birth for the foreign-born population - Saudi Arabia (%)
Place of birth for the foreign-born population - Syria (%)
Place of birth for the foreign-born population - Turkey (%)
Place of birth for the foreign-born population - Yemen (%)
Place of birth for the foreign-born population - Other Western Asia (%)
Place of birth for the foreign-born population - Eritrea (%)
Place of birth for the foreign-born population - Ethiopia (%)
Place of birth for the foreign-born population - Kenya (%)
Place of birth for the foreign-born population - Somalia (%)
Place of birth for the foreign-born population - Uganda (%)
Place of birth for the foreign-born population - Zimbabwe (%)
Place of birth for the foreign-born population - Other Eastern Africa (%)
Place of birth for the foreign-born population - Cameroon (%)
Place of birth for the foreign-born population - Congo (%)
Place of birth for the foreign-born population - Democratic Republic of Congo (Zaire) (%)
Place of birth for the foreign-born population - Other Middle Africa (%)
Place of birth for the foreign-born population - Egypt (%)
Place of birth for the foreign-born population - Morocco (%)
Place of birth for the foreign-born population - Sudan (%)
Place of birth for the foreign-born population - Other Northern Africa (%)
Place of birth for the foreign-born population - South Africa (%)
Place of birth for the foreign-born population - Other Southern Africa (%)
Place of birth for the foreign-born population - Cabo Verde (%)
Place of birth for the foreign-born population - Ghana (%)
Place of birth for the foreign-born population - Liberia (%)
Place of birth for the foreign-born population - Nigeria (%)
Place of birth for the foreign-born population - Senegal (%)
Place of birth for the foreign-born population - Sierra Leone (%)
Place of birth for the foreign-born population - Other Western Africa (%)
Place of birth for the foreign-born population - Australia (%)
Place of birth for the foreign-born population - New Zealand (%)
Place of birth for the foreign-born population - Fiji (%)
Place of birth for the foreign-born population - Micronesia (%)
Place of birth for the foreign-born population - Bahamas (%)
Place of birth for the foreign-born population - Barbados (%)
Place of birth for the foreign-born population - Cuba (%)
Place of birth for the foreign-born population - Dominica (%)
Place of birth for the foreign-born population - Dominican Republic (%)
Place of birth for the foreign-born population - Grenada (%)
Place of birth for the foreign-born population - Haiti (%)
Place of birth for the foreign-born population - Jamaica (%)
Place of birth for the foreign-born population - St. Vincent and the Grenadines (%)
Place of birth for the foreign-born population - Trinidad and Tobago (%)
Place of birth for the foreign-born population - West Indies (%)
Place of birth for the foreign-born population - Other Caribbean (%)
Place of birth for the foreign-born population - Belize (%)
Place of birth for the foreign-born population - Costa Rica (%)
Place of birth for the foreign-born population - El Salvador (%)
Place of birth for the foreign-born population - Guatemala (%)
Place of birth for the foreign-born population - Honduras (%)
Place of birth for the foreign-born population - Mexico (%)
Place of birth for the foreign-born population - Nicaragua (%)
Place of birth for the foreign-born population - Panama (%)
Place of birth for the foreign-born population - Other Central America (%)
Place of birth for the foreign-born population - Argentina (%)
Place of birth for the foreign-born population - Bolivia (%)
Place of birth for the foreign-born population - Brazil (%)
Place of birth for the foreign-born population - Chile (%)
Place of birth for the foreign-born population - Colombia (%)
Place of birth for the foreign-born population - Ecuador (%)
Place of birth for the foreign-born population - Guyana (%)
Place of birth for the foreign-born population - Peru (%)
Place of birth for the foreign-born population - Uruguay (%)
Place of birth for the foreign-born population - Venezuela (%)
Place of birth for the foreign-born population - Other South America (%)
Place of birth for the foreign-born population - Canada (%)
Place of birth for the foreign-born population - Other Northern America (%)
Place of birth for the foreign-born population - Other (%)
Latest news about races in Andover, MN collected exclusively by city-data.com from local newspapers, TV, and radio stations
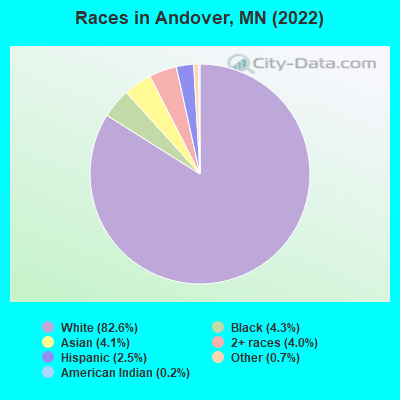
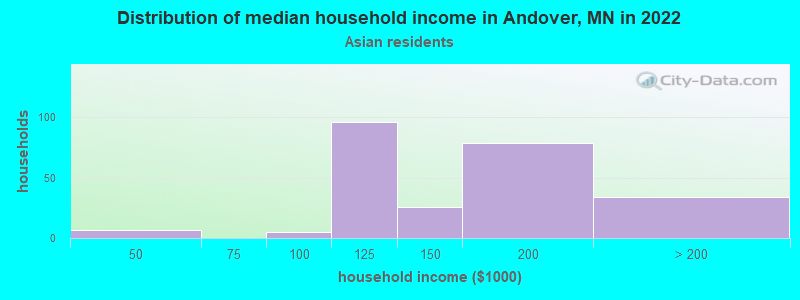
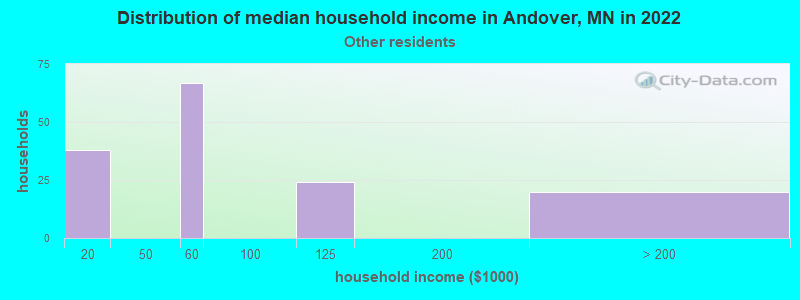
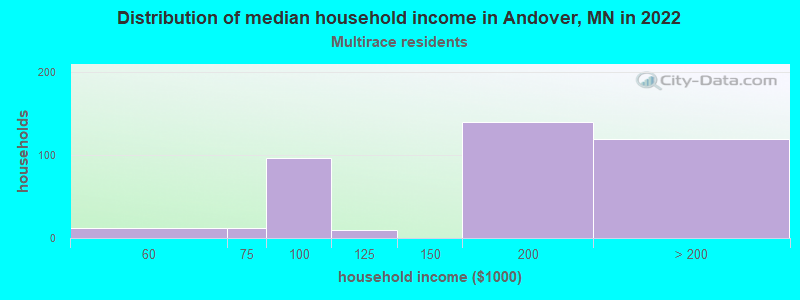
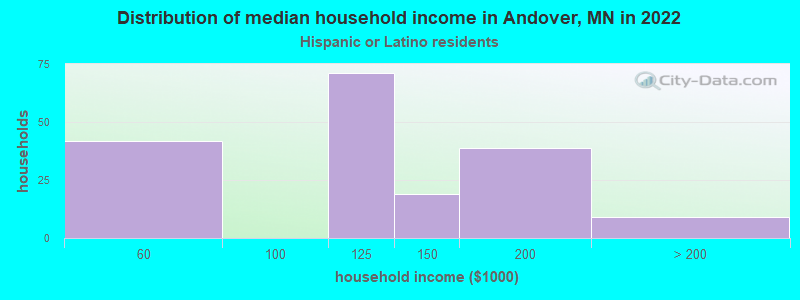
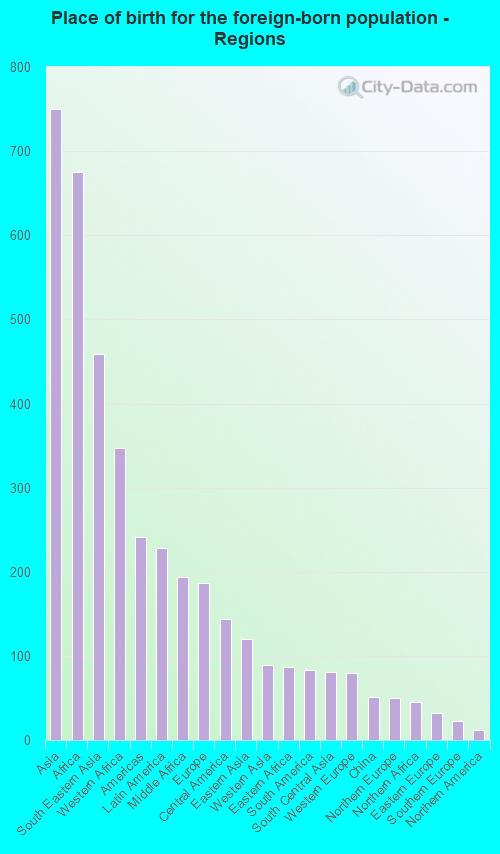
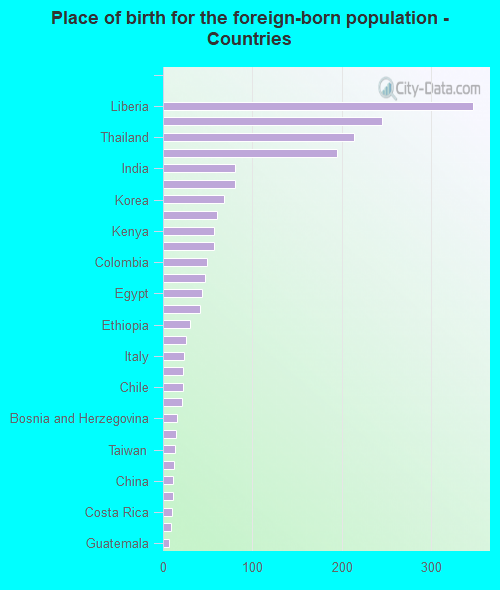
According to 2022 data, the most numerous races in Andover, MN are White alone (27,311 residents), Black alone (1,423 residents), and Hispanic (817 residents). 90.9% of Andover residents speak English at home. 5.6% of Andover, MN residents are foreign-born (2.2% born in Asia, 2.0% born in Africa, 0.7% born in Latin America), which is 42.7% less than the foreign-born rate of 8.0% across the entire state of Minnesota.
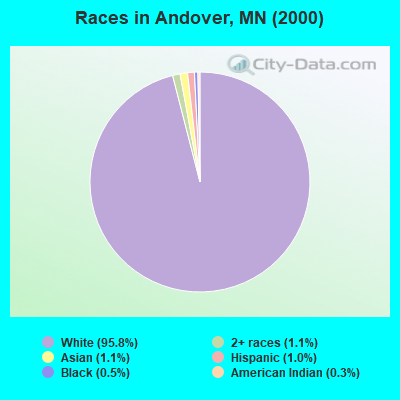
Race distribution in Andover
2000 2022
4,337,143 88.2% White alone 168,813 3.4% Black alone 143,382 2.9% Hispanic 141,083 2.9% Asian alone 70,304 1.4% Two or more races 52,009 1.1% American Indian alone 5,031 0.1% Other race alone 1,714 0.03% Native Hawaiian and Other
4,356,347 76.2% White alone 395,179 6.9% Black alone 333,830 5.8% Hispanic 294,800 5.2% Asian alone 259,649 4.5% Two or more races 42,125 0.7% American Indian alone 32,976 0.6% Other race alone 2,278 0.04% Native Hawaiian and Other
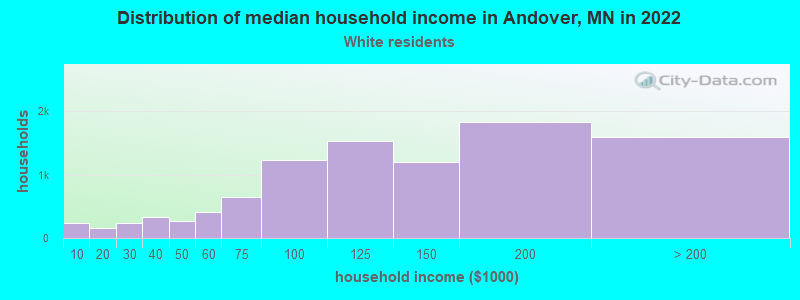
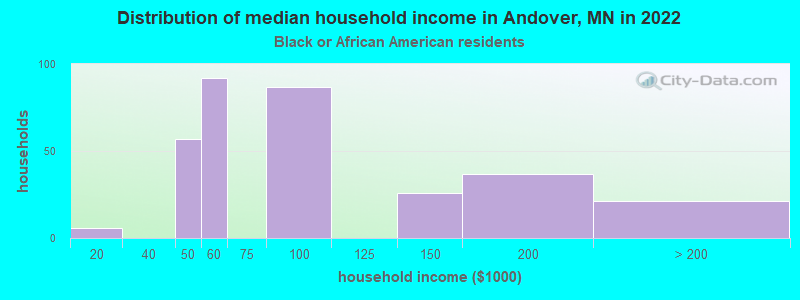
Income and house value in Andover Median household income in 2022 $120,327 White non-Hispanic householders$85,360 Black householders$150,458 Asian householders$55,708 Some other race householders$175,184 Two or more races householders$110,505 Hispanic or Latino race householdersMedian 2022 house value $411,199 White Non-Hispanic householders$289,667 Black or African American householders$242,548 American Indian or Alaska Native householders $364,852 Asian householders$218,860 Some other race householders$356,355 Two or more races householders$326,487 Hispanic or Latino householders
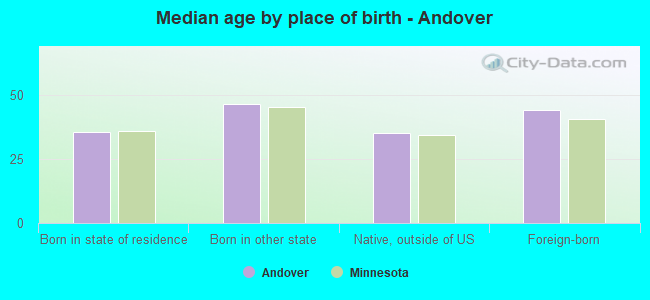
Median age by race in Andover
41.6 Median age for White residents40.8 42.1 29.1 Median age for Black or African American residents30.0 25.1 39.8 Median age for American Indian / Alaska Native residents22.7 45.9 30.4 Median age for Asian residents29.4 30.2 -670,553,935.2 Median age for Native Hawaiian / Pacific Islander residents-670,553,935.2 -534,959,349.1 25.3 Median age for Other race residents31.0 19.3 23.6 Median age for Two or more races residents31.0 20.9 41.4 Median age for White alone residents41.1 41.7 31.4 Median age for Hispanic or Latino residents30.9 34.7
Owner/renter occupied households by race in Andover
House owners and renters - White residents 9,187 93.9% Owner occupied601 6.1% Renter occupiedHouse owners and renters - Black or African American residents 274 88.8% Owner occupied35 11.2% Renter occupiedHouse owners and renters - American Indian / Alaska Native residents 3 17.6% Owner occupied16 82.4% Renter occupiedHouse owners and renters - Asian residents 270 89.6% Owner occupied31 10.4% Renter occupiedHouse owners and renters - Other race residents 195 100.0% Owner occupiedHouse owners and renters - Two or more races residents 346 93.8% Owner occupied23 6.2% Renter occupiedHouse owners and renters - White alone residents 9,191 94.1% Owner occupied577 5.9% Renter occupiedHouse owners and renters - Hispanic or Latino residents 149 81.1% Owner occupied35 18.9% Renter occupied
Language usage in Andover
English speakers - Total 90.9% of residents of Andover speak English at home.
1.5% of residents speak Spanish at home 428 91.6% Speak English very well39 8.4% Speak English less than very well6.1% of residents speak other language at home 1,241 65.7% Speak English very well648 34.3% Speak English less than very well
English speakers - Born in the United States 91.9% of residents of Andover speak English at home.
2.9% of residents speak Spanish at home 172 97.2% Speak English very well5 2.8% Speak English less than very well4.2% of residents speak other language at home 228 89.8% Speak English very well26 10.2% Speak English less than very well
English speakers - Native, born elsewhere 70.0% of residents of Andover speak English at home.
14.8% of residents speak Spanish at home 31 100.0% Speak English very well11.0% of residents speak other language at home 23 100.0% Speak English very well
English speakers - Foreign-born 30.6% of residents of Andover speak English at home.
8.1% of residents speak Spanish at home 139 83.7% Speak English very well27 16.3% Speak English less than very well61.0% of residents speak other language at home 697 55.5% Speak English very well559 44.5% Speak English less than very well
White (Caucasian) - Speak only English Native:
98.2% (24,786)Foreign-born:
42.1% (178)
White (Caucasian) - Speak another language Native:
1.6% (412)Foreign-born:
54.9% (232)
Black or African American - Speak only English Native:
88.6% (589)Foreign-born:
44.2% (290)
Black or African American - Speak another language Native:
7.4% (49)Foreign-born:
56.1% (369)
Asian - Speak only English Native:
33.2% (145)Foreign-born:
9.0% (61)
Asian - Speak another language Native:
67.9% (297)Foreign-born:
93.3% (635)
Other race - Speak only English Native:
81.6% (375)Foreign-born:
7.6% (10)
Other race - Speak another language Native:
29.4% (135)Foreign-born:
81.3% (109)
Two or more races - Speak only English Native:
99.7% (1,204)Foreign-born:
39.2% (33)
Two or more races - Speak another language Native:
2.4% (29)Foreign-born:
30.7% (26)
White alone - Speak only English Native:
98.4% (24,742)Foreign-born:
41.0% (172)
White alone - Speak another language Native:
1.4% (352)Foreign-born:
54.6% (229)
Hispanic or Latino - Speak only English Native:
54.9% (258)Foreign-born:
58.2% (160)
Hispanic or Latino - Speak another language Native:
39.2% (184)Foreign-born:
55.8% (154)
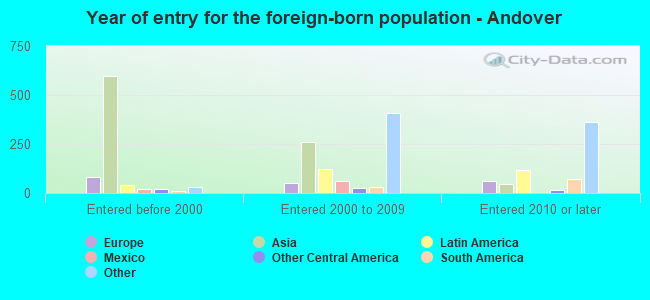
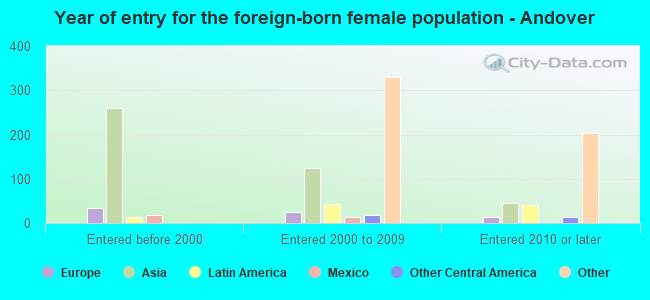
Foreign-born residents in Andover 1,854 residents are foreign born (2.2% Asia , 2.0% Africa , 0.7% Latin America ).
This city:
5.6%Minnesota:
8.5%
Marital status for residents in Andover Marital status - White (Caucasian) population 15 years and over
Males 26.2% Never married65.2% Now married0.2% Separated2.0% Widowed6.4% DivorcedFemales 20.9% Never married65.6% Now married0.3% Separated5.2% Widowed8.0% DivorcedWomen who gave birth in the past 12 months Now married:
99.5% (174)Unmarried:
0.5% (1)
Women who did not give birth in the past 12 months Now married:
55.6% (3,014)Unmarried:
44.4% (2,406)
Marital status - Black or African American population 15 years and over
Males 18.7% Never married70.2% Now married0.0% Separated0.0% Widowed11.1% DivorcedFemales 49.9% Never married50.1% Now married0.0% Separated0.0% Widowed0.0% DivorcedWomen who gave birth in the past 12 months Now married:
100.0% (7)Unmarried:
0.0% (0)
Women who did not give birth in the past 12 months Now married:
51.0% (219)Unmarried:
49.0% (211)
Marital status - American Indian / Alaska Native population 15 years and over
Males 83.8% Never married16.2% Now married0.0% Separated0.0% Widowed0.0% DivorcedFemales 59.5% Never married26.6% Now married0.0% Separated0.0% Widowed13.9% DivorcedWomen who did not give birth in the past 12 months Now married:
13.4% (9)Unmarried:
86.6% (60)
Marital status - Asian population 15 years and over
Males 37.7% Never married55.4% Now married6.9% Separated0.0% Widowed0.0% DivorcedFemales 24.7% Never married47.8% Now married3.8% Separated20.9% Widowed2.8% DivorcedWomen who gave birth in the past 12 months Now married:
100.0% (102)Unmarried:
0.0% (0)
Women who did not give birth in the past 12 months Now married:
50.0% (159)Unmarried:
50.0% (159)
Marital status - Other race population 15 years and over
Males 41.6% Never married58.4% Now married0.0% Separated0.0% Widowed0.0% DivorcedFemales 43.0% Never married29.1% Now married0.0% Separated0.0% Widowed27.9% DivorcedWomen who gave birth in the past 12 months Now married:
100.0% (36)Unmarried:
0.0% (0)
Women who did not give birth in the past 12 months Now married:
11.9% (9)Unmarried:
88.1% (66)
Marital status - Two or more races population 15 years and over
Males 60.9% Never married32.0% Now married4.5% Separated2.5% Widowed0.0% DivorcedFemales 55.9% Never married30.0% Now married2.0% Separated9.5% Widowed2.6% DivorcedWomen who did not give birth in the past 12 months Now married:
19.8% (69)Unmarried:
80.2% (281)
Marital status - White alone, not Hispanic / Latino population 15 years and over
Males 26.3% Never married65.5% Now married0.2% Separated1.8% Widowed6.2% DivorcedFemales 20.7% Never married65.6% Now married0.3% Separated5.3% Widowed8.1% DivorcedWomen who gave birth in the past 12 months Now married:
99.5% (177)Unmarried:
0.5% (1)
Women who did not give birth in the past 12 months Now married:
56.0% (3,050)Unmarried:
44.0% (2,401)
Marital status - Hispanic or Latino population 15 years and over
Males 33.4% Never married41.8% Now married5.0% Separated9.0% Widowed10.8% DivorcedFemales 29.9% Never married61.2% Now married0.0% Separated8.9% Widowed0.0% DivorcedWomen who gave birth in the past 12 months Now married:
100.0% (22)Unmarried:
0.0% (0)
Women who did not give birth in the past 12 months Now married:
42.9% (53)Unmarried:
57.1% (71)
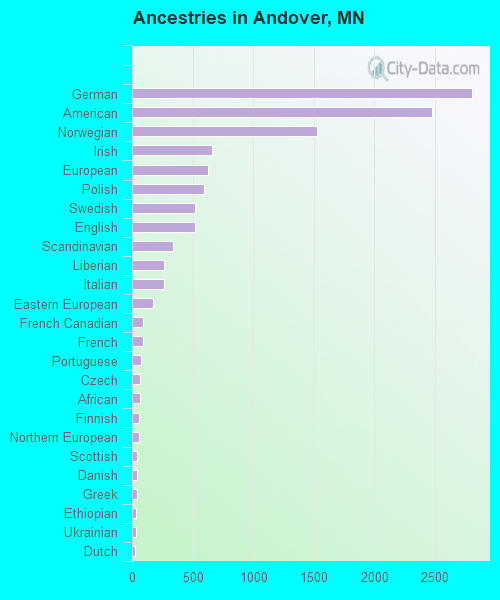
Ancestries in Andover
2,807 20.1% German2,473 17.7% American1,531 11.0% Norwegian661 4.7% Irish627 4.5% European595 4.3% Polish520 3.7% Swedish516 3.7% English335 2.4% Scandinavian262 1.9% Liberian261 1.9% Italian175 1.3% Eastern European94 0.7% French Canadian88 0.6% French72 0.5% Portuguese63 0.5% Czech63 0.5% African61 0.4% Finnish61 0.4% Northern European45 0.3% Scottish38 0.3% Danish38 0.3% Greek34 0.2% Ethiopian34 0.2% Ukrainian28 0.2% Dutch21 0.2% Egyptian20 0.1% Russian20 0.1% Kenyan18 0.1% Slovak15 0.1% Yugoslavian10 0.07% Czechoslovakian10 0.07% Scotch-Irish10 0.07% Slovene10 0.07% Welsh8 0.06% Syrian8 0.06% Luxembourger7 0.05% Lithuanian5 0.04% Brazilian1 0.01% Sudanese
Geographical mobility in Andover Same house 1 year ago 25,493 93.9% White (Caucasian)1,326 94.2% Black or African American113 87.0% American Indian / Alaska Native1,137 99.8% Asian5 100.0% Native Hawaiian / Pacific Islander611 99.8% Other race1,172 79.5% Two or more races25,441 93.8% White alone, not Hispanic / Latino687 86.8% Hispanic or LatinoMoved within same county 853 3.1% White / Caucasian7 0.6% Asian86 5.9% Two or more races870 3.2% White alone, not Hispanic / Latino59 7.5% Hispanic or LatinoMoved within same state 378 1.4% White / Caucasian97 6.9% Black or African American6 0.5% Asian99 6.7% Two or more races386 1.4% White alone, not Hispanic / Latino15 1.9% Hispanic or LatinoMoved from different state 278 1.0% White / Caucasian13 0.9% Black or African American16 12.4% American Indian / Alaska Native20 1.4% Two or more races258 1.0% White alone, not Hispanic / Latino28 3.6% Hispanic or LatinoMoved from abroad 91 0.3% White91 0.3% White alone, not Hispanic / Latino
Children Nativity (place of birth) in Andover
Children under 6 years - Living with two parents Both parents native 1,682 100.0% NativeBoth parents foreign-born 217 100.0% NativeOne native, one foreign-born parent 34 100.0% NativeChildren under 6 years - Living with one parent Native parent 705 100.0% NativeForeign-born parent 157 100.0% NativeChildren 6 to 17 years - Living with two parents Both parents native 3,518 99.5% Native17 0.5% Foreign-bornBoth parents foreign-born 314 75.3% Native103 24.7% Foreign-bornOne native, one foreign-born parent 238 100.0% NativeChildren 6 to 17 years - Living with one parent Native parent 905 100.0% NativeForeign-born parent 248 48.5% Native263 51.5% Foreign-born
Grandparents responsible for own grandchildren in Andover
Grandparents (30 to 59 years) White / Caucasian 39 100.0% Responsible for grandchildrenBlack or African American 97 100.0% Responsible for grandchildrenAsian 16 100.0% Responsible for grandchildrenTwo or more races 2 100.0% Not responsible for grandchildrenWhite alone, not Hispanic / Latino 39 100.0% Responsible for grandchildrenGrandparents (60 years and over) White / Caucasian 36 16.9% Responsible for grandchildren178 83.1% Not responsible for grandchildrenBlack or African American 79 100.0% Not responsible for grandchildrenAsian 97 100.0% Not responsible for grandchildrenTwo or more races 10 100.0% Not responsible for grandchildrenWhite alone, not Hispanic / Latino 36 16.9% Responsible for grandchildren178 83.1% Not responsible for grandchildren