Races in Alvin, Illinois (IL) Detailed Stats
Ancestries, Foreign-born residents, place of birth

Discuss Alvin, Illinois races on our local forum with over 2,400,000 registered users
Latest news about races in Alvin, IL collected exclusively by city-data.com from local newspapers, TV, and radio stations
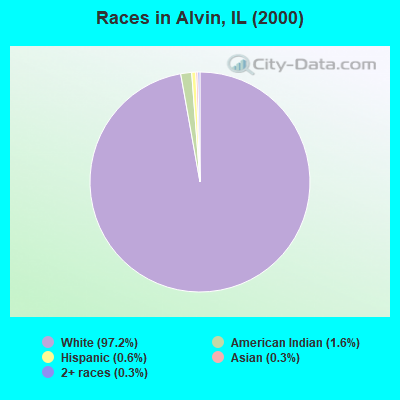
Race distribution in Alvin

- 30797.2%White alone
- 51.6%American Indian alone
- 20.6%Hispanic
- 10.3%Asian alone
- 10.3%Two or more races
2000
2022
-
- 8,424,14067.8%White alone
- 1,856,15214.9%Black alone
- 1,530,26212.3%Hispanic
- 419,9163.4%Asian alone
- 153,9961.2%Two or more races
- 13,4790.1%Other race alone
- 18,2320.1%American Indian alone
- 3,1160.03%Native Hawaiian and Other
Pacific Islander alone

-
- 7,356,30158.5%White alone
- 2,299,72618.3%Hispanic
- 1,660,42313.2%Black alone
- 747,2965.9%Asian alone
- 458,5993.6%Two or more races
- 45,3860.4%Other race alone
- 10,4050.08%American Indian alone
- 3,8960.03%Native Hawaiian and Other
Pacific Islander alone

Income and house value in Alvin
- Median household income in 2022
- $57,671White non-Hispanic householders
- Median 2022 house value
- $70,017White Non-Hispanic householders
Household income for White non-Hispanic householders

Ancestries in Alvin

- 5123.0%English
- 3917.6%Other
- 3817.1%German
- 3013.5%Irish
- 2310.4%United States
- 94.1%French
- 94.1%Scotch-Irish
- 94.1%Swedish
- 62.7%Czech
- 41.8%Dutch
- 20.9%French Canadian
- 20.9%Scottish

Zip codes: 61811.