Races in Alburg, Vermont (VT) Detailed Stats
Ancestries, Foreign-born residents, place of birth

Recent posts about races in Alburg, Vermont on our local forum with over 2,400,000 registered users:
 | Lining up a Vermont Job Before You Move (109 replies) |
According to 2022 data, the most numerous races in Alburg, VT are White alone (435 residents), Two or more races (0 residents), and Hispanic (0 residents). 95.5% of Alburg residents speak English at home. 3.4% of Alburg, VT residents are foreign-born (3.4% born in North America), which is 19.2% less than the foreign-born rate of 4.0% across the entire state of Vermont.
Race distribution in Alburg


2000
2022

- 585,43196.2%White alone
- 6,8091.1%Two or more races
- 5,5040.9%Hispanic
- 5,1600.8%Asian alone
- 2,9210.5%Black alone
- 2,3250.4%American Indian alone
- 5570.09%Other race alone
- 1200.02%Native Hawaiian and Other
Pacific Islander alone

-
- 583,54690.2%White alone
- 27,3404.2%Two or more races
- 14,7702.3%Hispanic
- 11,5121.8%Asian alone
- 6,2641.0%Black alone
- 2,5210.4%Other race alone
- 1,0520.2%American Indian alone
- 590.01%Native Hawaiian and Other
Pacific Islander alone

Income and house value in Alburg
- Median household income in 2022
- $58,239White non-Hispanic householders
- $76,150American Indian and Alaska Native householders
- $50,097Two or more races householders
- Median 2022 house value
- $245,406White Non-Hispanic householders
- $175,764American Indian or Alaska Native householders
- $226,112Two or more races householders
Household income for White non-Hispanic householders

Median age by race in Alburg
- 50.7Median age for White residents
- 44.3Males
- 52.0Females
- 55.5Median age for American Indian / Alaska Native residents
- 51.0Median age for White alone residents
- 44.2Males
- 52.3Females
Owner/renter occupied households by race in Alburg
- House owners and renters - White residents
- 13867.5%Owner occupied
- 6632.5%Renter occupied
- House owners and renters - American Indian / Alaska Native residents
- 6100.0%Renter occupied
- House owners and renters - White alone residents
- 13867.5%Owner occupied
- 6632.5%Renter occupied
Language usage in Alburg
- English speakers - Total
- 95.5% of residents of Alburg speak English at home.
- 4.1% of residents speak other language at home
- 19100.0%Speak English very well
All residents speak only English at home
All residents speak only English at home
- English speakers - Foreign-born
- 22.2% of residents of Alburg speak English at home.
- 83.3% of residents speak other language at home
- 15100.0%Speak English very well
White (Caucasian) - Speak only English
| Native: | 98.9% (401) |
| Foreign-born: | 27.2% (4) |
White (Caucasian) - Speak another language
| Native: | 1.1% (5) |
| Foreign-born: | 69.1% (9) |
White alone - Speak only English
| Native: | 99.2% (400) |
| Foreign-born: | 26.4% (4) |
White alone - Speak another language
| Native: | 1.1% (4) |
| Foreign-born: | 70.3% (10) |
Foreign-born residents in Alburg
16 residents are foreign born (3.4% North America).
| This city: | 3.4% |
| Vermont: | 100.0% |


Marital status for residents in Alburg
Marital status - White (Caucasian) population 15 years and over
- Males
- 24.3%Never married
- 51.3%Now married
- 1.1%Separated
- 1.1%Widowed
- 22.2%Divorced
- Females
- 16.3%Never married
- 52.2%Now married
- 0.0%Separated
- 21.2%Widowed
- 10.3%Divorced
Women who gave birth in the past 12 months
| Now married: | 0.0% (0) |
| Unmarried: | 100.0% (4) |
Women who did not give birth in the past 12 months
| Now married: | 56.5% (46) |
| Unmarried: | 43.5% (35) |
Marital status - White alone, not Hispanic / Latino population 15 years and over
- Males
- 24.3%Never married
- 51.3%Now married
- 1.1%Separated
- 1.1%Widowed
- 22.2%Divorced
- Females
- 16.3%Never married
- 52.2%Now married
- 0.0%Separated
- 21.2%Widowed
- 10.3%Divorced
Women who gave birth in the past 12 months
| Now married: | 0.0% (0) |
| Unmarried: | 100.0% (3) |
Women who did not give birth in the past 12 months
| Now married: | 56.5% (45) |
| Unmarried: | 43.5% (35) |
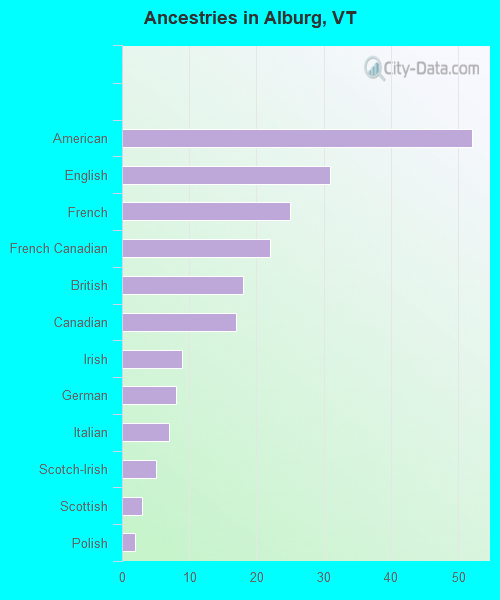
Ancestries in Alburg

- 5217.1%American
- 3110.2%English
- 258.2%French
- 227.2%French Canadian
- 185.9%British
- 175.6%Canadian
- 93.0%Irish
- 82.6%German
- 72.3%Italian
- 51.6%Scotch-Irish
- 31.0%Scottish
- 20.7%Polish
Geographical mobility in Alburg

- Same house 1 year ago
- 36684.2%White (Caucasian)
- 1696.9%American Indian / Alaska Native
- 36584.2%White alone, not Hispanic / Latino

-
- Moved within same county
- 204.7%White / Caucasian
- 214.7%White alone, not Hispanic / Latino

-
- Moved within same state
- 327.4%White / Caucasian
- 327.4%White alone, not Hispanic / Latino

-
- Moved from different state
- 112.5%White / Caucasian
- 528.2%American Indian / Alaska Native
- 112.5%White alone, not Hispanic / Latino

Children Nativity (place of birth) in Alburg
Place of birth for residents in Alburg
![Place of birth for the foreign-born population - Regions]()
- 16Americas
- 16Northern America

Grandparents responsible for own grandchildren in Alburg
Zip codes: 05440.