Races in Albert Lea, Minnesota (MN) Detailed Stats
Data:
Races - White alone (%)
Races - White alone (% change since 2000)
Races - Black alone (%)
Races - Black alone (% change since 2000)
Races - American Indian alone (%)
Races - American Indian alone (% change since 2000)
Races - Asian alone (%)
Races - Asian alone (% change since 2000)
Races - Hispanic (%)
Races - Hispanic (% change since 2000)
Races - Native Hawaiian and Other Pacific Islander alone (%)
Races - Native Hawaiian and Other Pacific Islander alone (% change since 2000)
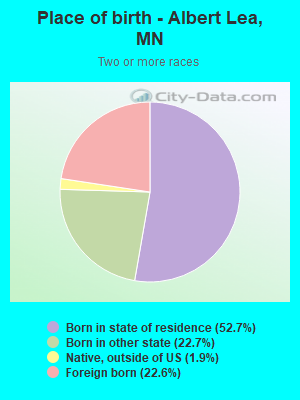
Races - Two or more races(%)
Races - Two or more races(% change since 2000)
Races - Other race alone (%)
Races - Other race alone (% change since 2000)
Racial diversity
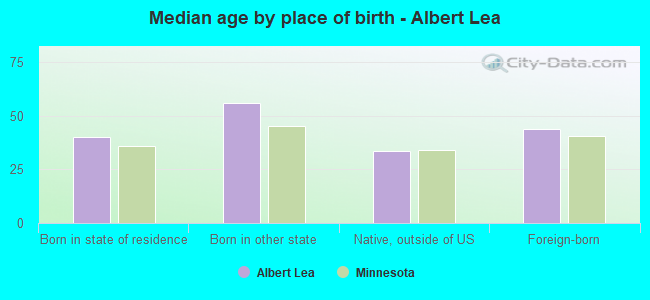
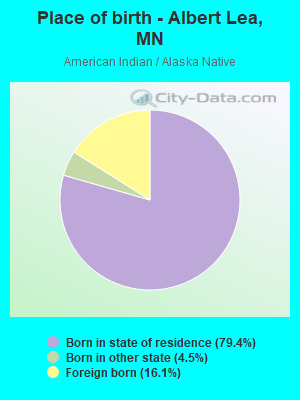
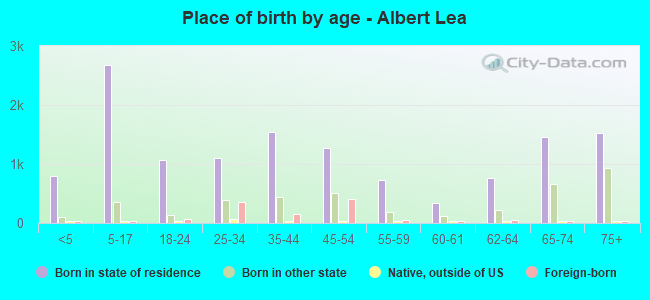
Place of birth - Born in state of residence (%)
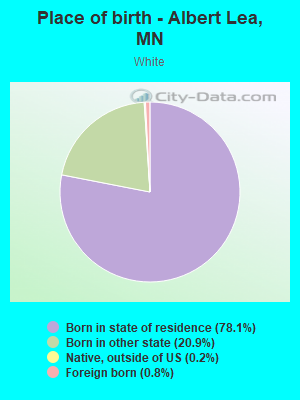
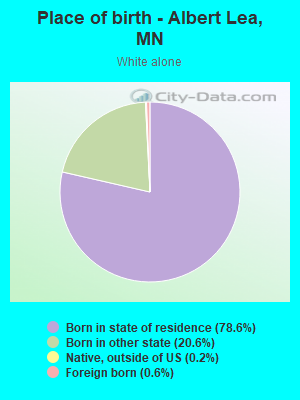
Place of birth - Born in state of residence (%) - White
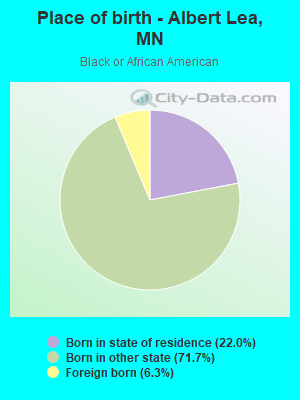
Place of birth - Born in state of residence (%) - Black or African American
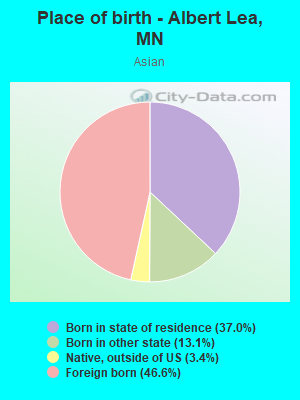
Place of birth - Born in state of residence (%) - Asian
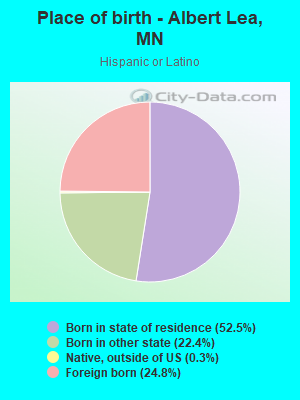
Place of birth - Born in state of residence (%) - Hispanic or Latino
Place of birth - Born in state of residence (%) - American Indian and Alaska Native
Place of birth - Born in state of residence (%) - Multirace
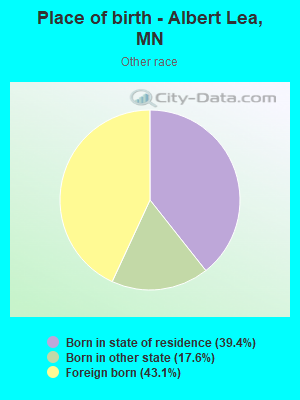
Place of birth - Born in state of residence (%) - Other Race
Place of birth - Born in other state (%)
Place of birth - Born in other state (%) - White
Place of birth - Born in other state (%) - Black or African American
Place of birth - Born in other state (%) - Asian
Place of birth - Born in other state (%) - Hispanic or Latino
Place of birth - Born in other state (%) - American Indian and Alaska Native
Place of birth - Born in other state (%) - Multirace
Place of birth - Born in other state (%) - Other Race
Place of birth - Native, outside of US (%)
Place of birth - Native, outside of US (%) - White
Place of birth - Native, outside of US (%) - Black or African American
Place of birth - Native, outside of US (%) - Asian
Place of birth - Native, outside of US (%) - Hispanic or Latino
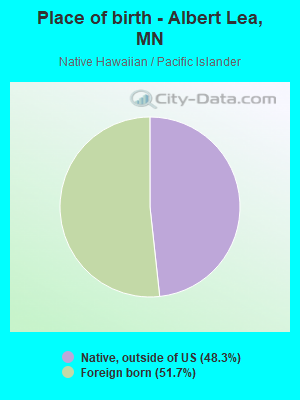
Place of birth - Native, outside of US (%) - American Indian and Alaska Native
Place of birth - Native, outside of US (%) - Multirace
Place of birth - Native, outside of US (%) - Other Race
Place of birth - Foreign born (%)
Place of birth - Foreign born (%) - White
Place of birth - Foreign born (%) - Black or African American
Place of birth - Foreign born (%) - Asian
Place of birth - Foreign born (%) - Hispanic or Latino
Place of birth - Foreign born (%) - American Indian and Alaska Native
Place of birth - Foreign born (%) - Multirace
Place of birth - Foreign born (%) - Other Race
Residents speaking English at home (%)
Residents speaking English at home - Born in the United States (%)
Residents speaking English at home - Native, born elsewhere (%)
Residents speaking English at home - Foreign born (%)
Residents speaking Spanish at home (%)
Residents speaking Spanish at home - Born in the United States (%)
Residents speaking Spanish at home - Native, born elsewhere (%)
Residents speaking Spanish at home - Foreign born (%)
Residents speaking other language at home (%)
Residents speaking other language at home - Born in the United States (%)
Residents speaking other language at home - Native, born elsewhere (%)
Residents speaking other language at home - Foreign born (%)
Marital status - Never married (%)
Marital status - Now married (%)
Marital status - Separated (%)
Marital status - Widowed (%)
Marital status - Divorced (%)
Ancestries Reported - Arab (%)
Ancestries Reported - Czech (%)
Ancestries Reported - Danish (%)
Ancestries Reported - Dutch (%)
Ancestries Reported - English (%)
Ancestries Reported - French (%)
Ancestries Reported - French Canadian (%)
Ancestries Reported - German (%)
Ancestries Reported - Greek (%)
Ancestries Reported - Hungarian (%)
Ancestries Reported - Irish (%)
Ancestries Reported - Italian (%)
Ancestries Reported - Lithuanian (%)
Ancestries Reported - Norwegian (%)
Ancestries Reported - Polish (%)
Ancestries Reported - Portuguese (%)
Ancestries Reported - Russian (%)
Ancestries Reported - Scotch-Irish (%)
Ancestries Reported - Scottish (%)
Ancestries Reported - Slovak (%)
Ancestries Reported - Subsaharan African (%)
Ancestries Reported - Swedish (%)
Ancestries Reported - Swiss (%)
Ancestries Reported - Ukrainian (%)
Ancestries Reported - United States (%)
Ancestries Reported - Welsh (%)
Ancestries Reported - West Indian (%)
Ancestries Reported - Other (%)
Geographical mobility - Same house 1 year ago (%)
Geographical mobility - Same house 1 year ago (%) - White
Geographical mobility - Same house 1 year ago (%) - Black or African American
Geographical mobility - Same house 1 year ago (%) - Asian
Geographical mobility - Same house 1 year ago (%) - Hispanic or Latino
Geographical mobility - Same house 1 year ago (%) - American Indian and Alaska Native
Geographical mobility - Same house 1 year ago (%) - Multirace
Geographical mobility - Same house 1 year ago (%) - Other Race
Geographical mobility - Moved within same county (%)
Geographical mobility - Moved within same county (%) - White
Geographical mobility - Moved within same county (%) - Black or African American
Geographical mobility - Moved within same county (%) - Asian
Geographical mobility - Moved within same county (%) - Hispanic or Latino
Geographical mobility - Moved within same county (%) - American Indian and Alaska Native
Geographical mobility - Moved within same county (%) - Multirace
Geographical mobility - Moved within same county (%) - Other Race
Geographical mobility - Moved from different county within same state (%)
Geographical mobility - Moved from different county within same state (%) - White
Geographical mobility - Moved from different county within same state (%) - Black or African American
Geographical mobility - Moved from different county within same state (%) - Asian
Geographical mobility - Moved from different county within same state (%) - Hispanic or Latino
Geographical mobility - Moved from different county within same state (%) - American Indian and Alaska Native
Geographical mobility - Moved from different county within same state (%) - Multirace
Geographical mobility - Moved from different county within same state (%) - Other Race
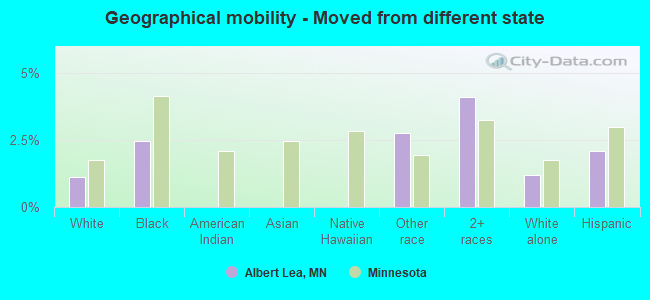
Geographical mobility - Moved from different state (%)
Geographical mobility - Moved from different state (%) - White
Geographical mobility - Moved from different state (%) - Black or African American
Geographical mobility - Moved from different state (%) - Asian
Geographical mobility - Moved from different state (%) - Hispanic or Latino
Geographical mobility - Moved from different state (%) - American Indian and Alaska Native
Geographical mobility - Moved from different state (%) - Multirace
Geographical mobility - Moved from different state (%) - Other Race
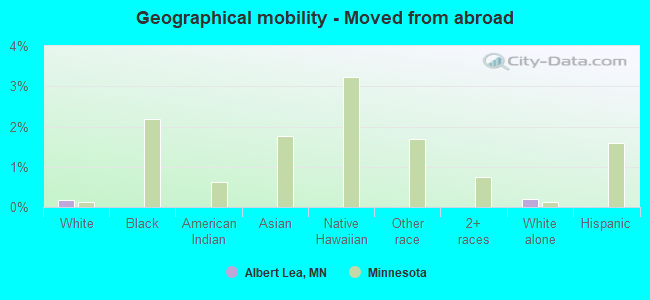
Geographical mobility - Moved from abroad (%)
Geographical mobility - Moved from abroad (%) - White
Geographical mobility - Moved from abroad (%) - Black or African American
Geographical mobility - Moved from abroad (%) - Asian
Geographical mobility - Moved from abroad (%) - Hispanic or Latino
Geographical mobility - Moved from abroad (%) - American Indian and Alaska Native
Geographical mobility - Moved from abroad (%) - Multirace
Geographical mobility - Moved from abroad (%) - Other Race
Place of birth for the foreign-born population - Ireland (%)
Place of birth for the foreign-born population - Denmark (%)
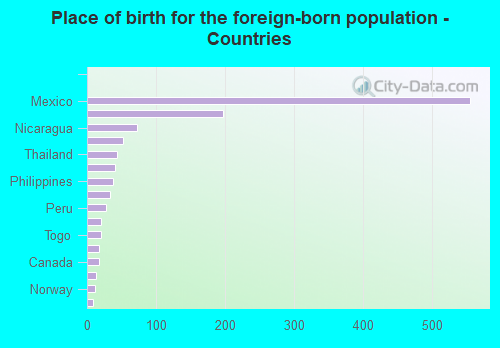
Place of birth for the foreign-born population - Norway (%)
Place of birth for the foreign-born population - Sweden (%)
Place of birth for the foreign-born population - United Kingdom (%)
Place of birth for the foreign-born population - England (%)
Place of birth for the foreign-born population - Scotland (%)
Place of birth for the foreign-born population - Other Northern Europe (%)
Place of birth for the foreign-born population - Austria (%)
Place of birth for the foreign-born population - Belgium (%)
Place of birth for the foreign-born population - France (%)
Place of birth for the foreign-born population - Germany (%)
Place of birth for the foreign-born population - Netherlands (%)
Place of birth for the foreign-born population - Switzerland (%)
Place of birth for the foreign-born population - Other Western Europe (%)
Place of birth for the foreign-born population - Greece (%)
Place of birth for the foreign-born population - Italy (%)
Place of birth for the foreign-born population - Portugal (%)
Place of birth for the foreign-born population - Spain (%)
Place of birth for the foreign-born population - Other Southern Europe (%)
Place of birth for the foreign-born population - Albania (%)
Place of birth for the foreign-born population - Belarus (%)
Place of birth for the foreign-born population - Bosnia and Herzegovina (%)
Place of birth for the foreign-born population - Bulgaria (%)
Place of birth for the foreign-born population - Croatia (%)
Place of birth for the foreign-born population - Czechoslovakia (%)
Place of birth for the foreign-born population - Hungary (%)
Place of birth for the foreign-born population - Latvia (%)
Place of birth for the foreign-born population - Lithuania (%)
Place of birth for the foreign-born population - North Macedonia (Macedonia) (%)
Place of birth for the foreign-born population - Moldova (%)
Place of birth for the foreign-born population - Poland (%)
Place of birth for the foreign-born population - Romania (%)
Place of birth for the foreign-born population - Russia (%)
Place of birth for the foreign-born population - Serbia (%)
Place of birth for the foreign-born population - Ukraine (%)
Place of birth for the foreign-born population - Other Eastern Europe (%)
Place of birth for the foreign-born population - China (%)
Place of birth for the foreign-born population - Hong Kong (%)
Place of birth for the foreign-born population - Taiwan (%)
Place of birth for the foreign-born population - Japan (%)
Place of birth for the foreign-born population - Korea (%)
Place of birth for the foreign-born population - Other Eastern Asia (%)
Place of birth for the foreign-born population - Afghanistan (%)
Place of birth for the foreign-born population - Bangladesh (%)
Place of birth for the foreign-born population - India (%)
Place of birth for the foreign-born population - Iran (%)
Place of birth for the foreign-born population - Kazakhstan (%)
Place of birth for the foreign-born population - Nepal (%)
Place of birth for the foreign-born population - Pakistan (%)
Place of birth for the foreign-born population - Sri Lanka (%)
Place of birth for the foreign-born population - Uzbekistan (%)
Place of birth for the foreign-born population - Other South Central Asia (%)
Place of birth for the foreign-born population - Burma (%)
Place of birth for the foreign-born population - Cambodia (%)
Place of birth for the foreign-born population - Indonesia (%)
Place of birth for the foreign-born population - Laos (%)
Place of birth for the foreign-born population - Malaysia (%)
Place of birth for the foreign-born population - Philippines (%)
Place of birth for the foreign-born population - Singapore (%)
Place of birth for the foreign-born population - Thailand (%)
Place of birth for the foreign-born population - Vietnam (%)
Place of birth for the foreign-born population - Other South Eastern Asia (%)
Place of birth for the foreign-born population - Armenia (%)
Place of birth for the foreign-born population - Iraq (%)
Place of birth for the foreign-born population - Israel (%)
Place of birth for the foreign-born population - Jordan (%)
Place of birth for the foreign-born population - Kuwait (%)
Place of birth for the foreign-born population - Lebanon (%)
Place of birth for the foreign-born population - Saudi Arabia (%)
Place of birth for the foreign-born population - Syria (%)
Place of birth for the foreign-born population - Turkey (%)
Place of birth for the foreign-born population - Yemen (%)
Place of birth for the foreign-born population - Other Western Asia (%)
Place of birth for the foreign-born population - Eritrea (%)
Place of birth for the foreign-born population - Ethiopia (%)
Place of birth for the foreign-born population - Kenya (%)
Place of birth for the foreign-born population - Somalia (%)
Place of birth for the foreign-born population - Uganda (%)
Place of birth for the foreign-born population - Zimbabwe (%)
Place of birth for the foreign-born population - Other Eastern Africa (%)
Place of birth for the foreign-born population - Cameroon (%)
Place of birth for the foreign-born population - Congo (%)
Place of birth for the foreign-born population - Democratic Republic of Congo (Zaire) (%)
Place of birth for the foreign-born population - Other Middle Africa (%)
Place of birth for the foreign-born population - Egypt (%)
Place of birth for the foreign-born population - Morocco (%)
Place of birth for the foreign-born population - Sudan (%)
Place of birth for the foreign-born population - Other Northern Africa (%)
Place of birth for the foreign-born population - South Africa (%)
Place of birth for the foreign-born population - Other Southern Africa (%)
Place of birth for the foreign-born population - Cabo Verde (%)
Place of birth for the foreign-born population - Ghana (%)
Place of birth for the foreign-born population - Liberia (%)
Place of birth for the foreign-born population - Nigeria (%)
Place of birth for the foreign-born population - Senegal (%)
Place of birth for the foreign-born population - Sierra Leone (%)
Place of birth for the foreign-born population - Other Western Africa (%)
Place of birth for the foreign-born population - Australia (%)
Place of birth for the foreign-born population - New Zealand (%)
Place of birth for the foreign-born population - Fiji (%)
Place of birth for the foreign-born population - Micronesia (%)
Place of birth for the foreign-born population - Bahamas (%)
Place of birth for the foreign-born population - Barbados (%)
Place of birth for the foreign-born population - Cuba (%)
Place of birth for the foreign-born population - Dominica (%)
Place of birth for the foreign-born population - Dominican Republic (%)
Place of birth for the foreign-born population - Grenada (%)
Place of birth for the foreign-born population - Haiti (%)
Place of birth for the foreign-born population - Jamaica (%)
Place of birth for the foreign-born population - St. Vincent and the Grenadines (%)
Place of birth for the foreign-born population - Trinidad and Tobago (%)
Place of birth for the foreign-born population - West Indies (%)
Place of birth for the foreign-born population - Other Caribbean (%)
Place of birth for the foreign-born population - Belize (%)
Place of birth for the foreign-born population - Costa Rica (%)
Place of birth for the foreign-born population - El Salvador (%)
Place of birth for the foreign-born population - Guatemala (%)
Place of birth for the foreign-born population - Honduras (%)
Place of birth for the foreign-born population - Mexico (%)
Place of birth for the foreign-born population - Nicaragua (%)
Place of birth for the foreign-born population - Panama (%)
Place of birth for the foreign-born population - Other Central America (%)
Place of birth for the foreign-born population - Argentina (%)
Place of birth for the foreign-born population - Bolivia (%)
Place of birth for the foreign-born population - Brazil (%)
Place of birth for the foreign-born population - Chile (%)
Place of birth for the foreign-born population - Colombia (%)
Place of birth for the foreign-born population - Ecuador (%)
Place of birth for the foreign-born population - Guyana (%)
Place of birth for the foreign-born population - Peru (%)
Place of birth for the foreign-born population - Uruguay (%)
Place of birth for the foreign-born population - Venezuela (%)
Place of birth for the foreign-born population - Other South America (%)
Place of birth for the foreign-born population - Canada (%)
Place of birth for the foreign-born population - Other Northern America (%)
Place of birth for the foreign-born population - Other (%)
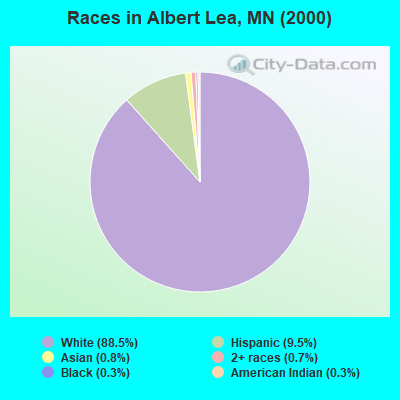
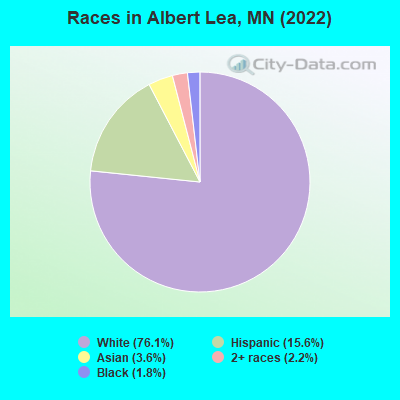
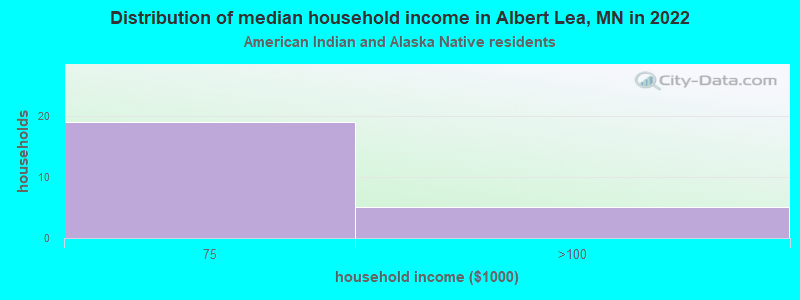
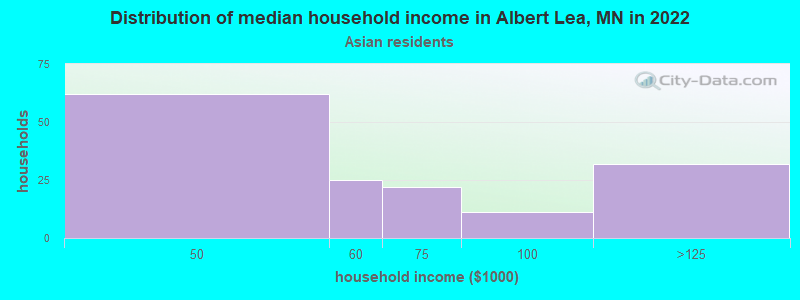
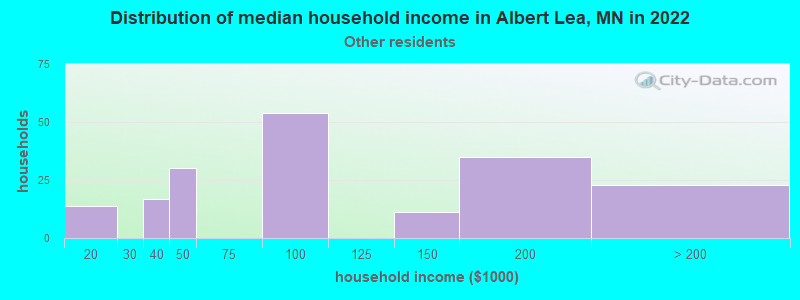
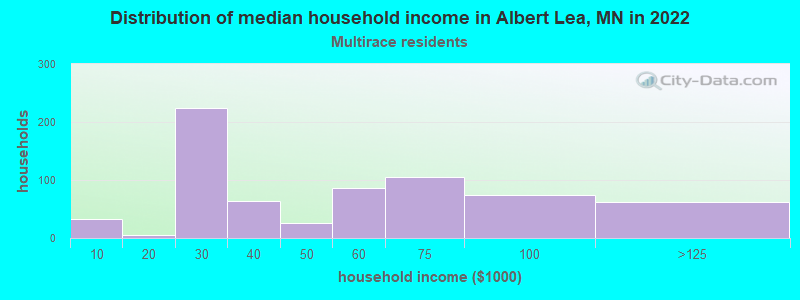
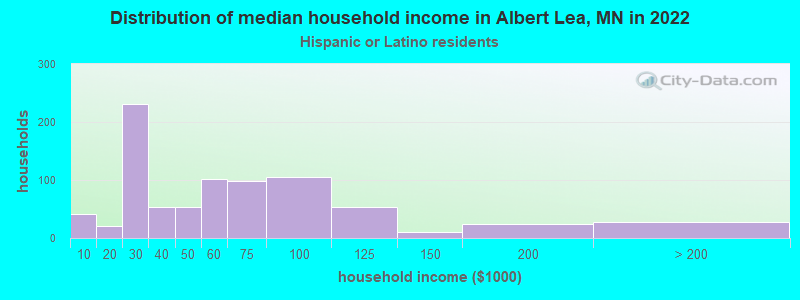
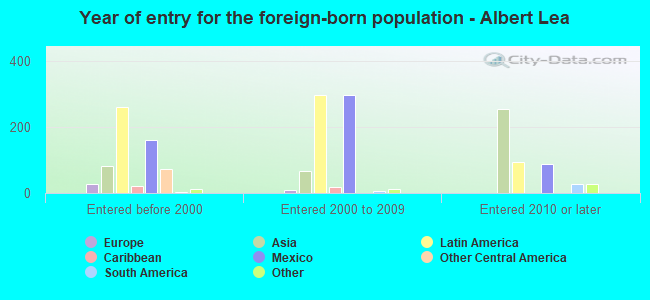
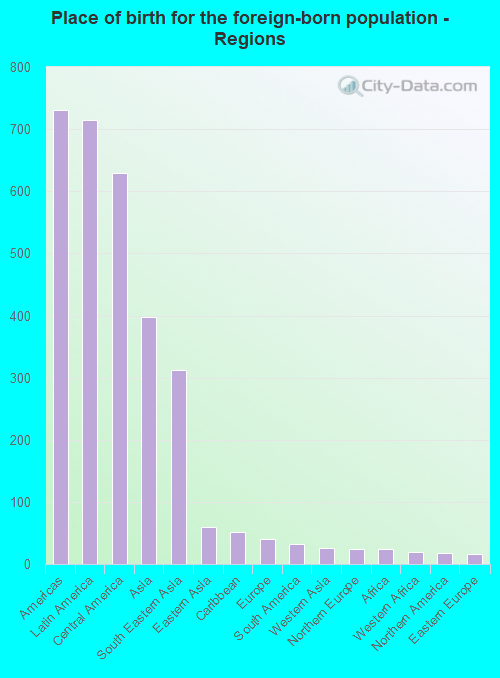
According to 2022 data, the most numerous races in Albert Lea, MN are White alone (14,084 residents), Black alone (327 residents), and Hispanic (2,881 residents). 87.6% of Albert Lea residents speak English at home. 6.5% of Albert Lea, MN residents are foreign-born (3.7% born in Latin America, 2.1% born in Asia), which is 23.2% less than the foreign-born rate of 8.0% across the entire state of Minnesota.
Race distribution in Albert Lea
2000 2022
4,337,143 88.2% White alone 168,813 3.4% Black alone 143,382 2.9% Hispanic 141,083 2.9% Asian alone 70,304 1.4% Two or more races 52,009 1.1% American Indian alone 5,031 0.1% Other race alone 1,714 0.03% Native Hawaiian and Other
4,356,347 76.2% White alone 395,179 6.9% Black alone 333,830 5.8% Hispanic 294,800 5.2% Asian alone 259,649 4.5% Two or more races 42,125 0.7% American Indian alone 32,976 0.6% Other race alone 2,278 0.04% Native Hawaiian and Other
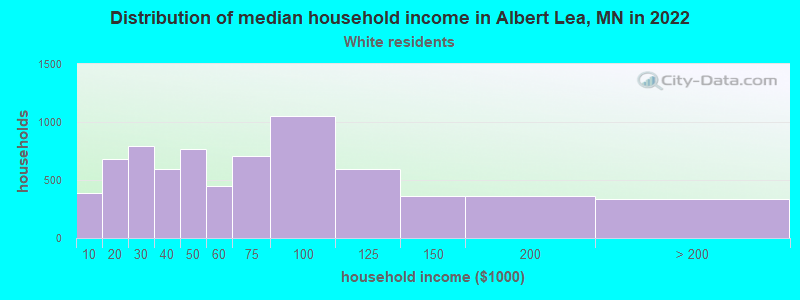
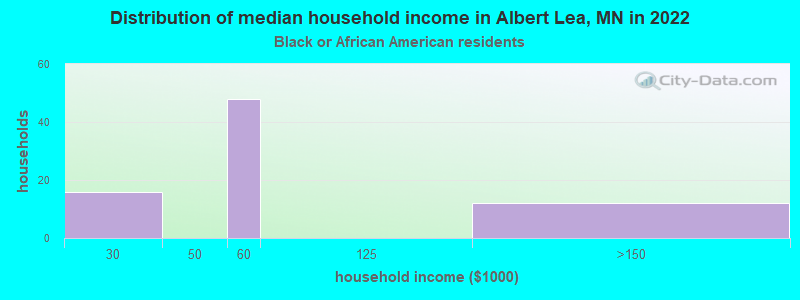
Income and house value in Albert Lea Median household income in 2022 $57,065 White non-Hispanic householders$57,555 Black householders$53,782 Asian householders$84,266 Some other race householders$51,225 Two or more races householders$47,275 Hispanic or Latino race householdersMedian 2022 house value $149,447 White Non-Hispanic householders$58,378 Black or African American householders $238,819 Asian householders$110,175 Some other race householders$116,756 Two or more races householders$111,236 Hispanic or Latino householders
Median age by race in Albert Lea
49.6 Median age for White residents47.2 52.1 42.6 Median age for Black or African American residents51.2 22.0 21.4 Median age for American Indian / Alaska Native residents32.3 18.7 26.7 Median age for Asian residents26.5 28.4 -744,336,568.8 Median age for Native Hawaiian / Pacific Islander residents-856,799,036.4 -534,959,349.1 33.8 Median age for Other race residents32.4 37.3 33.9 Median age for Two or more races residents33.2 35.1 51.7 Median age for White alone residents48.8 53.2 27.7 Median age for Hispanic or Latino residents29.0 27.4
Owner/renter occupied households by race in Albert Lea
House owners and renters - White residents 5,246 74.8% Owner occupied1,770 25.2% Renter occupiedHouse owners and renters - Black or African American residents 12 17.3% Owner occupied59 82.7% Renter occupiedHouse owners and renters - American Indian / Alaska Native residents 24 100.0% Renter occupiedHouse owners and renters - Asian residents 62 42.6% Owner occupied83 57.4% Renter occupiedHouse owners and renters - Native Hawaiian / Pacific Islander residents 23 100.0% Owner occupiedHouse owners and renters - Other race residents 129 73.2% Owner occupied47 26.8% Renter occupiedHouse owners and renters - Two or more races residents 359 52.1% Owner occupied331 47.9% Renter occupiedHouse owners and renters - White alone residents 5,114 74.6% Owner occupied1,739 25.4% Renter occupiedHouse owners and renters - Hispanic or Latino residents 440 55.2% Owner occupied357 44.8% Renter occupied
Language usage in Albert Lea
English speakers - Total 87.6% of residents of Albert Lea speak English at home.
8.8% of residents speak Spanish at home 983 63.1% Speak English very well575 36.9% Speak English less than very well3.2% of residents speak other language at home 175 30.6% Speak English very well396 69.4% Speak English less than very well
English speakers - Born in the United States 88.8% of residents of Albert Lea speak English at home.
9.9% of residents speak Spanish at home 362 95.3% Speak English very well18 4.7% Speak English less than very well0.8% of residents speak other language at home 29 100.0% Speak English very well
English speakers - Native, born elsewhere 57.4% of residents of Albert Lea speak English at home.
7.4% of residents speak Spanish at home 8 100.0% Speak English very well33.3% of residents speak other language at home 36 100.0% Speak English less than very well
English speakers - Foreign-born 12.0% of residents of Albert Lea speak English at home.
55.9% of residents speak Spanish at home 156 23.2% Speak English very well517 76.8% Speak English less than very well31.0% of residents speak other language at home 68 18.2% Speak English very well305 81.8% Speak English less than very well
White (Caucasian) - Speak only English Native:
97.5% (13,599)Foreign-born:
43.2% (51)
White (Caucasian) - Speak another language Native:
2.4% (330)Foreign-born:
57.7% (68)
American Indian / Alaska Native - Speak another language Native:
8.0% (4)Foreign-born:
100.0% (14)
Asian - Speak only English Native:
80.1% (241)Foreign-born:
6.6% (21)
Asian - Speak another language Native:
24.6% (74)Foreign-born:
93.8% (291)
Native Hawaiian / Pacific Islander - Speak another language Native:
84.8% (6)Foreign-born:
91.2% (11)
Other race - Speak only English Native:
54.5% (340)Foreign-born:
3.8% (17)
Other race - Speak another language Native:
45.9% (287)Foreign-born:
94.4% (433)
Two or more races - Speak only English Native:
63.7% (852)Foreign-born:
16.1% (69)
Two or more races - Speak another language Native:
35.1% (470)Foreign-born:
84.3% (363)
White alone - Speak only English Native:
98.7% (13,301)Foreign-born:
53.0% (46)
White alone - Speak another language Native:
1.3% (179)Foreign-born:
47.9% (41)
Hispanic or Latino - Speak only English Native:
57.3% (1,105)Foreign-born:
3.7% (26)
Hispanic or Latino - Speak another language Native:
42.7% (823)Foreign-born:
94.1% (668)
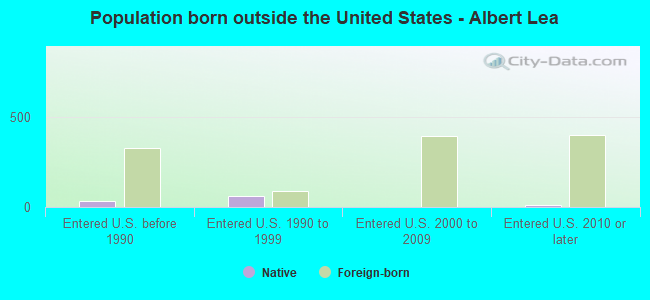
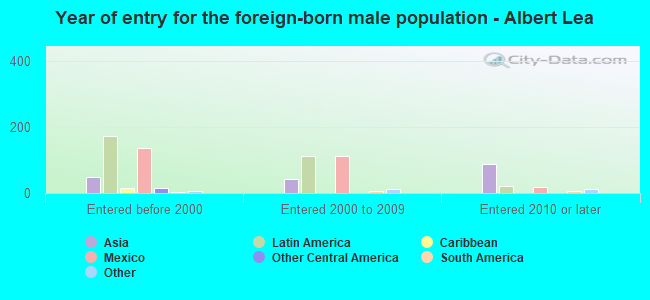
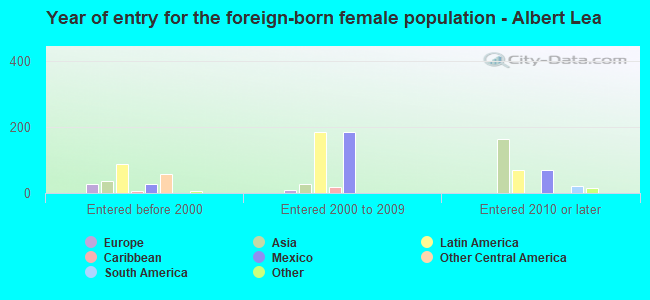
Foreign-born residents in Albert Lea 1,202 residents are foreign born (3.7% Latin America , 2.1% Asia ).
This city:
6.5%Minnesota:
8.5%
Marital status for residents in Albert Lea Marital status - White (Caucasian) population 15 years and over
Males 33.7% Never married47.1% Now married0.8% Separated5.0% Widowed13.4% DivorcedFemales 24.1% Never married42.3% Now married0.7% Separated19.8% Widowed13.2% DivorcedWomen who gave birth in the past 12 months Now married:
39.7% (48)Unmarried:
60.3% (73)
Women who did not give birth in the past 12 months Now married:
35.2% (855)Unmarried:
64.8% (1,572)
Marital status - Black or African American population 15 years and over
Males 28.2% Never married22.7% Now married49.1% Separated0.0% Widowed0.0% DivorcedFemales 79.6% Never married20.4% Now married0.0% Separated0.0% Widowed0.0% DivorcedWomen who did not give birth in the past 12 months Now married:
11.3% (11)Unmarried:
88.7% (89)
Marital status - American Indian / Alaska Native population 15 years and over
Males 37.5% Never married41.7% Now married0.0% Separated0.0% Widowed20.8% DivorcedFemales 88.6% Never married11.4% Now married0.0% Separated0.0% Widowed0.0% DivorcedWomen who gave birth in the past 12 months Now married:
100.0% (4)Unmarried:
0.0% (0)
Women who did not give birth in the past 12 months Now married:
0.0% (0)Unmarried:
100.0% (32)
Marital status - Asian population 15 years and over
Males 51.3% Never married48.8% Now married0.0% Separated0.0% Widowed0.0% DivorcedFemales 33.2% Never married47.4% Now married13.0% Separated6.5% Widowed0.0% DivorcedWomen who gave birth in the past 12 months Now married:
38.5% (31)Unmarried:
61.5% (49)
Women who did not give birth in the past 12 months Now married:
66.9% (104)Unmarried:
33.1% (51)
Marital status - Native Hawaiian / Pacific Islander population 15 years and over
Males 0.0% Never married100.0% Now married0.0% Separated0.0% Widowed0.0% DivorcedFemales 0.0% Never married0.0% Now married0.0% Separated100.0% Widowed0.0% DivorcedMarital status - Other race population 15 years and over
Males 47.4% Never married45.4% Now married4.0% Separated0.0% Widowed3.1% DivorcedFemales 52.7% Never married32.0% Now married8.9% Separated6.5% Widowed0.0% DivorcedWomen who gave birth in the past 12 months Now married:
0.0% (0)Unmarried:
100.0% (12)
Women who did not give birth in the past 12 months Now married:
37.2% (131)Unmarried:
62.8% (221)
Marital status - Two or more races population 15 years and over
Males 46.4% Never married28.8% Now married5.2% Separated8.2% Widowed11.4% DivorcedFemales 53.3% Never married23.3% Now married0.0% Separated0.0% Widowed23.3% DivorcedWomen who gave birth in the past 12 months Now married:
100.0% (20)Unmarried:
0.0% (0)
Women who did not give birth in the past 12 months Now married:
17.5% (82)Unmarried:
82.5% (386)
Marital status - White alone, not Hispanic / Latino population 15 years and over
Males 32.6% Never married48.0% Now married0.7% Separated5.2% Widowed13.5% DivorcedFemales 22.9% Never married42.9% Now married0.7% Separated20.0% Widowed13.5% DivorcedWomen who gave birth in the past 12 months Now married:
44.6% (49)Unmarried:
55.4% (61)
Women who did not give birth in the past 12 months Now married:
36.3% (840)Unmarried:
63.7% (1,475)
Marital status - Hispanic or Latino population 15 years and over
Males 48.4% Never married32.9% Now married4.8% Separated4.3% Widowed9.5% DivorcedFemales 56.0% Never married26.7% Now married3.0% Separated5.4% Widowed8.9% DivorcedWomen who gave birth in the past 12 months Now married:
45.2% (20)Unmarried:
54.8% (25)
Women who did not give birth in the past 12 months Now married:
24.0% (185)Unmarried:
76.0% (587)
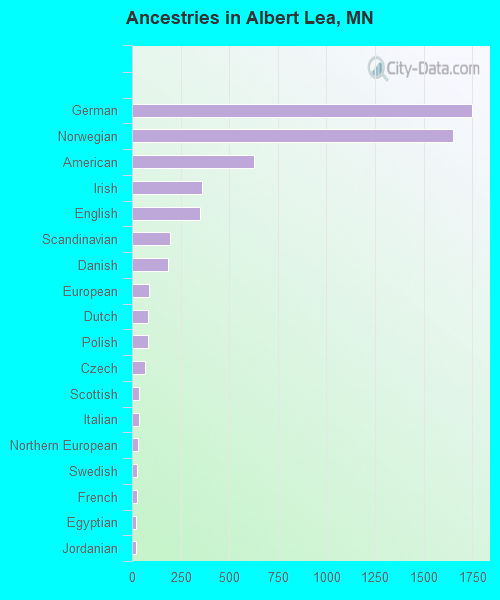
Ancestries in Albert Lea
1,749 20.5% German1,652 19.3% Norwegian627 7.3% American362 4.2% Irish351 4.1% English194 2.3% Scandinavian186 2.2% Danish88 1.0% European82 1.0% Dutch82 1.0% Polish68 0.8% Czech35 0.4% Scottish34 0.4% Italian30 0.4% Northern European27 0.3% Swedish24 0.3% French21 0.2% Egyptian19 0.2% Jordanian12 0.1% Lebanese10 0.1% Ukrainian9 0.1% Scotch-Irish7 0.08% Finnish7 0.08% French Canadian5 0.06% Welsh4 0.05% Brazilian
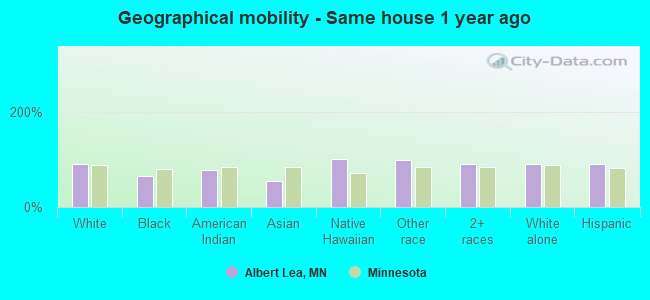
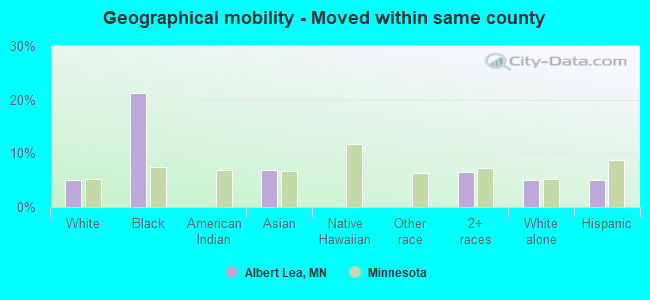
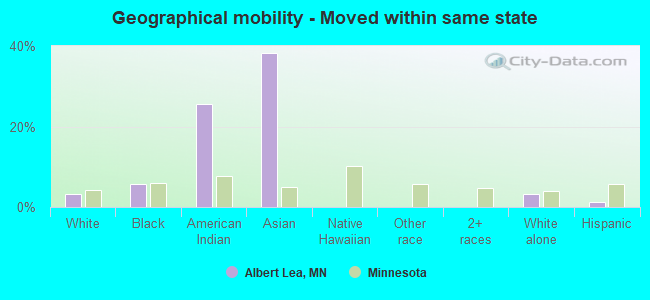
Geographical mobility in Albert Lea Same house 1 year ago 13,166 90.5% White (Caucasian)230 65.9% Black or African American58 77.5% American Indian / Alaska Native355 53.6% Asian15 100.0% Native Hawaiian / Pacific Islander1,061 98.7% Other race1,668 89.9% Two or more races12,632 90.2% White alone, not Hispanic / Latino2,585 90.4% Hispanic or LatinoMoved within same county 732 5.0% White / Caucasian74 21.2% Black or African American46 6.9% Asian121 6.5% Two or more races714 5.1% White alone, not Hispanic / Latino144 5.1% Hispanic or LatinoMoved within same state 458 3.2% White / Caucasian20 5.6% Black or African American19 25.6% American Indian / Alaska Native254 38.3% Asian456 3.3% White alone, not Hispanic / Latino36 1.2% Hispanic or LatinoMoved from different state 162 1.1% White / Caucasian9 2.5% Black or African American30 2.7% Other race76 4.1% Two or more races166 1.2% White alone, not Hispanic / Latino59 2.1% Hispanic or LatinoMoved from abroad 26 0.2% White28 0.2% White alone, not Hispanic / Latino
Children Nativity (place of birth) in Albert Lea
Children under 6 years - Living with two parents Both parents native 439 100.0% NativeBoth parents foreign-born 58 100.0% NativeOne native, one foreign-born parent 35 100.0% NativeChildren under 6 years - Living with one parent Native parent 381 100.0% NativeForeign-born parent 166 100.0% NativeChildren 6 to 17 years - Living with two parents Both parents native 1,201 100.0% NativeBoth parents foreign-born 208 100.0% NativeOne native, one foreign-born parent 29 100.0% NativeChildren 6 to 17 years - Living with one parent Native parent 1,074 100.0% NativeForeign-born parent 165 50.4% Native162 49.6% Foreign-born
Grandparents responsible for own grandchildren in Albert Lea
Grandparents (30 to 59 years) White / Caucasian 47 80.8% Responsible for grandchildren11 19.2% Not responsible for grandchildrenOther race 34 100.0% Not responsible for grandchildrenWhite alone, not Hispanic / Latino 49 100.0% Responsible for grandchildrenHispanic or Latino 38 100.0% Not responsible for grandchildrenGrandparents (60 years and over) White / Caucasian 59 48.2% Responsible for grandchildren63 51.8% Not responsible for grandchildrenOther race 19 100.0% Not responsible for grandchildrenWhite alone, not Hispanic / Latino 51 43.9% Responsible for grandchildren65 56.1% Not responsible for grandchildrenHispanic or Latino 5 22.0% Responsible for grandchildren17 78.0% Not responsible for grandchildren