Southbridge, Massachusetts (MA) Poverty Rate Data
Information about poor and low-income residents

Recent posts about poverty in Southbridge, Massachusetts on our local forum with over 2,400,000 registered users:
 | Moving Small Family to Worcester. Advice? (25 replies) |
| Most North “hood” in the northeast (181 replies) |
| Taxes driving wealth out of Massachusetts and into Florida, New Hampshire (127 replies) |
| When is the insanity going to end? There has to be a real estate market crash, right? (99 replies) |
| Catskills Like Towns in Mass? (52 replies) |
| Springfield to Boston rail (229 replies) |
Latest news about poverty in Southbridge, MA collected exclusively by city-data.com from local newspapers, TV, and radio stations
21.2% of Southbridge, MA residents had an income below the poverty level in 2022, which was 51.2% greater than the poverty level of 10.4% across the entire state of Massachusetts. Taking into account residents not living in families, 12.4% of high school graduates and 40.4% of non high school graduates live in poverty. The poverty rate was 16.9% among disabled males and 32.4% among disabled females. The renting rate among poor residents was 87.6%. For comparison, it was 57.5% among residents with income above the poverty level.
Poverty rates in Southbridge, MA
Residents with income below the poverty level in 2022:
Residents with income below 50% of the poverty level in 2022:
Poverty rate among disabled males:
Poverty rate among disabled females:
Renting rate in this place among poor and not poor residents:
| Southbridge: | 21.2% |
| Whole state: | 10.4% |
| Southbridge: | 10.2% |
| Whole state: | 5.3% |
Poverty rate among disabled males:
| Southbridge: | 16.9% |
| Massachusetts: | 13.1% |
Disability rate in this place among poor males (it is 21.9% among male residents who are not classified as poor):
| Southbridge: | 31.0% |
| Massachusetts: | 31.3% |
Poverty rate among disabled females:
| Southbridge: | 32.4% |
| Massachusetts: | 18.0% |
Disability rate in this place among poor females (it is 24.2% among female residents who are not classified as poor):
| Southbridge: | 42.3% |
| Massachusetts: | 32.5% |
Renting rate in this place among poor and not poor residents:
| Residents below poverty level: | 87.6% |
| Residents above poverty level: | 57.5% |
Poverty by age in Southbridge, MA
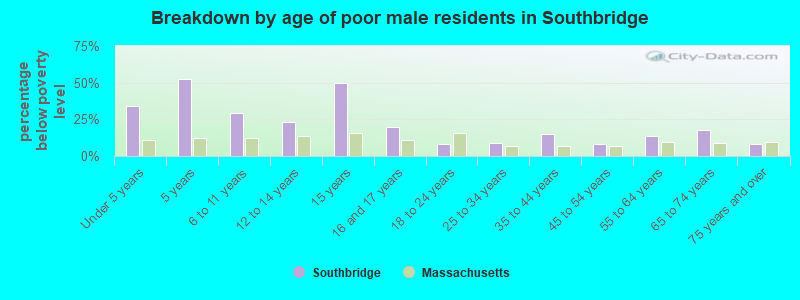
- Breakdown by age of poor male residents in Southbridge,MA (percentage below poverty level)
- 34.2%Under 5 years
- 52.6%5 years
- 29.6%6 to 11 years
- 23.1%12 to 14 years
- 50.0%15 years
- 19.7%16 and 17 years
- 8.2%18 to 24 years
- 8.8%25 to 34 years
- 15.2%35 to 44 years
- 8.1%45 to 54 years
- 13.6%55 to 64 years
- 18.0%65 to 74 years
- 8.1%75 years and over
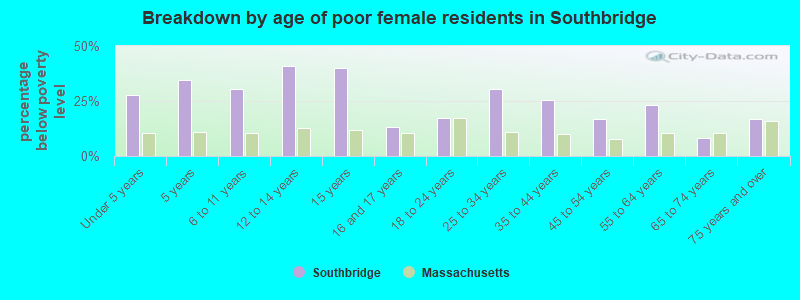
- Breakdown by age of poor female residents in Southbridge,MA (percentage below poverty level)
- 27.7%Under 5 years
- 34.7%5 years
- 30.4%6 to 11 years
- 41.1%12 to 14 years
- 40.0%15 years
- 13.1%16 and 17 years
- 17.4%18 to 24 years
- 30.6%25 to 34 years
- 25.4%35 to 44 years
- 16.8%45 to 54 years
- 23.2%55 to 64 years
- 8.1%65 to 74 years
- 16.9%75 years and over
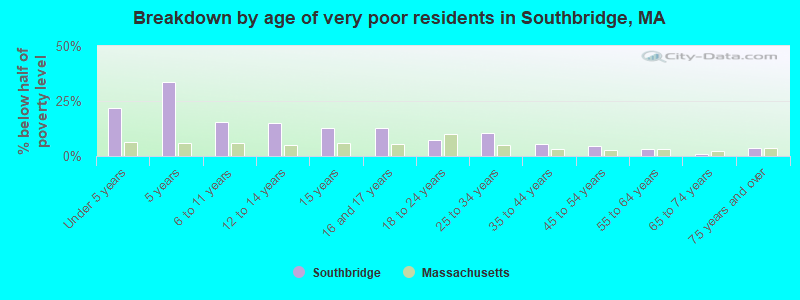
- Breakdown by age of very poor residents in Southbridge,MA (% below half of poverty level)
- 21.9%Under 5 years
- 33.7%5 years
- 15.4%6 to 11 years
- 14.8%12 to 14 years
- 12.7%15 years
- 12.9%16 and 17 years
- 7.2%18 to 24 years
- 10.4%25 to 34 years
- 5.2%35 to 44 years
- 4.5%45 to 54 years
- 3.0%55 to 64 years
- 0.8%65 to 74 years
- 3.8%75 years and over
Poverty by race and place of birth in Southbridge, MA
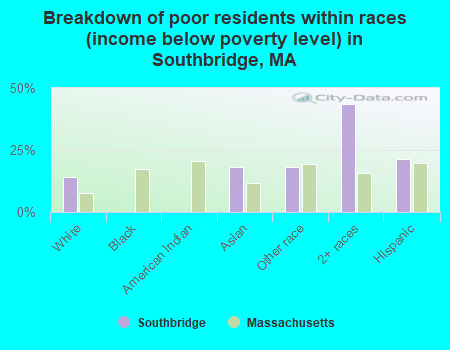
- Breakdown of poor residents within races in Southbridge, MA (%)
- 14.3%White
- 0.0%Black
- 0.0%American Indian
- 18.1%Asian
- 18.1%Other race
- 43.7%2+ races
- 21.4%Hispanic
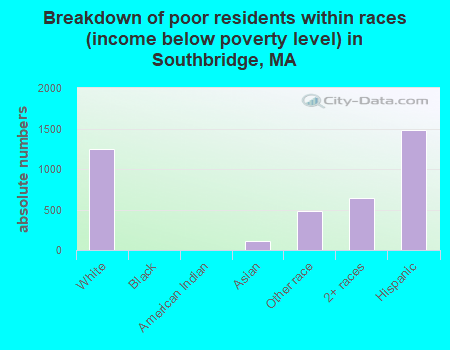
- Breakdown of poor residents within races in Southbridge, MA (absolute numbers)
- 1,250White
- 0Black
- 0American Indian
- 113Asian
- 478Other race
- 6402+ races
- 1,478Hispanic
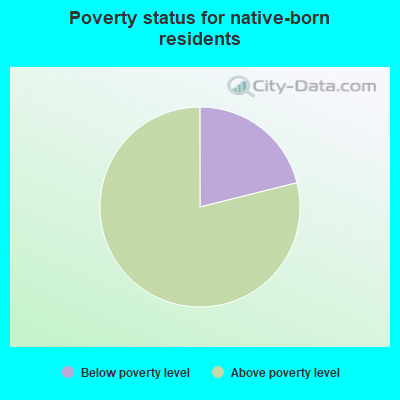
- 21.1%Below poverty level
- 78.9%Above poverty level
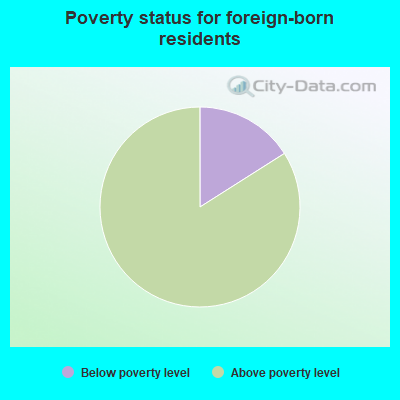
- 16.0%Below poverty level
- 84.0%Above poverty level
Poverty in families in Southbridge, MA
Children below poverty level:
| Southbridge, Massachusetts: | 31.3% |
| State: | 11.3% |
Poverty rate among high school graduates not in families:
| Southbridge: | 12.4% |
| Massachusetts: | 15.3% |
Poverty rate among people who did not graduate high school not in families:
| Southbridge: | 40.4% |
| Massachusetts: | 37.8% |
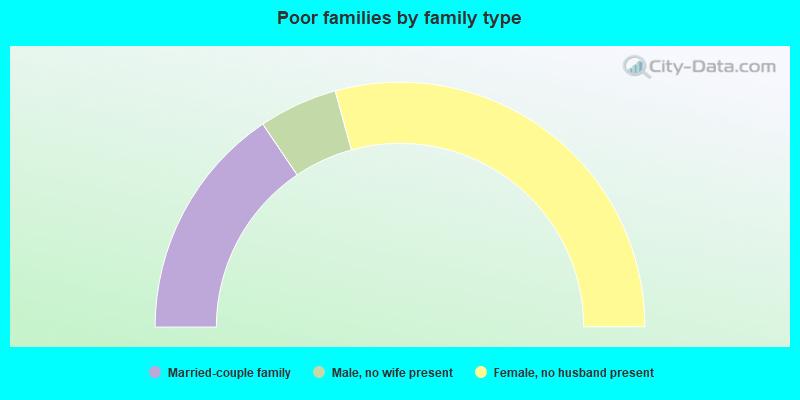
- 31.1%Married-couple family
- 10.4%Male, no wife present
- 58.5%Female, no husband present
Other data
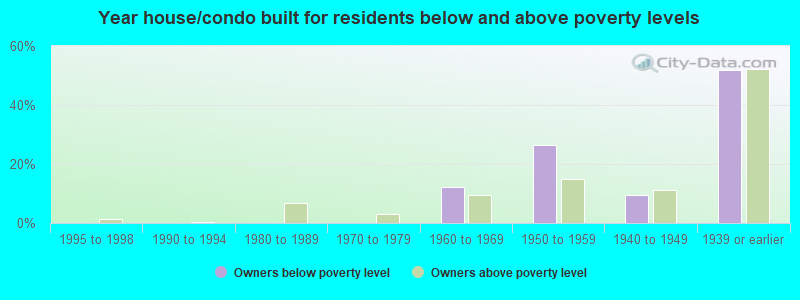
- Owners below poverty level
- 0.0%1999 to 2000
- 0.0%1995 to 1998
- 0.0%1990 to 1994
- 0.0%1980 to 1989
- 0.0%1970 to 1979
- 12.3%1960 to 1969
- 26.3%1950 to 1959
- 9.6%1940 to 1949
- 51.8%1939 or earlier
- Owners above poverty level
- 0.3%1999 to 2000
- 1.5%1995 to 1998
- 0.4%1990 to 1994
- 6.8%1980 to 1989
- 3.2%1970 to 1979
- 9.6%1960 to 1969
- 14.8%1950 to 1959
- 11.1%1940 to 1949
- 52.3%1939 or earlier