Paradise Park, California (CA) Poverty Rate Data
Data:
Residents with income below the poverty level (%)
Residents with income below the poverty level (% change since 2000)
Residents with income below the poverty level (%) - White
Residents with income below the poverty level (% change since 2000) - White
Residents with income below the poverty level (%) - Black or African American
Residents with income below the poverty level (% change since 2000) - Black or African American
Residents with income below the poverty level (%) - Asian
Residents with income below the poverty level (% change since 2000) - Asian
Residents with income below the poverty level (%) - Hispanic or Latino
Residents with income below the poverty level (% change since 2000) - Hispanic or Latino
Residents with income below the poverty level (%) - American Indian and Alaska Native
Residents with income below the poverty level (% change since 2000) - American Indian and Alaska Native
Residents with income below the poverty level (%) - Multirace
Residents with income below the poverty level (% change since 2000) - Multirace
Residents with income below the poverty level (%) - Other
Residents with income below the poverty level (% change since 2000) - Other
Residents with income below 50% of the poverty level (%)
Poor families by family type - Married-couple family (%)
Poor families by family type - Married-couple family (% change since 2000)
Poor families by family type - Male, no wife present (%)
Poor families by family type - Male, no wife present (% change since 2000)
Poor families by family type - Female, no husband present (%)
Poor families by family type - Female, no husband present (% change since 2000)
Poverty status for native-born residents (%)
Poverty status for native-born residents (% change since 2000)
Poverty status for foreign-born residents (%)
Poverty status for foreign-born residents (% change since 2000)
Children below poverty level (%)
Poverty among high school graduates not in families (%)
Poverty among people who did not graduate high school not in families (%)
Breakdown of poor residents not in families by work experience - Worked full-time, year-round (%)
Breakdown of poor residents not in families by work experience - Worked part-time (%)
Breakdown of poor residents not in families by work experience - Did not work (%)
Breakdown of poor married-couple families by work experience - Both worked full-time (%)
Breakdown of poor married-couple families by work experience - One full-time, other part-time (%)
Breakdown of poor married-couple families by work experience - One full-time, other didn't work (%)
Breakdown of poor married-couple families by work experience - Both worked part-time (%)
Breakdown of poor married-couple families by work experience - One part-time, other didn't work (%)
Breakdown of poor married-couple families by work experience - Both didn't work (%)
Renting rate among poor residents (%)
Renting rate among not poor residents (%)
Taking into account residents not living in families, 20.8% of high school graduates and 42.5% of non high school graduates live in poverty. The poverty rate was 0.0% among disabled residents.
Poverty in families in Paradise Park, CA Poverty rate among high school graduates not in families: Paradise Park:
20.8%California:
18.0%
Poverty rate among people who did not graduate high school not in families: Paradise Park:
42.5%California:
43.0%
Other data
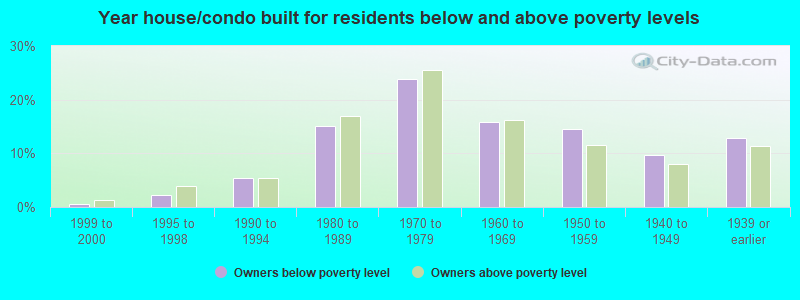
Owners below poverty level 0.6% 1999 to 20002.3% 1995 to 19985.3% 1990 to 199415.1% 1980 to 198923.8% 1970 to 197915.9% 1960 to 196914.5% 1950 to 19599.8% 1940 to 194912.8% 1939 or earlierOwners above poverty level 1.3% 1999 to 20003.9% 1995 to 19985.4% 1990 to 199417.0% 1980 to 198925.5% 1970 to 197916.1% 1960 to 196911.5% 1950 to 19598.0% 1940 to 194911.3% 1939 or earlier