Newport Coast, California (CA) Poverty Rate Data
Information about poor and low-income residents

Recent posts about poverty in Newport Coast, California on our local forum with over 2,400,000 registered users:
 | California Census Places by Highest Average Family Income($300,000+) (40 replies) |
| How did home prices fare in Newport Beach/Laguna Beach during the Great Recession? (24 replies) |
| What he HELL does everyone do in OC to make money? (456 replies) |
| Orange County Real Estate Trends (206 replies) |
| Where does the Newport Beach money come from? (47 replies) |
| OC is totally blue (389 replies) |
2.7% of Newport Coast, CA residents had an income below the poverty level in 2022, which was 352.1% less than the poverty level of 12.2% across the entire state of California.
Poverty rates in Newport Coast, CA
Residents with income below the poverty level in 2022:
Residents with income below 50% of the poverty level in 2022:
Poverty rate among disabled males:
| Newport Coast: | 2.7% |
| Whole state: | 12.2% |
| Newport Coast: | 0.4% |
| Whole state: | 6.0% |
Poverty rate among disabled males:
| Newport Coast: | 0.0% |
| California: | 16.2% |
Poverty by age in Newport Coast, CA
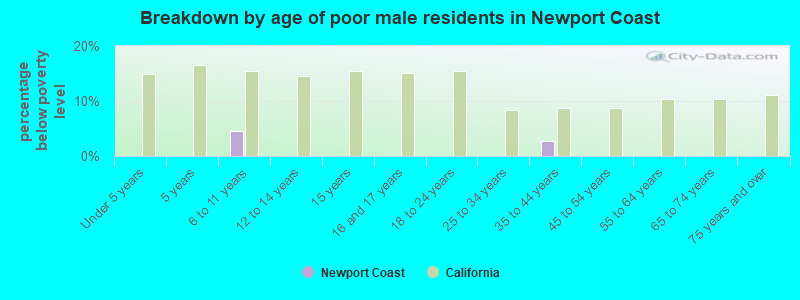
- Breakdown by age of poor male residents in Newport Coast,CA (percentage below poverty level)
- 0.0%Under 5 years
- 0.0%5 years
- 4.6%6 to 11 years
- 0.0%12 to 14 years
- 0.0%15 years
- 0.0%16 and 17 years
- 0.0%18 to 24 years
- 0.0%25 to 34 years
- 2.8%35 to 44 years
- 0.0%45 to 54 years
- 0.0%55 to 64 years
- 0.0%65 to 74 years
- 0.0%75 years and over
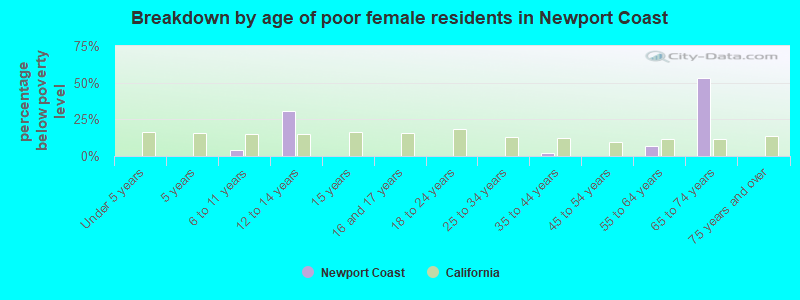
- Breakdown by age of poor female residents in Newport Coast,CA (percentage below poverty level)
- 0.0%Under 5 years
- 0.0%5 years
- 3.8%6 to 11 years
- 31.0%12 to 14 years
- 0.0%15 years
- 0.0%16 and 17 years
- 0.0%18 to 24 years
- 0.0%25 to 34 years
- 2.3%35 to 44 years
- 0.0%45 to 54 years
- 6.8%55 to 64 years
- 53.4%65 to 74 years
- 0.0%75 years and over
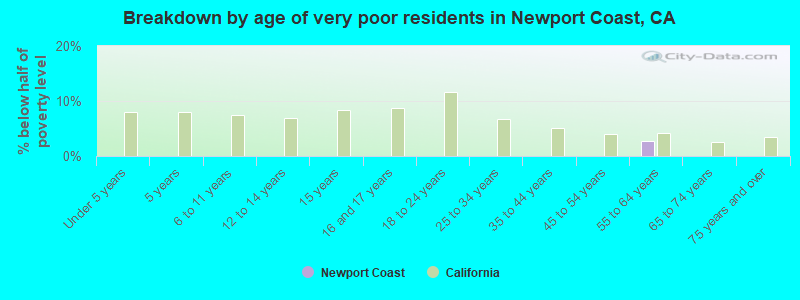
- Breakdown by age of very poor residents in Newport Coast,CA (% below half of poverty level)
- 0.0%Under 5 years
- 0.0%5 years
- 0.0%6 to 11 years
- 0.0%12 to 14 years
- 0.0%15 years
- 0.0%16 and 17 years
- 0.0%18 to 24 years
- 0.0%25 to 34 years
- 0.0%35 to 44 years
- 0.0%45 to 54 years
- 2.7%55 to 64 years
- 0.0%65 to 74 years
- 0.0%75 years and over
Poverty by race and place of birth in Newport Coast, CA
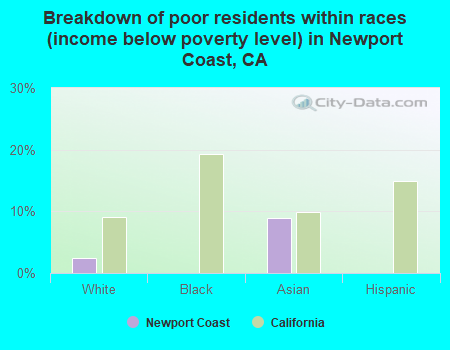
- Breakdown of poor residents within races in Newport Coast, CA (%)
- 2.5%White
- 0.0%Black
- 8.9%Asian
- 0.0%Hispanic
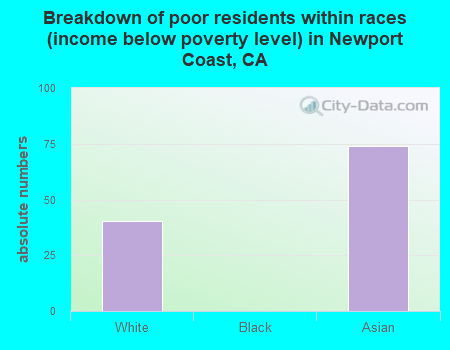
- Breakdown of poor residents within races in Newport Coast, CA (absolute numbers)
- 40White
- 0Black
- 74Asian
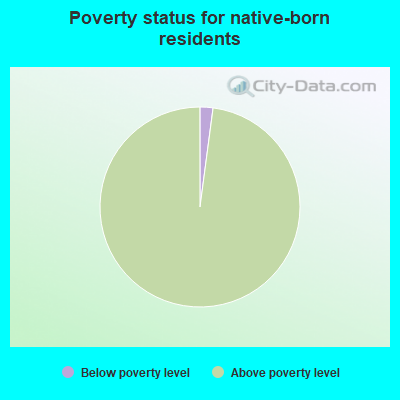
- 2.1%Below poverty level
- 97.9%Above poverty level
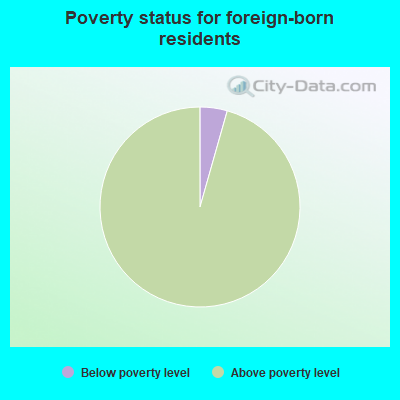
- 4.4%Below poverty level
- 95.6%Above poverty level
Poverty in families in Newport Coast, CA
Children below poverty level:
| Newport Coast, California: | 3.1% |
| State: | 15.0% |
Poverty rate among high school graduates not in families:
| Newport Coast: | 10.2% |
| California: | 18.0% |
Other data
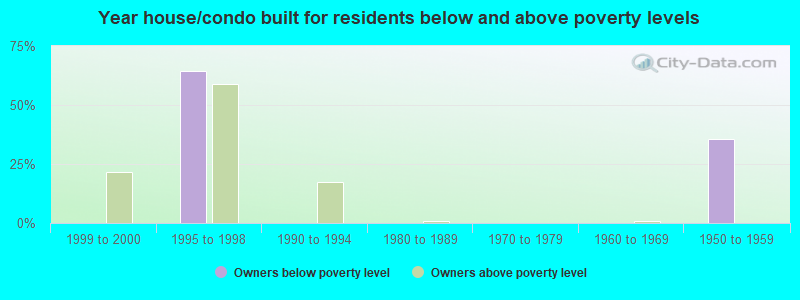
- Owners below poverty level
- 0.0%1999 to 2000
- 64.3%1995 to 1998
- 0.0%1990 to 1994
- 0.0%1980 to 1989
- 0.0%1970 to 1979
- 0.0%1960 to 1969
- 35.7%1950 to 1959
- 0.0%1940 to 1949
- 0.0%1939 or earlier
- Owners above poverty level
- 21.6%1999 to 2000
- 58.9%1995 to 1998
- 17.5%1990 to 1994
- 1.0%1980 to 1989
- 0.0%1970 to 1979
- 1.0%1960 to 1969
- 0.0%1950 to 1959
- 0.0%1940 to 1949
- 0.0%1939 or earlier