Mission Bay, Florida (FL) Poverty Rate Data
Information about poor and low-income residents

Recent posts about poverty in Mission Bay, Florida on our local forum with over 2,400,000 registered users:
 | Family friendly communities in Boca (1 reply) |
| Sigma of West Boca? (5 replies) |
| Moving from Chicago To Boca Raton (15 replies) |
| Moving from Long Island to Boca (19 replies) |
| Which area is better for families-West Boca or Wellington? (19 replies) |
| West Boca Communities (19 replies) |
2.5% of Mission Bay, FL residents had an income below the poverty level in 2022, which was 407.6% less than the poverty level of 12.7% across the entire state of Florida. The poverty rate was 0.0% among disabled males and 6.2% among disabled females.
Poverty rates in Mission Bay, FL
Residents with income below the poverty level in 2022:
Residents with income below 50% of the poverty level in 2022:
Poverty rate among disabled males:
Poverty rate among disabled females:
| Mission Bay: | 2.5% |
| Whole state: | 12.7% |
| Mission Bay: | 2.1% |
| Whole state: | 6.1% |
Poverty rate among disabled males:
| Mission Bay: | 0.0% |
| Florida: | 13.8% |
Poverty rate among disabled females:
| Mission Bay: | 6.2% |
| Florida: | 18.1% |
Disability rate in this place among poor females (it is 9.1% among female residents who are not classified as poor):
| Mission Bay: | 24.3% |
| Florida: | 29.4% |
Poverty by age in Mission Bay, FL
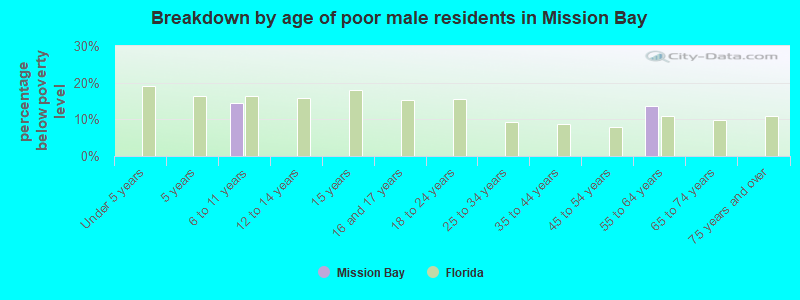
- Breakdown by age of poor male residents in Mission Bay,FL (percentage below poverty level)
- 0.0%Under 5 years
- 0.0%5 years
- 14.5%6 to 11 years
- 0.0%12 to 14 years
- 0.0%15 years
- 0.0%16 and 17 years
- 0.0%18 to 24 years
- 0.0%25 to 34 years
- 0.0%35 to 44 years
- 0.0%45 to 54 years
- 13.5%55 to 64 years
- 0.0%65 to 74 years
- 0.0%75 years and over
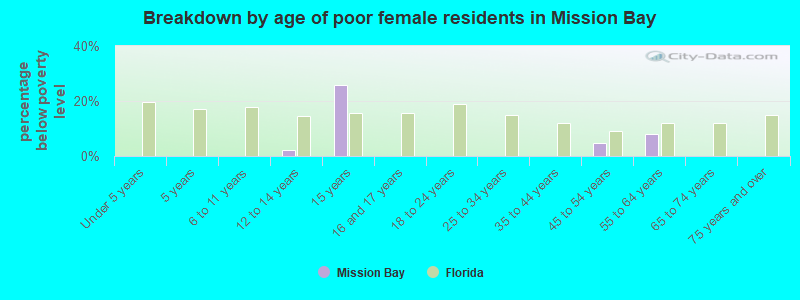
- Breakdown by age of poor female residents in Mission Bay,FL (percentage below poverty level)
- 0.0%Under 5 years
- 0.0%5 years
- 0.0%6 to 11 years
- 2.0%12 to 14 years
- 25.7%15 years
- 0.0%16 and 17 years
- 0.0%18 to 24 years
- 0.0%25 to 34 years
- 0.0%35 to 44 years
- 4.7%45 to 54 years
- 8.2%55 to 64 years
- 0.0%65 to 74 years
- 0.0%75 years and over
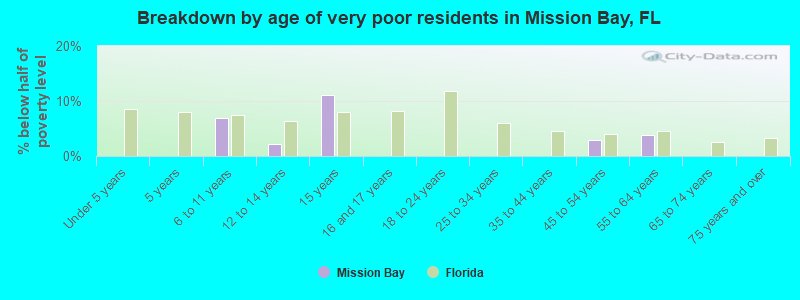
- Breakdown by age of very poor residents in Mission Bay,FL (% below half of poverty level)
- 0.0%Under 5 years
- 0.0%5 years
- 6.8%6 to 11 years
- 2.2%12 to 14 years
- 11.1%15 years
- 0.0%16 and 17 years
- 0.0%18 to 24 years
- 0.0%25 to 34 years
- 0.0%35 to 44 years
- 2.9%45 to 54 years
- 3.7%55 to 64 years
- 0.0%65 to 74 years
- 0.0%75 years and over
Poverty by race and place of birth in Mission Bay, FL
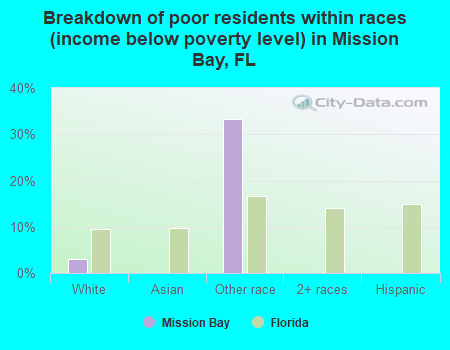
- Breakdown of poor residents within races in Mission Bay, FL (%)
- 2.9%White
- 0.0%Asian
- 33.3%Other race
- 0.0%2+ races
- 0.0%Hispanic
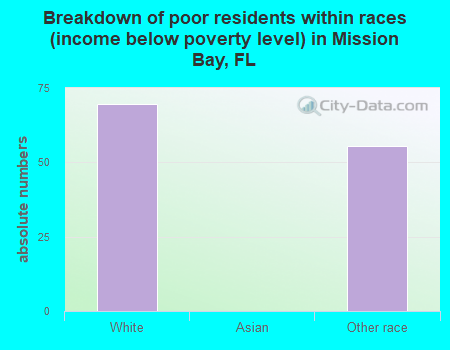
- Breakdown of poor residents within races in Mission Bay, FL (absolute numbers)
- 70White
- 0Asian
- 56Other race
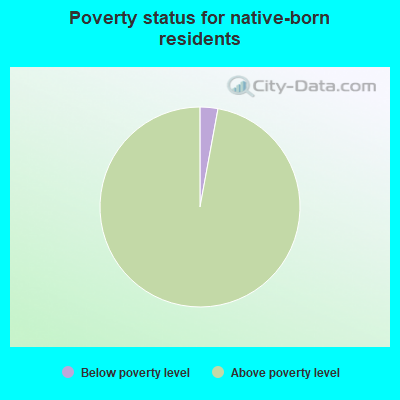
- 2.9%Below poverty level
- 97.1%Above poverty level

- 0.9%Below poverty level
- 99.1%Above poverty level
Poverty in families in Mission Bay, FL
Children below poverty level:
| Mission Bay, Florida: | 3.3% |
| State: | 16.8% |
Poverty rate among high school graduates not in families:
| Mission Bay: | 11.4% |
| Florida: | 17.3% |
Other data
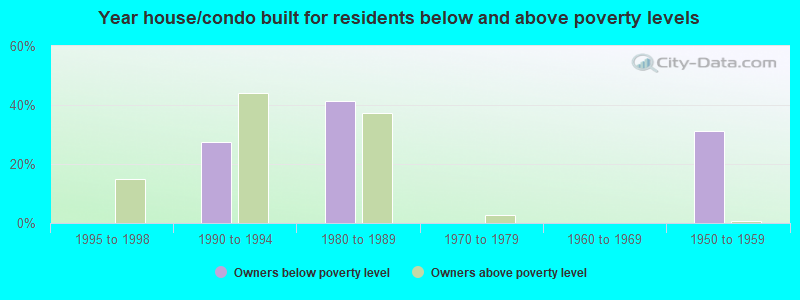
- Owners below poverty level
- 0.0%1999 to 2000
- 0.0%1995 to 1998
- 27.6%1990 to 1994
- 41.4%1980 to 1989
- 0.0%1970 to 1979
- 0.0%1960 to 1969
- 31.0%1950 to 1959
- 0.0%1940 to 1949
- 0.0%1939 or earlier
- Owners above poverty level
- 0.0%1999 to 2000
- 14.8%1995 to 1998
- 44.2%1990 to 1994
- 37.3%1980 to 1989
- 2.9%1970 to 1979
- 0.0%1960 to 1969
- 0.8%1950 to 1959
- 0.0%1940 to 1949
- 0.0%1939 or earlier