Mira Loma, California (CA) Poverty Rate Data
Information about poor and low-income residents

Recent posts about poverty in Mira Loma, California on our local forum with over 2,400,000 registered users:
 | Lots Of People Leaving California? (336 replies) |
| Riverside #8 Coolest City According to Forbes (49 replies) |
| The ideal Sacramento suburb (105 replies) |
| Paradise Fire/Camp Creek Fire 11/08/2018 (783 replies) |
| Suggestions for getting our first house (89 replies) |
| Rubidoux, Riverside, CA (18 replies) |
11.0% of Mira Loma, CA residents had an income below the poverty level in 2022, which was 11.0% less than the poverty level of 12.2% across the entire state of California. 6.6% of high school graduates and 12.4% of non high school graduates live in poverty. The poverty rate was 14.7% among disabled residents. The renting rate among poor residents was 43.9%. For comparison, it was 20.2% among residents with income above the poverty level.
Poverty rates in Mira Loma, CA
Residents with income below the poverty level in 2022:
Residents with income below 50% of the poverty level in 2022:
Poverty rate among disabled residents:
Renting rate in this place among poor and not poor residents:
| Mira Loma: | 11.0% |
| Whole state: | 12.2% |
| Mira Loma: | 4.9% |
| Whole state: | 6.0% |
Poverty rate among disabled residents:
| Mira Loma: | 14.7% |
| California: | 19.4% |
Disability rate in this place among poor residents (it is 8.1% among residents who are not classified as poor):
| Mira Loma: | 11.3% |
| California: | 18.7% |
Renting rate in this place among poor and not poor residents:
| Residents below poverty level: | 43.9% |
| Residents above poverty level: | 20.2% |
Poverty by age in Mira Loma, CA
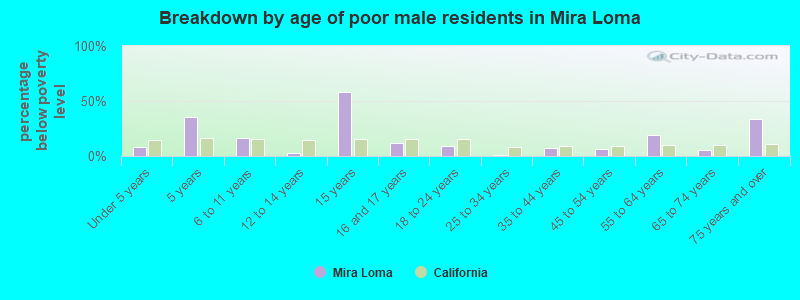
- Breakdown by age of poor male residents in Mira Loma,CA (percentage below poverty level)
- 8.6%Under 5 years
- 35.9%5 years
- 16.5%6 to 11 years
- 2.6%12 to 14 years
- 58.4%15 years
- 11.7%16 and 17 years
- 9.2%18 to 24 years
- 1.3%25 to 34 years
- 7.6%35 to 44 years
- 6.6%45 to 54 years
- 18.8%55 to 64 years
- 5.8%65 to 74 years
- 33.8%75 years and over
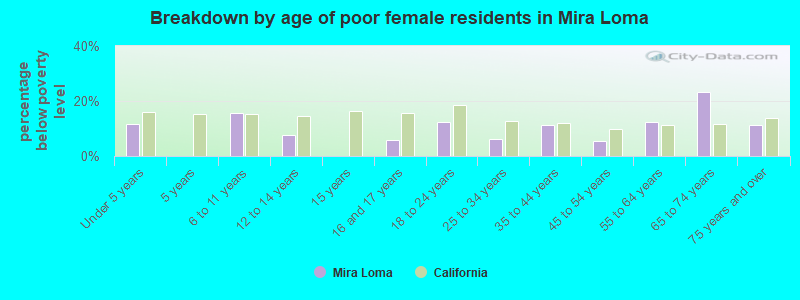
- Breakdown by age of poor female residents in Mira Loma,CA (percentage below poverty level)
- 11.5%Under 5 years
- 0.0%5 years
- 15.5%6 to 11 years
- 7.7%12 to 14 years
- 0.0%15 years
- 5.8%16 and 17 years
- 12.5%18 to 24 years
- 6.1%25 to 34 years
- 11.4%35 to 44 years
- 5.4%45 to 54 years
- 12.3%55 to 64 years
- 23.4%65 to 74 years
- 11.2%75 years and over
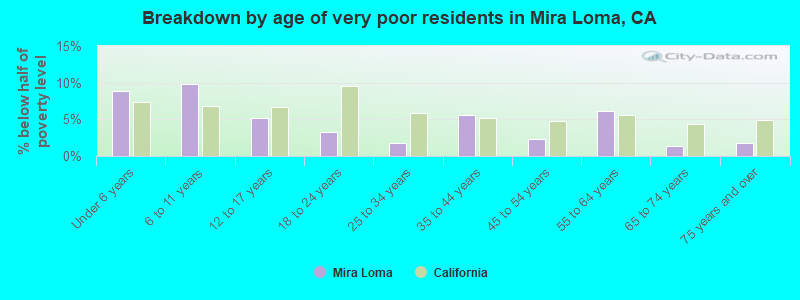
- Breakdown by age of very poor residents in Mira Loma,CA (% below half of poverty level)
- 8.9%Under 6 years
- 9.9%6 to 11 years
- 5.2%12 to 17 years
- 3.3%18 to 24 years
- 1.8%25 to 34 years
- 5.6%35 to 44 years
- 2.3%45 to 54 years
- 6.2%55 to 64 years
- 1.4%65 to 74 years
- 1.8%75 years and over
Poverty by race and place of birth in Mira Loma, CA
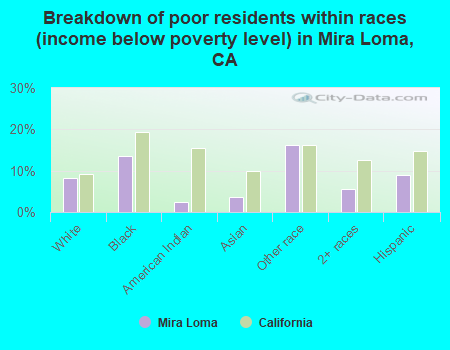
- Breakdown of poor residents within races in Mira Loma, CA (%)
- 8.1%White
- 13.4%Black
- 2.5%American Indian
- 3.6%Asian
- 16.2%Other race
- 5.6%2+ races
- 9.1%Hispanic
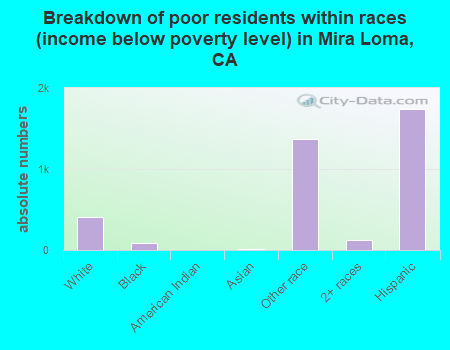
- Breakdown of poor residents within races in Mira Loma, CA (absolute numbers)
- 412White
- 87Black
- 2American Indian
- 17Asian
- 1,370Other race
- 1212+ races
- 1,737Hispanic
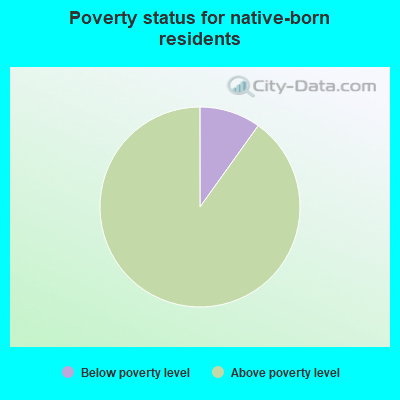
- 9.9%Below poverty level
- 90.1%Above poverty level
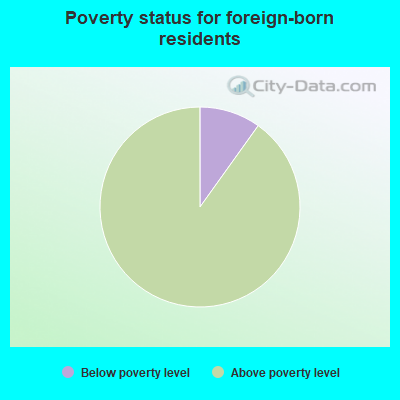
- 9.9%Below poverty level
- 90.1%Above poverty level
Poverty in families in Mira Loma, CA
Children below poverty level:
| Mira Loma, California: | 13.9% |
| State: | 15.0% |
Poverty rate among high school graduates:
| Mira Loma: | 6.6% |
| California: | 8.8% |
Poverty rate among people who did not graduate high school:
| Mira Loma: | 12.4% |
| California: | 20.4% |
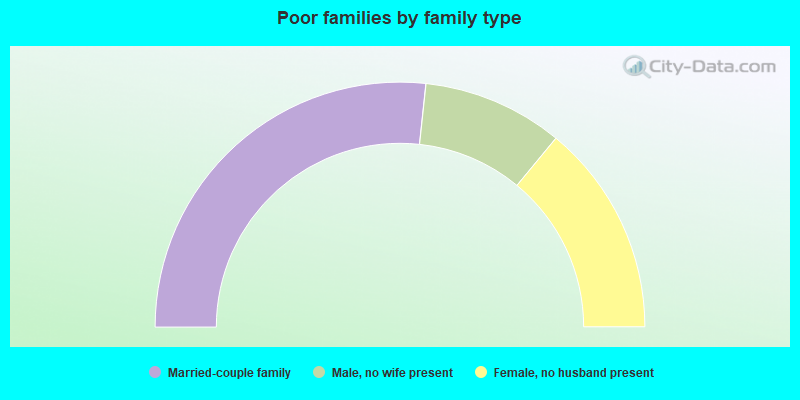
- 53.4%Married-couple family
- 18.6%Male, no wife present
- 28.0%Female, no husband present
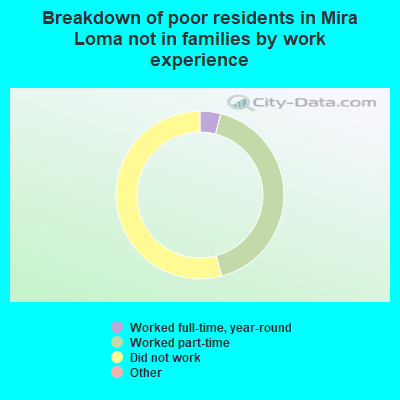
- 4.0%Worked full-time, year-round
- 41.9%Worked part-time
- 54.1%Did not work
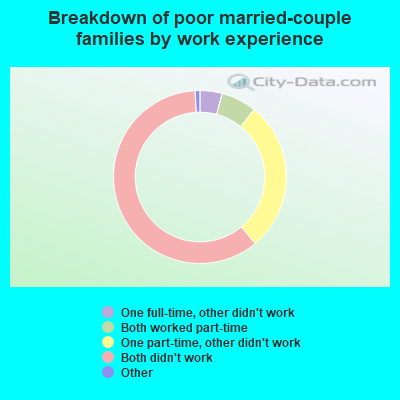
- 0.0%Both worked full-time
- 0.0%One full-time, other part-time
- 4.2%One full-time, other didn't work
- 6.7%Both worked part-time
- 28.5%One part-time, other didn't work
- 60.7%Both didn't work
Other data
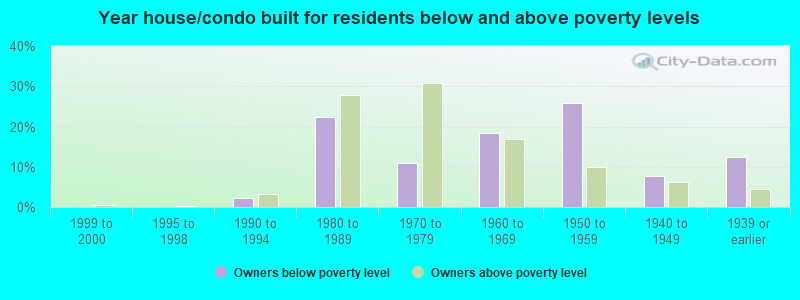
- Owners below poverty level
- 0.0%1999 to 2000
- 0.0%1995 to 1998
- 2.3%1990 to 1994
- 22.3%1980 to 1989
- 10.9%1970 to 1979
- 18.4%1960 to 1969
- 25.8%1950 to 1959
- 7.8%1940 to 1949
- 12.5%1939 or earlier
- Owners above poverty level
- 0.6%1999 to 2000
- 0.1%1995 to 1998
- 3.2%1990 to 1994
- 27.8%1980 to 1989
- 30.8%1970 to 1979
- 16.8%1960 to 1969
- 10.0%1950 to 1959
- 6.1%1940 to 1949
- 4.5%1939 or earlier