Greatwood, Texas (TX) Poverty Rate Data
Information about poor and low-income residents

Recent posts about poverty in Greatwood, Texas on our local forum with over 2,400,000 registered users:
 | Texas ETJ Bill (84 replies) |
| Greatwood Subdivisions (2 replies) |
| Houston school districts: should they try to accept Chinese international students to make money? (28 replies) |
| Towne Lake Worsening? (187 replies) |
| Looking for info on Greatwood and Campbell elementary in Sugar land (3 replies) |
| Newer Neighborhoods in Rosenberg? Thoughts? (16 replies) |
1.8% of Greatwood, TX residents had an income below the poverty level in 2022, which was 686.8% less than the poverty level of 14.0% across the entire state of Texas. 1.6% of high school graduates and 15.2% of non high school graduates live in poverty. The poverty rate was 1.0% among disabled residents. The renting rate among poor residents was 18.9%. For comparison, it was 4.8% among residents with income above the poverty level.
Poverty rates in Greatwood, TX
Residents with income below the poverty level in 2022:
Residents with income below 50% of the poverty level in 2022:
Poverty rate among disabled residents:
Renting rate in this place among poor and not poor residents:
| Greatwood: | 1.8% |
| Whole state: | 14.0% |
| Greatwood: | 0.9% |
| Whole state: | 6.6% |
Poverty rate among disabled residents:
| Greatwood: | 1.0% |
| Texas: | 20.1% |
Disability rate in this place among poor residents (it is 6.8% among residents who are not classified as poor):
| Greatwood: | 3.7% |
| Texas: | 17.9% |
Renting rate in this place among poor and not poor residents:
| Residents below poverty level: | 18.9% |
| Residents above poverty level: | 4.8% |
Poverty by age in Greatwood, TX
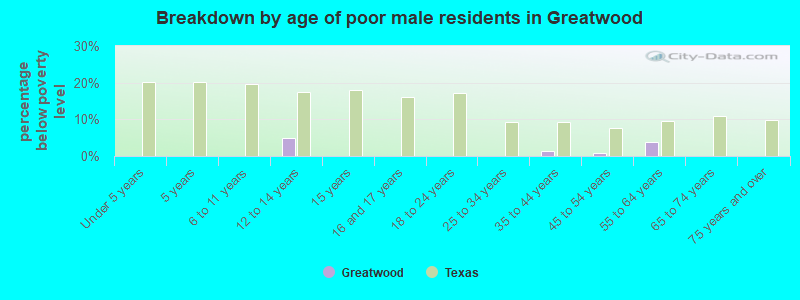
- Breakdown by age of poor male residents in Greatwood,TX (percentage below poverty level)
- 0.0%Under 5 years
- 0.0%5 years
- 0.0%6 to 11 years
- 4.8%12 to 14 years
- 0.0%15 years
- 0.0%16 and 17 years
- 0.0%18 to 24 years
- 0.0%25 to 34 years
- 1.5%35 to 44 years
- 0.7%45 to 54 years
- 3.8%55 to 64 years
- 0.0%65 to 74 years
- 0.0%75 years and over
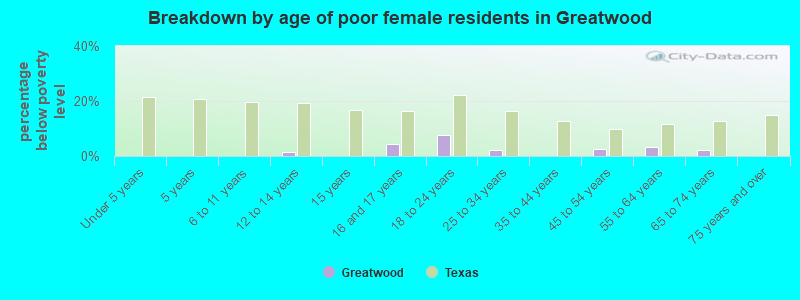
- Breakdown by age of poor female residents in Greatwood,TX (percentage below poverty level)
- 0.0%Under 5 years
- 0.0%5 years
- 0.0%6 to 11 years
- 1.5%12 to 14 years
- 0.0%15 years
- 4.4%16 and 17 years
- 7.8%18 to 24 years
- 2.3%25 to 34 years
- 0.0%35 to 44 years
- 2.4%45 to 54 years
- 3.3%55 to 64 years
- 2.1%65 to 74 years
- 0.0%75 years and over
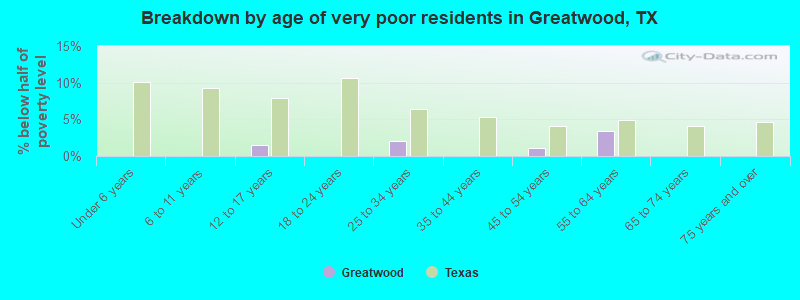
- Breakdown by age of very poor residents in Greatwood,TX (% below half of poverty level)
- 0.0%Under 6 years
- 0.0%6 to 11 years
- 1.4%12 to 17 years
- 0.0%18 to 24 years
- 2.1%25 to 34 years
- 0.0%35 to 44 years
- 1.0%45 to 54 years
- 3.4%55 to 64 years
- 0.0%65 to 74 years
- 0.0%75 years and over
Poverty by race and place of birth in Greatwood, TX
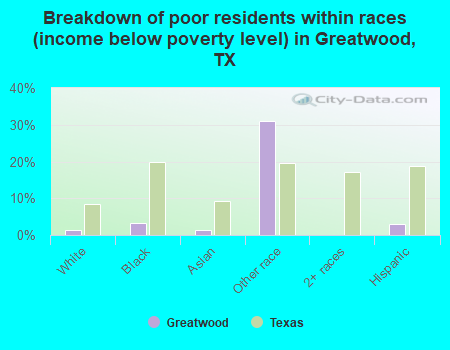
- Breakdown of poor residents within races in Greatwood, TX (%)
- 1.3%White
- 3.2%Black
- 1.2%Asian
- 31.1%Other race
- 0.0%2+ races
- 2.9%Hispanic
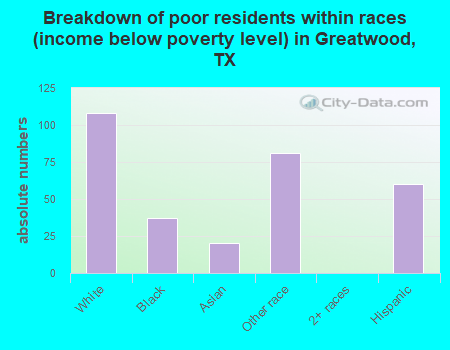
- Breakdown of poor residents within races in Greatwood, TX (absolute numbers)
- 108White
- 37Black
- 20Asian
- 81Other race
- 02+ races
- 60Hispanic
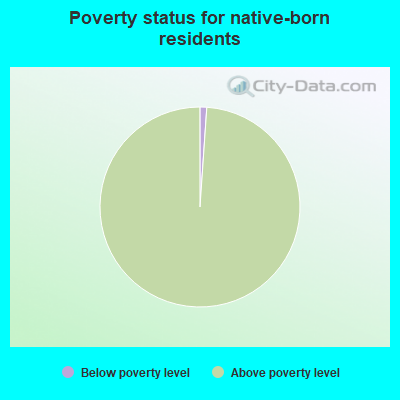
- 1.1%Below poverty level
- 98.9%Above poverty level
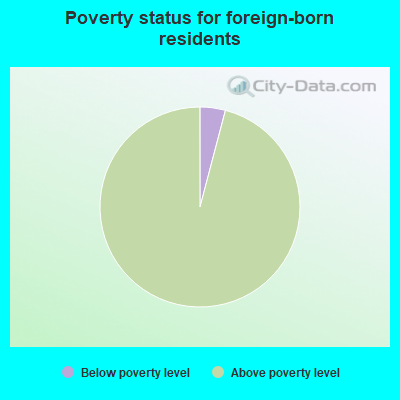
- 4.1%Below poverty level
- 95.9%Above poverty level
Poverty in families in Greatwood, TX
Children below poverty level:
| Greatwood, Texas: | 1.0% |
| State: | 19.0% |
Poverty rate among high school graduates:
| Greatwood: | 1.6% |
| Texas: | 9.2% |
Poverty rate among people who did not graduate high school:
| Greatwood: | 15.2% |
| Texas: | 23.8% |
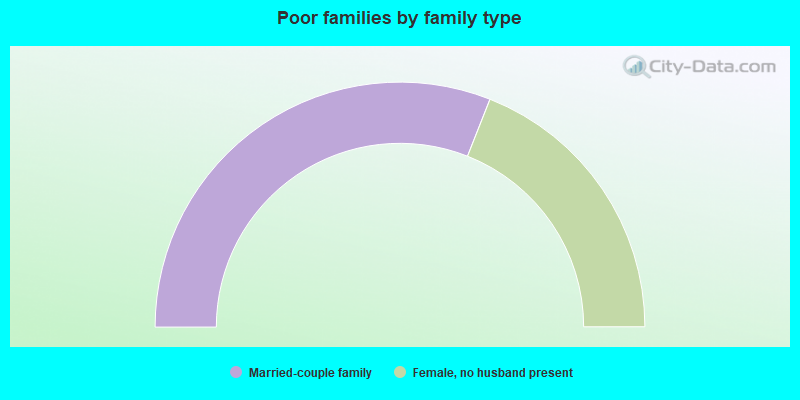
- 62.0%Married-couple family
- 0.0%Male, no wife present
- 38.0%Female, no husband present
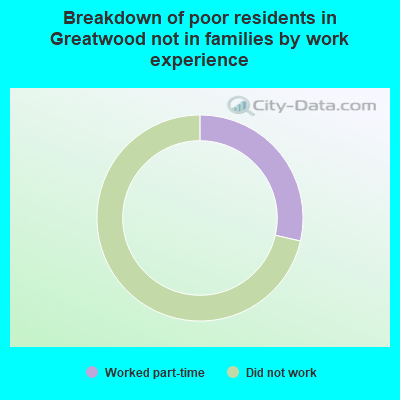
- 0.0%Worked full-time, year-round
- 28.6%Worked part-time
- 71.4%Did not work
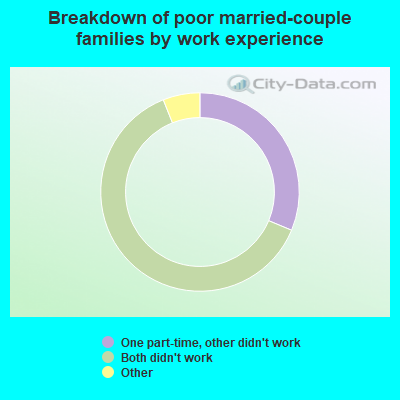
- 0.0%Both worked full-time
- 0.0%One full-time, other part-time
- 0.0%One full-time, other didn't work
- 0.0%Both worked part-time
- 33.3%One part-time, other didn't work
- 66.7%Both didn't work
Other data
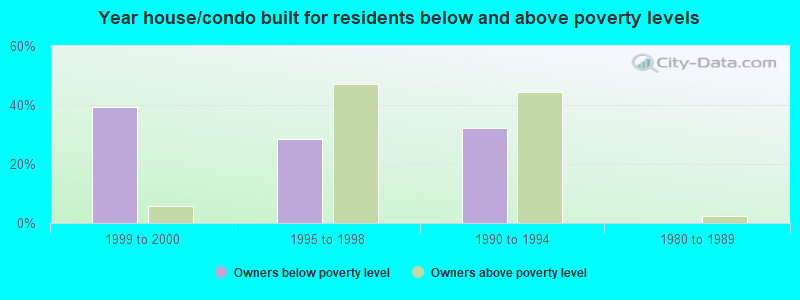
- Owners below poverty level
- 39.3%1999 to 2000
- 28.6%1995 to 1998
- 32.1%1990 to 1994
- 0.0%1980 to 1989
- 0.0%1970 to 1979
- 0.0%1960 to 1969
- 0.0%1950 to 1959
- 0.0%1940 to 1949
- 0.0%1939 or earlier
- Owners above poverty level
- 5.8%1999 to 2000
- 47.1%1995 to 1998
- 44.3%1990 to 1994
- 2.5%1980 to 1989
- 0.0%1970 to 1979
- 0.4%1960 to 1969
- 0.0%1950 to 1959
- 0.0%1940 to 1949
- 0.0%1939 or earlier