Yerba Buena neighborhood in San Jose, California (CA), 95122 detailed profile
Settings
X

Business Search - 14 Million verified businesses
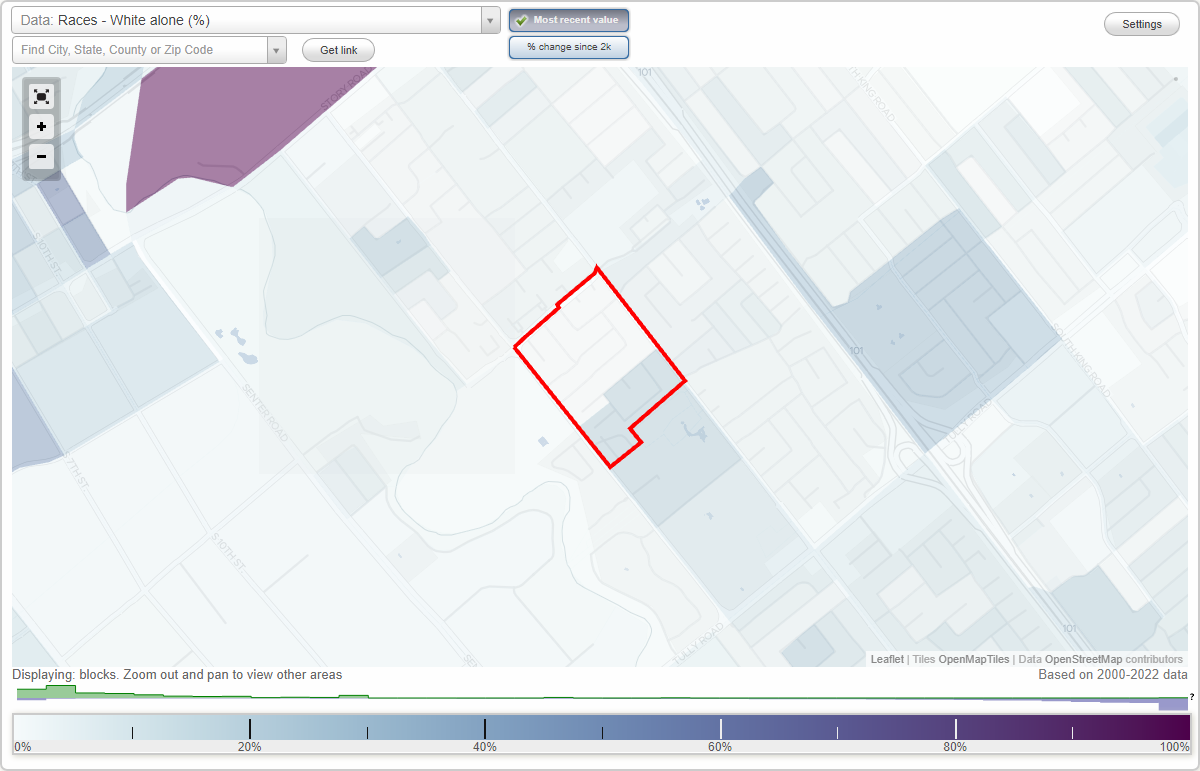
Area: 0.091 square miles
Population: 661
Population density:
| Yerba Buena: | 7,235 people per square mile |
| San Jose: | 5,554 people per square mile |

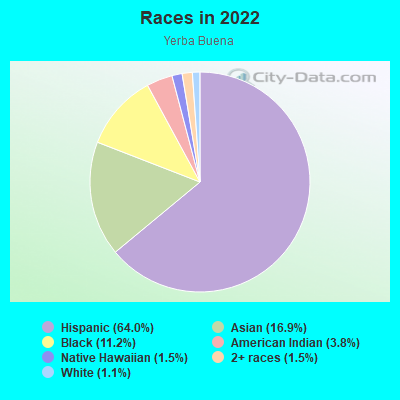
- 42464.0%Hispanic or Latino
- 11216.9%Asian
- 7411.2%Black
- 253.8%American Indian
- 101.5%Native Hawaiian and Other
Pacific Islander - 101.5%Two or more races
- 71.1%White
Median household income in 2022:
| Yerba Buena: | $123,870 |
| San Jose: | $133,835 |
Distribution of median household income
![Distribution of median household income]()
- 15$10,000 to $19,999
- 8$20,000 to $29,999
- 5$30,000 to $39,999
- 8$40,000 to $49,999
- 28$50,000 to $59,999
- 5$60,000 to $74,999
- 42$75,000 to $99,999
- 53$100,000 to $124,999
- 47$125,000 to $149,999
- 5$150,000 to $199,999
- 28$200,000 or more

Distribution of owner-occupied house/condo value
![Distribution of owner-occupied house/condo value]()
- 6Less than $50,000
- 5$300,000 to $399,999
- 6$500,000 to $749,999
- 29$750,000 to $999,999
- 7$1,000,000 or more

Distribution of rent paid by renters
![Distribution of rent paid by renters]()
- 7$500 to $599
- 2$900 to $999
- 4$1,000 to $1,249
- 5$1,500 to $1,999
- 146$2,000 or more

Median rent in 2022:
| Yerba Buena: | $2,337 |
| San Jose: | $2,001 |
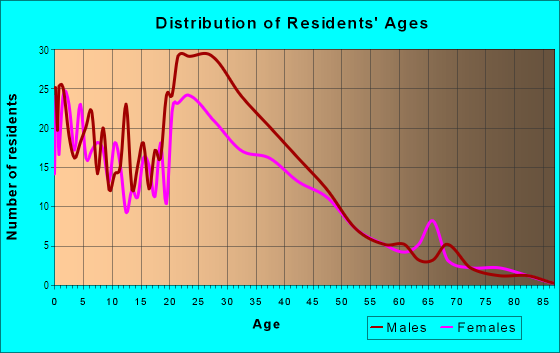
| Males: | 343 |
| Females: | 318 |
Males:
| This neighborhood: | 40.7 years |
| Whole city: | 37.6 years |
| This neighborhood: | 38.9 years |
| Whole city: | 39.1 years |
Average household size:
| Yerba Buena: | 3.9 people |
| San Jose: | 2.9 people |
Percentage of family households:
| Yerba Buena: | 52.4% |
| San Jose: | 49.9% |
| Here: | 74.3% |
| San Jose: | 53.0% |
Percentage of married-couple families with children (among all households):
| Yerba Buena: | 16.6% |
| San Jose: | 25.8% |
Percentage of single-mother households (among all households):
| Yerba Buena: | 6.1% |
| San Jose: | 5.2% |
Percentage of never married males 15 years old and over:
Percentage of never married females 15 years old and over:
| Yerba Buena: | 21.7% |
| San Jose: | 20.9% |
Percentage of never married females 15 years old and over:
| Yerba Buena: | 21.7% |
| city: | 16.7% |
Percentage of people that speak English not well or not at all:
| Yerba Buena: | 16.7% |
| San Jose: | 11.4% |
Percentage of people born in this state:
Percentage of people born in another U.S. state:
Percentage of native residents but born outside the U.S.:
Percentage of foreign born residents:
| Here: | 36.5% |
| San Jose: | 46.1% |
Percentage of people born in another U.S. state:
| Yerba Buena: | 2.2% |
| San Jose: | 10.4% |
Percentage of native residents but born outside the U.S.:
| Here: | 0.9% |
| city: | 1.7% |
Percentage of foreign born residents:
| Here: | 60.5% |
| San Jose: | 41.8% |
Owner-occupied
Renter-occupied

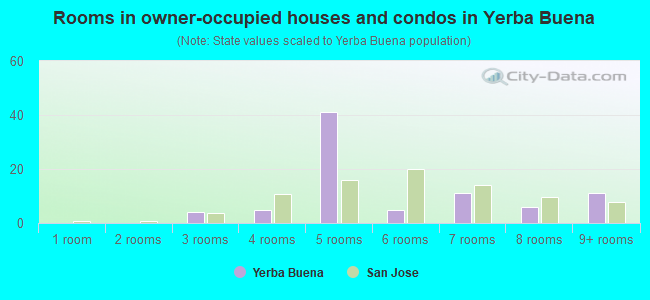
- Rooms in owner-occupied houses and condos in Yerba Buena
- 01 room
- 02 rooms
- 43 rooms
- 54 rooms
- 415 rooms
- 56 rooms
- 117 rooms
- 68 rooms
- 119+ rooms
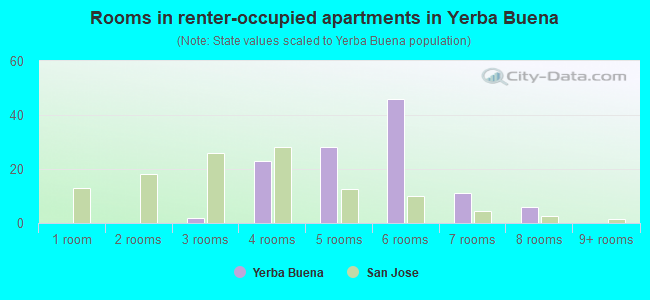
- Rooms in renter-occupied apartments in Yerba Buena
- 01 room
- 02 rooms
- 23 rooms
- 234 rooms
- 285 rooms
- 466 rooms
- 117 rooms
- 68 rooms
- 09+ rooms
Owner-occupied
Renter-occupied
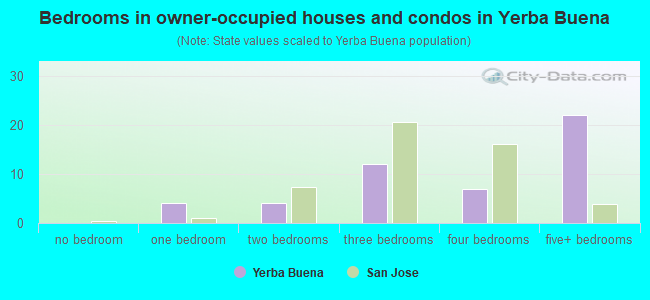
- Bedrooms in owner-occupied houses and condos in Yerba Buena
- 0no bedroom
- 41 bedroom
- 42 bedrooms
- 123 bedrooms
- 74 bedrooms
- 225+ bedrooms

- Bedrooms in renter-occupied apartments in Yerba Buena
- 0no bedroom
- 21 bedroom
- 232 bedrooms
- 283 bedrooms
- 474 bedrooms
- 115+ bedrooms
Average number of cars or other vehicles available in houses/condos:
Average number of cars or other vehicles available in apartments:
| This neighborhood: | 3.5 |
| San Jose: | 2.3 |
Average number of cars or other vehicles available in apartments:
| Here: | 3.0 |
| city: | 1.6 |
Percentage of units with a mortgage:
| Yerba Buena: | 88.5% |
| San Jose: | 66.9% |
Housing prices:
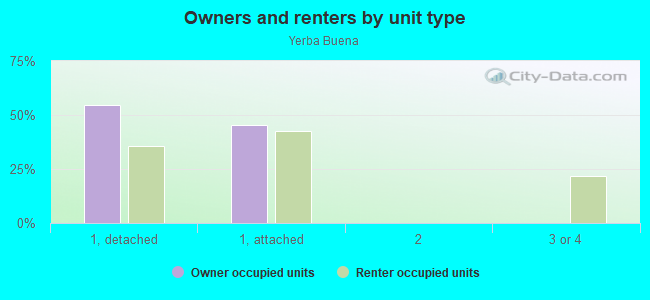
- Average estimated value of detached houses in 2022 (38.7% of all units):
Yerba Buena: $965,497 San Jose: $1,532,815
- Average estimated value of townhouses or other attached units in 2022 (39.9% of all units):
This neighborhood: $655,901 city: $1,024,857
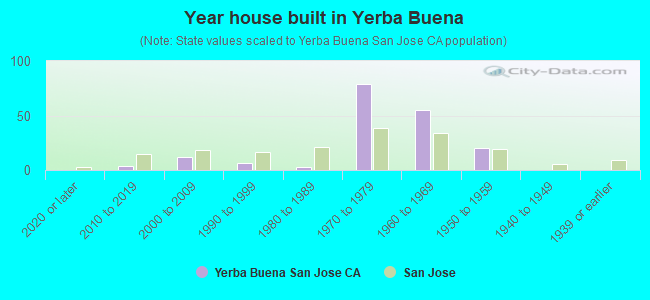
- Year house built in Yerba Buena
- 02020 or later
- 42010 to 2019
- 122000 to 2009
- 61990 to 1999
- 31980 to 1989
- 791970 to 1979
- 551960 to 1969
- 201950 to 1959
- 01940 to 1949
- 01939 or earlier
City-data.com crime index for city in 2020 (higher means more crime):
| City: | 268.4 |
| U.S. average: | 219.5 |
Travel time to work (commute)
![Travel time to work (commute)]()
- 95 to 9 minutes
- 5210 to 14 minutes
- 12715 to 19 minutes
- 12620 to 24 minutes
- 6225 to 29 minutes
- 14830 to 34 minutes
- 735 to 39 minutes
- 2140 to 44 minutes
- 4645 to 59 minutes
- 2260 to 89 minutes
- 1790 or more minutes

Means of transportation to work
![Means of transportation to work]()
- 82.5%235Drove a car alone
- 11.2%32Carpooled
- 1.4%4Bus
- 2.1%6Taxi
- 1.4%4Motorcycle
- 2.8%8Other means
- 3.9%11Worked at home

Time leaving home to go to work
![Time leaving home to go to work]()
- 4612:00 a.m. to 4:59 a.m.
- 325:00 a.m. to 5:29 a.m.
- 465:30 a.m. to 5:59 a.m.
- 456:00 a.m. to 6:29 a.m.
- 706:30 a.m. to 6:59 a.m.
- 1387:00 a.m. to 7:29 a.m.
- 447:30 a.m. to 7:59 a.m.
- 548:00 a.m. to 8:29 a.m.
- 208:30 a.m. to 8:59 a.m.
- 309:00 a.m. to 9:59 a.m.
- 2810:00 a.m. to 10:59 a.m.
- 211:00 a.m. to 11:59 a.m.
- 6412:00 p.m. to 3:59 p.m.
- 274:00 p.m. to 11:59 p.m.

Occupations of males:
- Percentage of males in business and financial operations occupations:
Here: 6.5% city: 4.6%
- Percentage of males in computer and mathematical occupations:
Here: 6.5% city: 13.6%
- Percentage of males in life, physical, and social science occupations:
Here: 2.4% city: 1.1%
- Percentage of males in community and social services occupations:
Here: 2.3% city: 0.8%
- Percentage of males in healthcare practitioners and technical occupations:
Here: 4.3% city: 2.0%
- Percentage of males in service occupations:
Here: 40.1% city: 12.7%
- Percentage of males in sales and office occupations:
Here: 1.7% city: 12.8%
- Percentage of males in construction, extraction, and maintenance occupations:
Here: 11.0% city: 7.8%
- Percentage of males in production occupations:
Here: 24.5% city: 5.5%
Occupations of females:
- Percentage of females in management occupations (except farmers):
Here: 6.9% city: 11.0%
- Percentage of females in business and financial operations occupations:
Here: 2.4% city: 8.6%
- Percentage of females in community and social services occupations:
Here: 3.3% city: 1.8%
- Percentage of females in education, training, and library occupations:
Here: 7.0% city: 8.1%
- Percentage of females in healthcare practitioners and technical occupations:
Here: 17.2% city: 6.8%
- Percentage of females in service occupations:
Here: 64.0% city: 21.7%
- Percentage of females in sales and office occupations:
Here: 16.2% city: 22.0%
- Percentage of females in construction, extraction, and maintenance occupations:
Here: 2.7% city: 0.2%
- Percentage of females in transportation occupations:
Here: 4.5% city: 0.7%
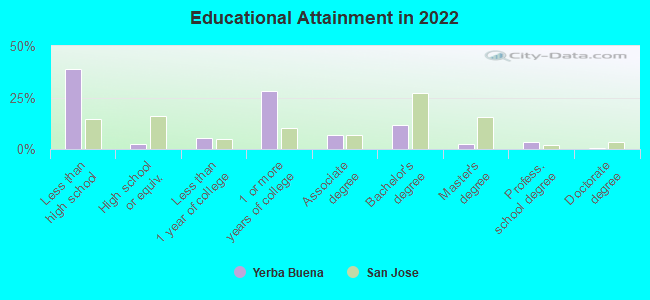
Education in this neighborhood (subdivision or community):
- Percentage of people 3 years and older in K-12 schools:
Yerba Buena: 20.9% San Jose: 16.1%
- Percentage of people 3 years and older in undergraduate colleges:
Yerba Buena: 7.0% San Jose: 6.5%
- Percentage of people 3 years and older in grad. or professional schools:
Yerba Buena: 0.7% San Jose: 2.0%
- Percentage of students K-12 enrolled in private schools:
Yerba Buena: 34.4% San Jose: 14.9%
Percentage of population below poverty level:
| Yerba Buena: | 5.2% |
| San Jose: | 9.0% |
Median year owner moved in (as recorded in 2022):
Median year renter moved in (as recorded in 2022):
| Yerba Buena: | 2006 |
| San Jose: | 2008 |
Median year renter moved in (as recorded in 2022):
| Yerba Buena: | 2014 |
| San Jose: | 2020 |
Percentage of married-couple families with both working:
| Yerba Buena: | 74.6% |
| San Jose: | 72.5% |
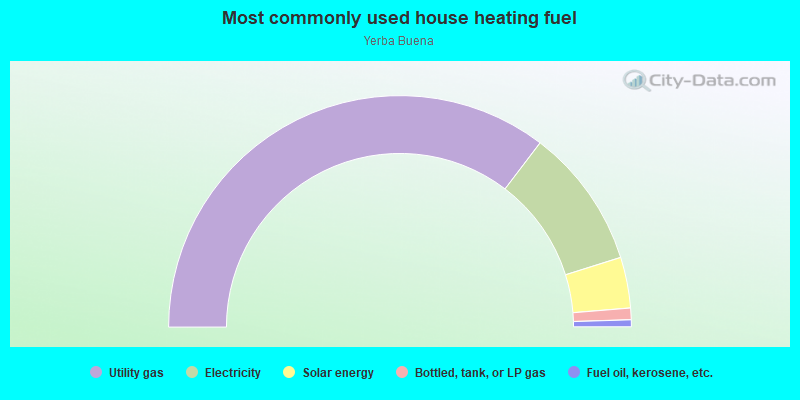
- 70.7%Utility gas
- 19.6%Electricity
- 7.1%Solar energy
- 1.6%Bottled, tank, or LP gas
- 1.0%Fuel oil, kerosene, etc.
Roads and streets:
McLaughlin Ave
Length: 0.35 miles
Direction: SE-NW
Address range: 1774 to 2098
Direction: SE-NW
Address range: 1774 to 2098
Durness Pl
Length: 0.31 miles
Directions: E-W, N-S, SE-NW, SW-NE
Address range: 1000 to 1099
Directions: E-W, N-S, SE-NW, SW-NE
Address range: 1000 to 1099
Glenfinnan Dr
Length: 0.27 miles
Direction: SW-NE
Address range: 900 to 1098
Direction: SW-NE
Address range: 900 to 1098
Holly Hill Dr
Length: 0.14 miles
Directions: E-W, SW-NE
Address range: 1000 to 1149
Directions: E-W, SW-NE
Address range: 1000 to 1149
Chapel Hill Way
Length: 0.14 miles
Direction: SW-NE
Address range: 960 to 1099
Direction: SW-NE
Address range: 960 to 1099
Phelan Ave
Length: 0.12 miles
Directions: N-S, SE-NW, SW-NE
Directions: N-S, SE-NW, SW-NE
Martello Dr
Length: 0.11 miles
Directions: N-S, SE-NW
Address range: 1800 to 1999
Directions: N-S, SE-NW
Address range: 1800 to 1999
Taji Ct
Length: 0.11 miles
Directions: E-W, N-S, SE-NW
Address range: 900 to 999
Directions: E-W, N-S, SE-NW
Address range: 900 to 999
Stone Glen Ct
Length: 0.07 miles
Direction: SW-NE
Address range: 900 to 999
Direction: SW-NE
Address range: 900 to 999
Sogol Ct
Length: 0.05 miles
Direction: SE-NW
Address range: 1894 to 1999
Direction: SE-NW
Address range: 1894 to 1999
Glenfinnan Ct
Length: 0.03 miles
Direction: SE-NW
Direction: SE-NW
Phelan Ct
Length: 0.03 miles
Directions: E-W, SE-NW
Address range: 1800 to 1899
Directions: E-W, SE-NW
Address range: 1800 to 1899
Walker Ct
Length: 0.03 miles
Direction: SE-NW
Direction: SE-NW