Woodland Park neighborhood in Columbus, Ohio (OH), 43203, 43219 detailed profile
Settings
X


Business Search - 14 Million verified businesses
Area: 0.316 square miles
Population: 1,859
Population density:
| Woodland Park: | 5,876 people per square mile |
| Columbus: | 4,320 people per square mile |

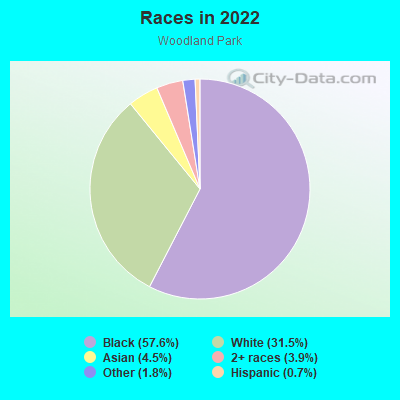
- 1,10257.6%Black
- 60331.5%White
- 864.5%Asian
- 743.9%Two or more races
- 351.8%Some other race
- 130.7%Hispanic or Latino
Distribution of median household income
![Distribution of median household income]()
- 49Less than $10,000
- 203$10,000 to $19,999
- 18$20,000 to $29,999
- 107$30,000 to $39,999
- 104$40,000 to $49,999
- 160$50,000 to $59,999
- 137$60,000 to $74,999
- 142$75,000 to $99,999
- 63$100,000 to $124,999
- 35$125,000 to $149,999
- 60$150,000 to $199,999
- 53$200,000 or more

Distribution of owner-occupied house/condo value
![Distribution of owner-occupied house/condo value]()
- 102Less than $50,000
- 159$50,000 to $99,999
- 37$100,000 to $149,999
- 55$150,000 to $199,999
- 97$200,000 to $249,999
- 192$250,000 to $299,999
- 82$300,000 to $399,999
- 5$400,000 to $499,999
- 25$500,000 to $749,999
- 23$750,000 to $999,999

Distribution of rent paid by renters
![Distribution of rent paid by renters]()
- 8Less than $100
- 17$100 to $199
- 72$200 to $299
- 63$300 to $399
- 50$400 to $499
- 60$500 to $599
- 77$600 to $699
- 159$700 to $799
- 116$800 to $899
- 62$900 to $999
- 12$1,000 to $1,249
- 81$1,250 to $1,499
- 72$1,500 to $1,999
- 6$2,000 or more

Median rent in 2022:
| Woodland Park: | $734 |
| Columbus: | $1,005 |
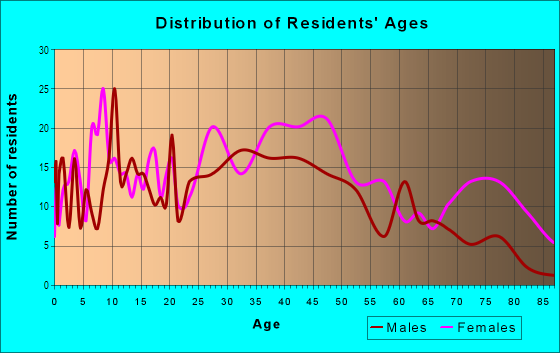
| Males: | 827 |
| Females: | 1,032 |
Males:
| This neighborhood: | 29.5 years |
| Whole city: | 32.9 years |
| This neighborhood: | 26.9 years |
| Whole city: | 33.7 years |
Average household size:
| Woodland Park: | 11.2 people |
| Columbus: | 2.3 people |
Percentage of family households:
| Woodland Park: | 30.1% |
| Columbus: | 40.8% |
| Here: | 23.9% |
| Columbus: | 30.8% |
Percentage of married-couple families with children (among all households):
| Woodland Park: | 4.5% |
| Columbus: | 23.7% |
Percentage of single-mother households (among all households):
| Woodland Park: | 81.0% |
| Columbus: | 15.7% |
Percentage of never married males 15 years old and over:
Percentage of never married females 15 years old and over:
| Woodland Park: | 17.3% |
| Columbus: | 24.6% |
Percentage of never married females 15 years old and over:
| Woodland Park: | 33.2% |
| city: | 21.9% |
Percentage of people that speak English not well or not at all:
| Woodland Park: | 0.0% |
| Columbus: | 3.5% |
Percentage of people born in this state:
Percentage of people born in another U.S. state:
Percentage of native residents but born outside the U.S.:
Percentage of foreign born residents:
| Here: | 67.9% |
| Columbus: | 61.6% |
Percentage of people born in another U.S. state:
| Woodland Park: | 28.5% |
| Columbus: | 22.4% |
Percentage of native residents but born outside the U.S.:
| Here: | 0.5% |
| city: | 1.3% |
Percentage of foreign born residents:
| Here: | 3.5% |
| Columbus: | 14.7% |
Owner-occupied
Renter-occupied

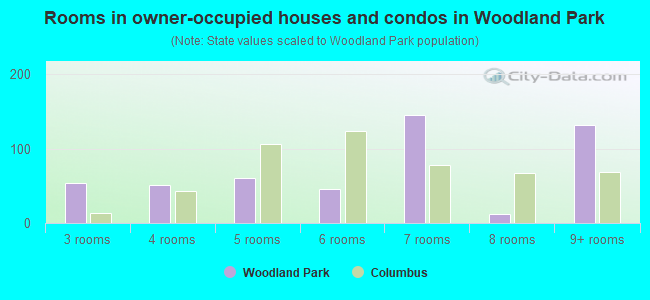
- Rooms in owner-occupied houses and condos in Woodland Park
- 01 room
- 02 rooms
- 543 rooms
- 514 rooms
- 605 rooms
- 466 rooms
- 1457 rooms
- 128 rooms
- 1329+ rooms
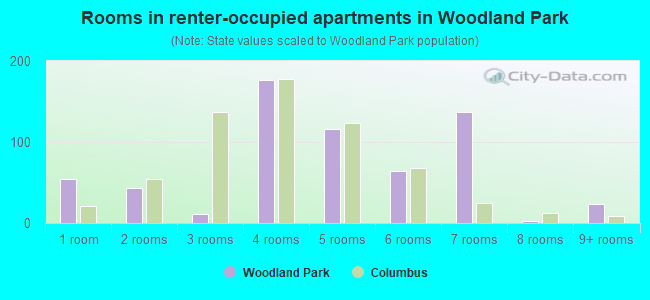
- Rooms in renter-occupied apartments in Woodland Park
- 541 room
- 432 rooms
- 113 rooms
- 1764 rooms
- 1165 rooms
- 646 rooms
- 1377 rooms
- 38 rooms
- 249+ rooms
Owner-occupied
Renter-occupied
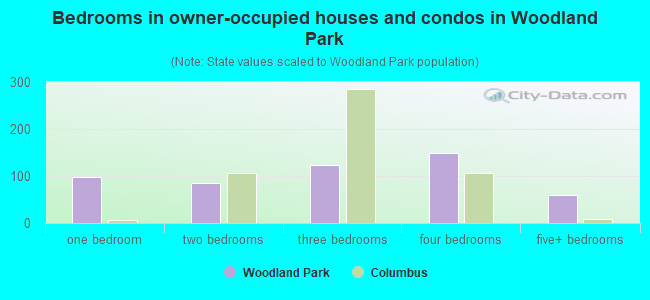
- Bedrooms in owner-occupied houses and condos in Woodland Park
- 0no bedroom
- 971 bedroom
- 852 bedrooms
- 1233 bedrooms
- 1494 bedrooms
- 595+ bedrooms
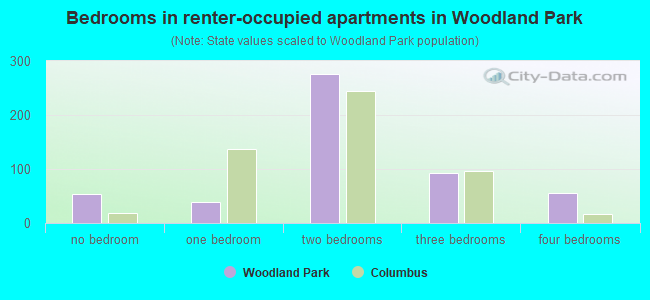
- Bedrooms in renter-occupied apartments in Woodland Park
- 54no bedroom
- 391 bedroom
- 2762 bedrooms
- 923 bedrooms
- 564 bedrooms
- 05+ bedrooms
Average number of cars or other vehicles available in houses/condos:
Average number of cars or other vehicles available in apartments:
| This neighborhood: | 1.7 |
| Columbus: | 1.8 |
Average number of cars or other vehicles available in apartments:
| Here: | 1.2 |
| city: | 1.3 |
Percentage of units with a mortgage:
| Woodland Park: | 52.6% |
| Columbus: | 69.3% |
Average estimated value of detached houses in 2022 (51.2% of all units):
| Woodland Park: | $183,980 |
| Columbus: | $262,671 |
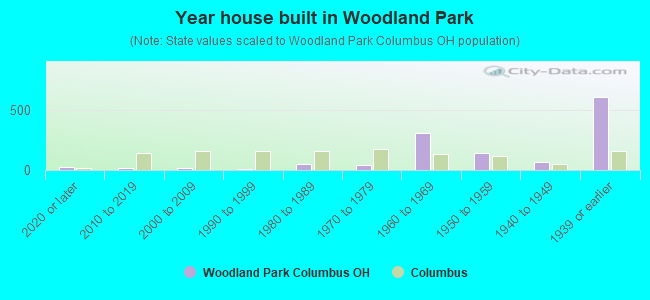
- Year house built in Woodland Park
- 252020 or later
- 162010 to 2019
- 142000 to 2009
- 111990 to 1999
- 461980 to 1989
- 401970 to 1979
- 3091960 to 1969
- 1401950 to 1959
- 651940 to 1949
- 6021939 or earlier
City-data.com crime index for city in 2020 (higher means more crime):
| City: | 376.1 |
| U.S. average: | 219.5 |
Travel time to work (commute)
![Travel time to work (commute)]()
- 10Less than 5 minutes
- 715 to 9 minutes
- 11710 to 14 minutes
- 12815 to 19 minutes
- 11720 to 24 minutes
- 7825 to 29 minutes
- 8330 to 34 minutes
- 1835 to 39 minutes
- 340 to 44 minutes
- 1745 to 59 minutes
- 1760 to 89 minutes

Means of transportation to work
![Means of transportation to work]()
- 59.3%632Drove a car alone
- 10.5%112Carpooled
- 6.4%68Bus
- 5.6%60Taxi
- 2.1%22Walked
- 1.2%13Other means
- 24.6%262Worked at home

Time leaving home to go to work
![Time leaving home to go to work]()
- 712:00 a.m. to 4:59 a.m.
- 145:00 a.m. to 5:29 a.m.
- 355:30 a.m. to 5:59 a.m.
- 176:00 a.m. to 6:29 a.m.
- 286:30 a.m. to 6:59 a.m.
- 977:00 a.m. to 7:29 a.m.
- 817:30 a.m. to 7:59 a.m.
- 698:00 a.m. to 8:29 a.m.
- 648:30 a.m. to 8:59 a.m.
- 709:00 a.m. to 9:59 a.m.
- 2110:00 a.m. to 10:59 a.m.
- 1211:00 a.m. to 11:59 a.m.
- 6612:00 p.m. to 3:59 p.m.
- 764:00 p.m. to 11:59 p.m.

Occupations of males:
- Percentage of males in management occupations (except farmers):
Here: 13.4% city: 10.2%
- Percentage of males in business and financial operations occupations:
Here: 7.8% city: 6.2%
- Percentage of males in life, physical, and social science occupations:
Here: 9.2% city: 1.1%
- Percentage of males in community and social services occupations:
Here: 8.0% city: 1.2%
- Percentage of males in education, training, and library occupations:
Here: 8.5% city: 3.8%
- Percentage of males in arts, design, entertainment, sports, and media occupations:
Here: 2.8% city: 2.1%
- Percentage of males in service occupations:
Here: 18.1% city: 13.8%
- Percentage of males in sales and office occupations:
Here: 7.9% city: 17.0%
- Percentage of males in construction, extraction, and maintenance occupations:
Here: 2.6% city: 5.2%
- Percentage of males in production occupations:
Here: 5.7% city: 6.5%
- Percentage of males in transportation occupations:
Here: 4.6% city: 6.4%
- Percentage of males in material moving occupations:
Here: 11.5% city: 7.9%
Occupations of females:
- Percentage of females in management occupations (except farmers):
Here: 8.6% city: 10.0%
- Percentage of females in business and financial operations occupations:
Here: 3.9% city: 8.2%
- Percentage of females in computer and mathematical occupations:
Here: 1.5% city: 2.6%
- Percentage of females in community and social services occupations:
Here: 10.0% city: 3.0%
- Percentage of females in legal occupations:
Here: 2.5% city: 1.3%
- Percentage of females in education, training, and library occupations:
Here: 5.1% city: 7.9%
- Percentage of females in arts, design, entertainment, sports, and media occupations:
Here: 8.1% city: 2.1%
- Percentage of females in healthcare practitioners and technical occupations:
Here: 3.2% city: 10.2%
- Percentage of females in service occupations:
Here: 14.2% city: 19.3%
- Percentage of females in sales and office occupations:
Here: 35.3% city: 25.0%
- Percentage of females in production occupations:
Here: 1.3% city: 3.0%
- Percentage of females in transportation occupations:
Here: 5.2% city: 1.3%
- Percentage of females in material moving occupations:
Here: 2.4% city: 3.7%
Percentage of people 16-64 in Armed Forces:
| Woodland Park: | 0.3% |
| Columbus: | 0.2% |
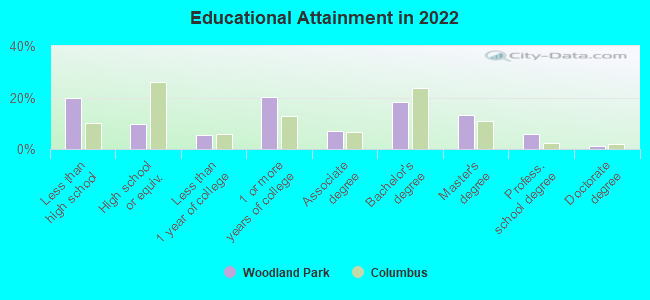
Education in this neighborhood (subdivision or community):
- Percentage of people 3 years and older in K-12 schools:
Woodland Park: 44.6% Columbus: 15.2%
- Percentage of people 3 years and older in undergraduate colleges:
Woodland Park: 3.7% Columbus: 6.7%
- Percentage of people 3 years and older in grad. or professional schools:
Woodland Park: 7.4% Columbus: 2.4%
- Percentage of students K-12 enrolled in private schools:
Woodland Park: 13.6% Columbus: 13.8%
Percentage of population below poverty level:
| Woodland Park: | 26.8% |
| Columbus: | 18.1% |
Median year owner moved in (as recorded in 2022):
Median year renter moved in (as recorded in 2022):
| Woodland Park: | 2009 |
| Columbus: | 2012 |
Median year renter moved in (as recorded in 2022):
| Woodland Park: | 2017 |
| Columbus: | 2020 |
Percentage of married-couple families with both working:
| Woodland Park: | 99.9% |
| Columbus: | 75.5% |
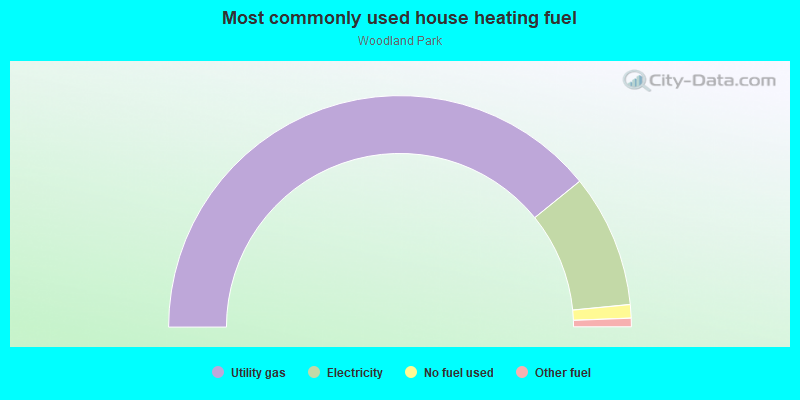
- 78.4%Utility gas
- 18.6%Electricity
- 1.9%No fuel used
- 1.2%Other fuel
Roads and streets:
Woodland Ave
Length: 0.69 miles
Direction: N-S
Address range: 4 to 503
Direction: N-S
Address range: 4 to 503
Parkwood Ave
Length: 0.61 miles
Direction: N-S
Address range: 26 to 492
Direction: N-S
Address range: 26 to 492
E Long St
Length: 0.54 miles
Direction: E-W
Address range: 1543 to 1843
Direction: E-W
Address range: 1543 to 1843
Clifton Ave
Length: 0.46 miles
Direction: E-W
Address range: 1581 to 1839
Direction: E-W
Address range: 1581 to 1839
Eastwood Ave
Length: 0.42 miles
Directions: E-W, N-S
Address range: 35 to 1799
Directions: E-W, N-S
Address range: 35 to 1799
Greenway Ave
Length: 0.31 miles
Direction: E-W
Address range: 1610 to 1772
Direction: E-W
Address range: 1610 to 1772
Harvard Ave
Length: 0.26 miles
Direction: E-W
Address range: 1592 to 1729
Direction: E-W
Address range: 1592 to 1729
Emerald Ave
Length: 0.21 miles
Direction: E-W
Address range: 1600 to 1747
Direction: E-W
Address range: 1600 to 1747
Centab Dr
Length: 0.20 miles
Directions: E-W, N-S, SE-NW
Address range: 311 to 402
Directions: E-W, N-S, SE-NW
Address range: 311 to 402
Richmond Ave
Length: 0.20 miles
Direction: E-W
Address range: 1600 to 1784
Direction: E-W
Address range: 1600 to 1784
Eldridge Ave
Length: 0.17 miles
Direction: N-S
Address range: 330 to 450
Direction: N-S
Address range: 330 to 450
Maryland Ave
Length: 0.17 miles
Direction: E-W
Address range: 1738 to 1830
Direction: E-W
Address range: 1738 to 1830
Hawthorne Park
Length: 0.17 miles
Direction: E-W
Address range: 1566 to 1650
Direction: E-W
Address range: 1566 to 1650
Brunson Ave
Length: 0.15 miles
Direction: N-S
Address range: 49 to 156
Direction: N-S
Address range: 49 to 156
Granville St
Length: 0.14 miles
Direction: E-W
Address range: 1610 to 1684
Direction: E-W
Address range: 1610 to 1684
Pembroke Ave
Length: 0.12 miles
Direction: E-W
Address range: 1589 to 1662
Direction: E-W
Address range: 1589 to 1662
Maplewood Aly
Length: 0.08 miles
Direction: E-W
Address range: 1545 to 1606
Direction: E-W
Address range: 1545 to 1606
Vogel Ave
Length: 0.07 miles
Direction: E-W
Address range: 1616 to 1663
Direction: E-W
Address range: 1616 to 1663
Callender Ave
Length: 0.07 miles
Direction: N-S
Address range: 15 to 69
Direction: N-S
Address range: 15 to 69
Clifton Ct
Length: 0.07 miles
Direction: N-S
Address range: 169 to 206
Direction: N-S
Address range: 169 to 206
Hall Ave
Length: 0.05 miles
Direction: N-S
Address range: 23 to 56
Direction: N-S
Address range: 23 to 56
Railroad features:
Norfolk and Western Rlwy
Length: 0.66 miles
Directions: N-S, SE-NW, SW-NE
Directions: N-S, SE-NW, SW-NE