Wilson neighborhood in Oxnard, California (CA), 93030 detailed profile
Settings
X

Business Search - 14 Million verified businesses
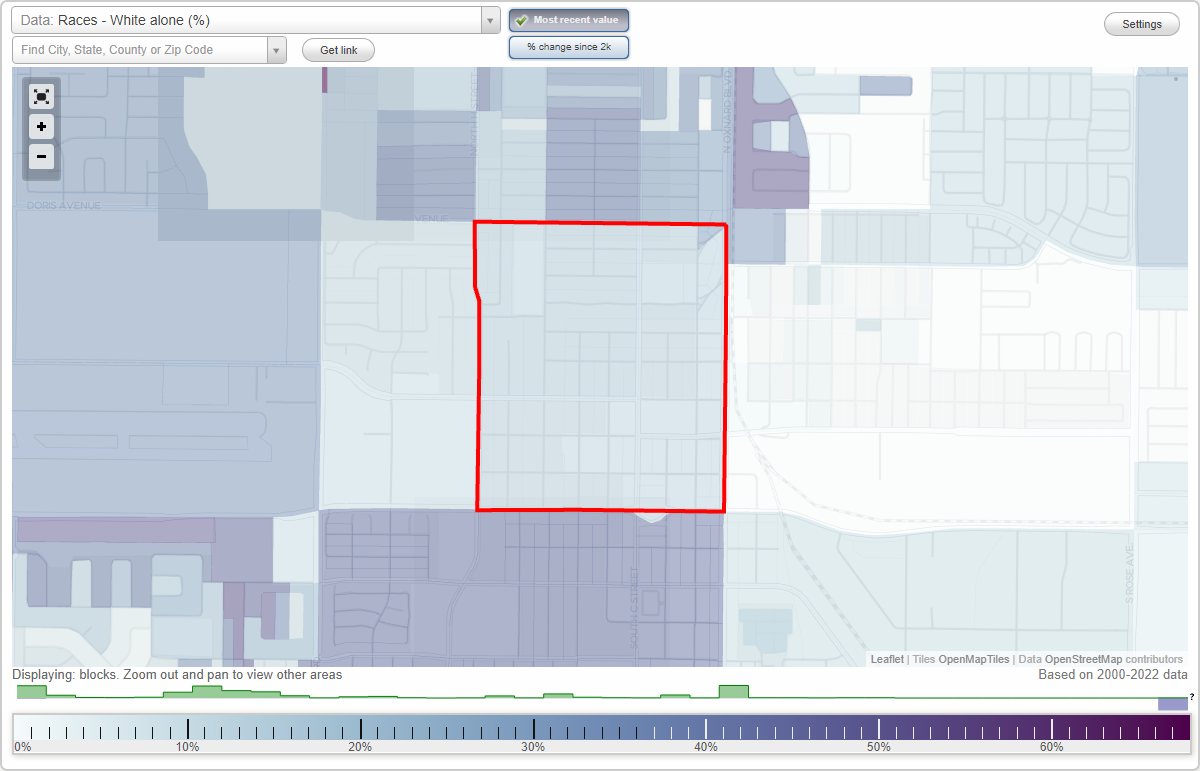
Area: 0.428 square miles
Population: 5,338
Population density:
| Wilson: | 12,480 people per square mile |
| Oxnard: | 7,918 people per square mile |

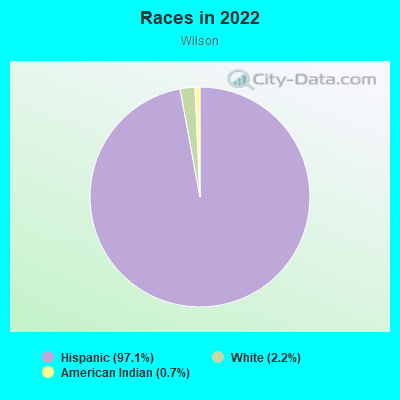
- 5,18297.1%Hispanic or Latino
- 1162.2%White
- 400.7%American Indian
Median household income in 2022:
| Wilson: | $49,413 |
| Oxnard: | $84,941 |
Distribution of median household income
![Distribution of median household income]()
- 121Less than $10,000
- 81$10,000 to $19,999
- 137$20,000 to $29,999
- 101$30,000 to $39,999
- 217$40,000 to $49,999
- 121$50,000 to $59,999
- 81$60,000 to $74,999
- 125$75,000 to $99,999
- 128$100,000 to $124,999
- 73$125,000 to $149,999
- 85$150,000 to $199,999
- 73$200,000 or more

Distribution of owner-occupied house/condo value
![Distribution of owner-occupied house/condo value]()
- 45$300,000 to $399,999
- 21$400,000 to $499,999
- 49$500,000 to $749,999

Distribution of rent paid by renters
![Distribution of rent paid by renters]()
- 61$300 to $399
- 45$800 to $899
- 9$900 to $999
- 217$1,000 to $1,249
- 265$1,250 to $1,499
- 213$1,500 to $1,999
- 227$2,000 or more

Median rent in 2022:
| Wilson: | $1,396 |
| Oxnard: | $1,876 |
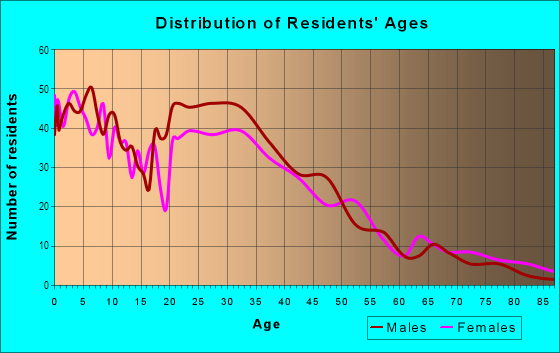
| Males: | 3,152 |
| Females: | 2,186 |
Males:
| This neighborhood: | 25.1 years |
| Whole city: | 35.1 years |
| This neighborhood: | 26.0 years |
| Whole city: | 34.3 years |
Average household size:
| Wilson: | 4.3 people |
| Oxnard: | 3.6 people |
Percentage of family households:
| Wilson: | 58.4% |
| Oxnard: | 51.5% |
| Here: | 41.2% |
| Oxnard: | 47.9% |
Percentage of married-couple families with children (among all households):
| Wilson: | 11.3% |
| Oxnard: | 16.4% |
Percentage of single-mother households (among all households):
| Wilson: | 9.7% |
| Oxnard: | 8.1% |
Percentage of never married males 15 years old and over:
Percentage of never married females 15 years old and over:
| Wilson: | 37.1% |
| Oxnard: | 22.9% |
Percentage of never married females 15 years old and over:
| Wilson: | 21.4% |
| city: | 20.1% |
Percentage of people that speak English not well or not at all:
| Wilson: | 0.0% |
| Oxnard: | 20.2% |
Percentage of people born in this state:
Percentage of people born in another U.S. state:
Percentage of native residents but born outside the U.S.:
Percentage of foreign born residents:
| Here: | 46.4% |
| Oxnard: | 58.8% |
Percentage of people born in another U.S. state:
| Wilson: | 1.2% |
| Oxnard: | 6.5% |
Percentage of native residents but born outside the U.S.:
| Here: | 0.7% |
| city: | 1.4% |
Percentage of foreign born residents:
| Here: | 51.7% |
| Oxnard: | 33.3% |
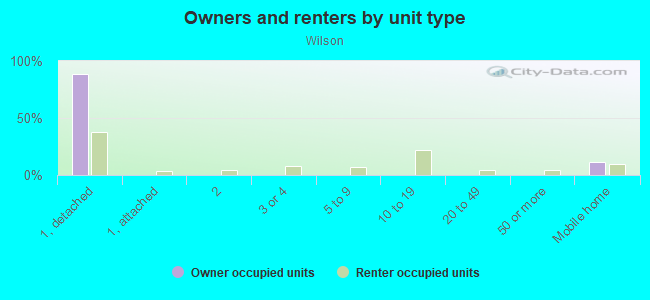
Owner-occupied
Renter-occupied

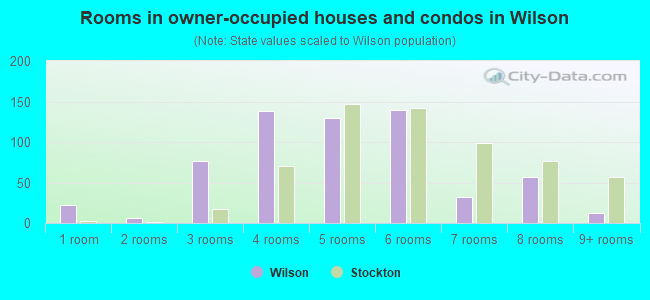
- Rooms in owner-occupied houses and condos in Wilson
- 01 room
- 02 rooms
- 243 rooms
- 204 rooms
- 485 rooms
- 206 rooms
- 47 rooms
- 408 rooms
- 09+ rooms
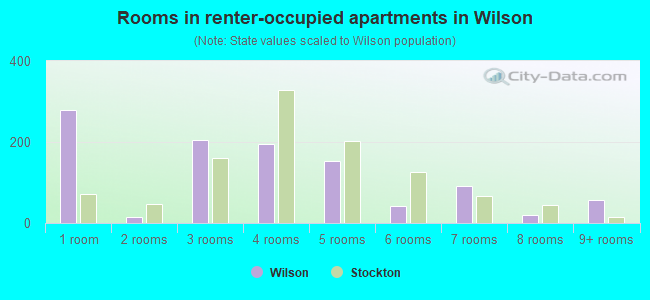
- Rooms in renter-occupied apartments in Wilson
- 01 room
- 02 rooms
- 2243 rooms
- 6014 rooms
- 1845 rooms
- 246 rooms
- 467 rooms
- 208 rooms
- 159+ rooms
Owner-occupied
Renter-occupied
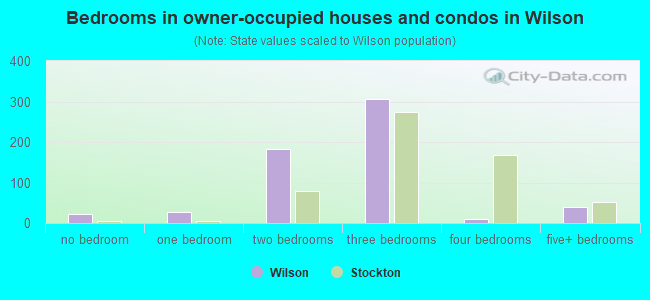
- Bedrooms in owner-occupied houses and condos in Wilson
- 0no bedroom
- 241 bedroom
- 202 bedrooms
- 483 bedrooms
- 204 bedrooms
- 405+ bedrooms
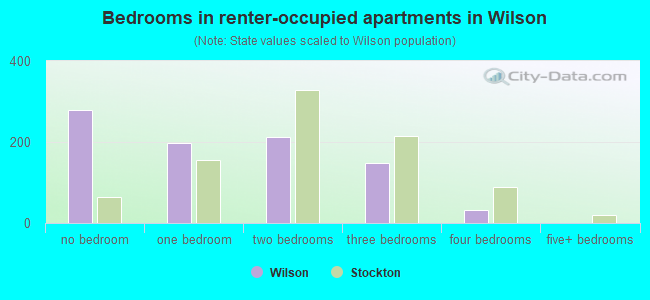
- Bedrooms in renter-occupied apartments in Wilson
- 0no bedroom
- 3041 bedroom
- 5212 bedrooms
- 843 bedrooms
- 1244 bedrooms
- 205+ bedrooms
Average number of cars or other vehicles available in houses/condos:
Average number of cars or other vehicles available in apartments:
| This neighborhood: | 1.9 |
| Oxnard: | 2.5 |
Average number of cars or other vehicles available in apartments:
| Here: | 1.7 |
| city: | 1.9 |
Percentage of units with a mortgage:
| Wilson: | 21.4% |
| Oxnard: | 65.5% |
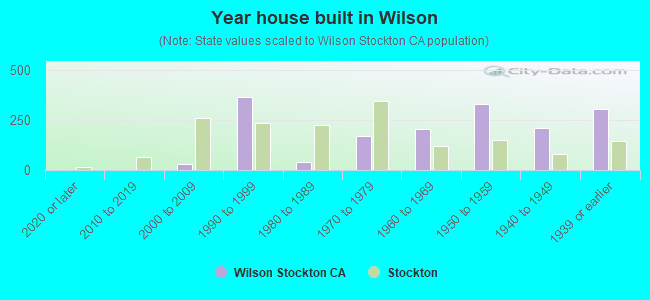
- Year house built in Wilson
- 02020 or later
- 202010 to 2019
- 1402000 to 2009
- 161990 to 1999
- 241980 to 1989
- 2781970 to 1979
- 2281960 to 1969
- 1441950 to 1959
- 5331940 to 1949
- 3281939 or earlier
City-data.com crime index for city in 2020 (higher means more crime):
| City: | 220.0 |
| U.S. average: | 219.5 |
Travel time to work (commute)
![Travel time to work (commute)]()
- 1155 to 9 minutes
- 26910 to 14 minutes
- 15115 to 19 minutes
- 10220 to 24 minutes
- 2,65725 to 29 minutes
- 25830 to 34 minutes
- 39040 to 44 minutes
- 8645 to 59 minutes
- 7560 to 89 minutes
- 2690 or more minutes

Means of transportation to work
![Means of transportation to work]()
- 46.7%1,199Drove a car alone
- 37.9%974Carpooled
- 6.1%156Walked
- 1.7%44Other means
- 7.5%192Worked at home

Time leaving home to go to work
![Time leaving home to go to work]()
- 14412:00 a.m. to 4:59 a.m.
- 5925:00 a.m. to 5:29 a.m.
- 1,1035:30 a.m. to 5:59 a.m.
- 1,1526:00 a.m. to 6:29 a.m.
- 3076:30 a.m. to 6:59 a.m.
- 2057:00 a.m. to 7:29 a.m.
- 827:30 a.m. to 7:59 a.m.
- 428:00 a.m. to 8:29 a.m.
- 408:30 a.m. to 8:59 a.m.
- 499:00 a.m. to 9:59 a.m.
- 1710:00 a.m. to 10:59 a.m.
- 2011:00 a.m. to 11:59 a.m.
- 24212:00 p.m. to 3:59 p.m.
- 1334:00 p.m. to 11:59 p.m.

Occupations of males:
- Percentage of males in management occupations (except farmers):
Here: 2.9% city: 6.2%
- Percentage of males in business and financial operations occupations:
Here: 3.2% city: 2.6%
- Percentage of males in computer and mathematical occupations:
Here: 2.2% city: 2.4%
- Percentage of males in arts, design, entertainment, sports, and media occupations:
Here: 1.9% city: 1.1%
- Percentage of males in service occupations:
Here: 26.5% city: 16.9%
- Percentage of males in sales and office occupations:
Here: 9.2% city: 11.7%
- Percentage of males in farming, fishing, and forestry occupations:
Here: 40.1% city: 14.1%
- Percentage of males in construction, extraction, and maintenance occupations:
Here: 4.1% city: 9.8%
- Percentage of males in production occupations:
Here: 3.4% city: 9.6%
- Percentage of males in transportation occupations:
Here: 2.4% city: 6.5%
- Percentage of males in material moving occupations:
Here: 5.8% city: 6.3%
Occupations of females:
- Percentage of females in management occupations (except farmers):
Here: 2.0% city: 6.3%
- Percentage of females in business and financial operations occupations:
Here: 7.3% city: 5.3%
- Percentage of females in life, physical, and social science occupations:
Here: 3.2% city: 0.7%
- Percentage of females in legal occupations:
Here: 3.7% city: 0.5%
- Percentage of females in education, training, and library occupations:
Here: 5.0% city: 4.9%
- Percentage of females in service occupations:
Here: 11.8% city: 23.6%
- Percentage of females in sales and office occupations:
Here: 12.2% city: 27.3%
- Percentage of females in farming, fishing, and forestry occupations:
Here: 45.1% city: 8.0%
- Percentage of females in production occupations:
Here: 12.2% city: 6.8%
- Percentage of females in material moving occupations:
Here: 5.7% city: 3.7%
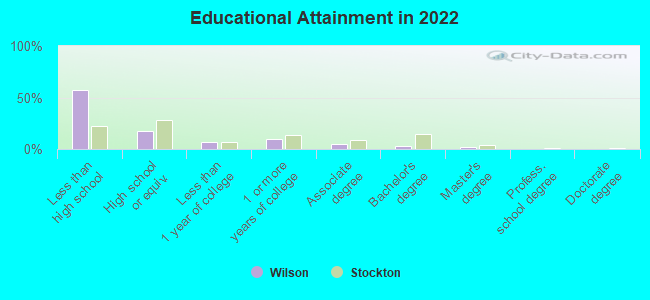
Education in this neighborhood (subdivision or community):
- Percentage of people 3 years and older in K-12 schools:
Wilson: 25.9% Oxnard: 21.0%
- Percentage of people 3 years and older in undergraduate colleges:
Wilson: 5.2% Oxnard: 5.2%
- Percentage of people 3 years and older in grad. or professional schools:
Wilson: 0.0% Oxnard: 0.8%
- Percentage of students K-12 enrolled in private schools:
Wilson: 1.7% Oxnard: 4.0%
Percentage of population below poverty level:
| Wilson: | 18.3% |
| Oxnard: | 12.8% |
Median year owner moved in (as recorded in 2022):
Median year renter moved in (as recorded in 2022):
| Wilson: | 1990 |
| Oxnard: | 2006 |
Median year renter moved in (as recorded in 2022):
| Wilson: | 2006 |
| Oxnard: | 2019 |
Percentage of married-couple families with both working:
| Wilson: | 100.0% |
| Oxnard: | 71.8% |
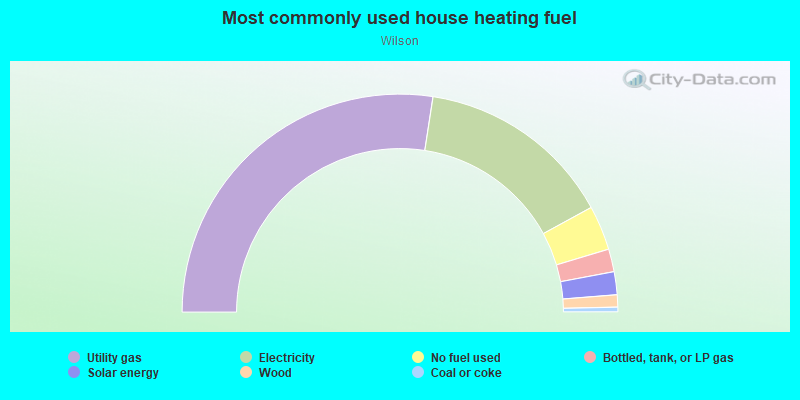
- 54.9%Utility gas
- 36.1%No fuel used
- 9.0%Electricity
Highways in this neighborhood:
Pacific Coast Hwy (State Rte 1, S Oxnard Blvd)
Length: 0.36 miles
Direction: N-S
Address range: 100 to 499
Direction: N-S
Address range: 100 to 499
State Rte 1 (Pacific Coast Hwy, N Oxnard Blvd)
Length: 0.24 miles
Direction: N-S
Address range: 100 to 449
Direction: N-S
Address range: 100 to 449
Roads and streets:
Magnolia Ave
Length: 0.68 miles
Direction: E-W
Address range: 100 to 831
Direction: E-W
Address range: 100 to 831
W 4th St
Length: 0.68 miles
Direction: E-W
Address range: 100 to 849
Direction: E-W
Address range: 100 to 849
W 2nd St
Length: 0.64 miles
Direction: E-W
Address range: 100 to 848
Direction: E-W
Address range: 100 to 848
W 3rd St
Length: 0.64 miles
Direction: E-W
Address range: 200 to 849
Direction: E-W
Address range: 200 to 849
Palm Dr
Length: 0.56 miles
Directions: E-W, SW-NE
Address range: 100 to 699
Directions: E-W, SW-NE
Address range: 100 to 699
Deodar Ave
Length: 0.53 miles
Directions: E-W, SW-NE
Address range: 100 to 699
Directions: E-W, SW-NE
Address range: 100 to 699
W 1st St
Length: 0.45 miles
Direction: E-W
Address range: 100 to 699
Direction: E-W
Address range: 100 to 699
S F St
Length: 0.36 miles
Direction: N-S
Address range: 100 to 499
Direction: N-S
Address range: 100 to 499
S A St
Length: 0.36 miles
Direction: N-S
Address range: 100 to 499
Direction: N-S
Address range: 100 to 499
S D St
Length: 0.36 miles
Direction: N-S
Address range: 100 to 499
Direction: N-S
Address range: 100 to 499
S E St
Length: 0.36 miles
Direction: N-S
Address range: 100 to 499
Direction: N-S
Address range: 100 to 499
S G St
Length: 0.36 miles
Direction: N-S
Address range: 100 to 499
Direction: N-S
Address range: 100 to 499
S C St
Length: 0.33 miles
Direction: N-S
Address range: 100 to 498
Direction: N-S
Address range: 100 to 498
N A St
Length: 0.32 miles
Direction: N-S
Address range: 100 to 485
Direction: N-S
Address range: 100 to 485
N C St
Length: 0.31 miles
Direction: N-S
Address range: 100 to 549
Direction: N-S
Address range: 100 to 549
N F St
Length: 0.31 miles
Direction: N-S
Address range: 100 to 548
Direction: N-S
Address range: 100 to 548
W Beverly Dr
Length: 0.28 miles
Direction: E-W
Address range: 400 to 699
Direction: E-W
Address range: 400 to 699
S B St
Length: 0.24 miles
Direction: N-S
Address range: 100 to 465
Direction: N-S
Address range: 100 to 465
W 5th St
Length: 0.15 miles
Direction: E-W
Address range: 701 to 860
Direction: E-W
Address range: 701 to 860
Carty Dr
Length: 0.10 miles
Direction: N-S
Address range: 300 to 549
Direction: N-S
Address range: 300 to 549
N 5th St
Length: 0.09 miles
Direction: E-W
Address range: 300 to 399
Direction: E-W
Address range: 300 to 399
N G St
Length: 0.07 miles
Direction: N-S
Address range: 100 to 341
Direction: N-S
Address range: 100 to 341
N E St
Length: 0.07 miles
Direction: N-S
Address range: 100 to 199
Direction: N-S
Address range: 100 to 199
N D St
Length: 0.07 miles
Direction: N-S
Address range: 100 to 199
Direction: N-S
Address range: 100 to 199
N B St
Length: 0.07 miles
Direction: N-S
Address range: 100 to 199
Direction: N-S
Address range: 100 to 199