Whittemore Estates (Whittemore Estate) neighborhood in Derry, New Hampshire (NH), 03038 detailed profile
Settings
X


Business Search - 14 Million verified businesses
Area: 0.107 square miles
Population: 242
Population density:
| Whittemore Estates (Whittemore Estate): | 2,257 people per square mile |
| Derry: | 1,493 people per square mile |

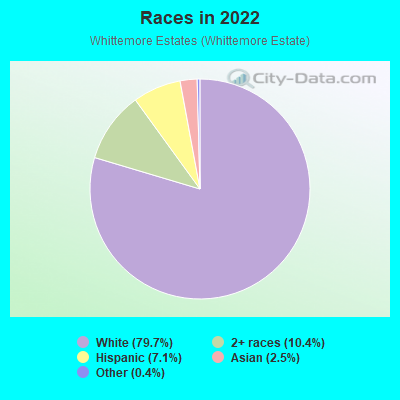
- 19279.7%White
- 2510.4%Two or more races
- 177.1%Hispanic or Latino
- 62.5%Asian
- 10.4%Some other race
Median household income in 2022:
| Whittemore Estates (Whittemore Estate): | $81,929 |
| Derry: | $83,750 |
Distribution of median household income
![Distribution of median household income]()
- 9Less than $10,000
- 6$10,000 to $19,999
- 5$20,000 to $29,999
- 4$30,000 to $39,999
- 8$40,000 to $49,999
- 3$50,000 to $59,999
- 9$60,000 to $74,999
- 23$75,000 to $99,999
- 13$100,000 to $124,999
- 9$125,000 to $149,999
- 18$150,000 to $199,999
- 2$200,000 or more

Distribution of owner-occupied house/condo value
![Distribution of owner-occupied house/condo value]()
- 3Less than $50,000
- 5$50,000 to $99,999
- 8$100,000 to $149,999
- 17$150,000 to $199,999
- 9$200,000 to $249,999
- 7$250,000 to $299,999
- 33$300,000 to $399,999
- 1$400,000 to $499,999
- 4$500,000 to $749,999
- 4$1,000,000 or more

Distribution of rent paid by renters
![Distribution of rent paid by renters]()
- 2$100 to $199
- 2$200 to $299
- 5$500 to $599
- 8$700 to $799
- 1$800 to $899
- 2$900 to $999
- 4$1,000 to $1,249
- 2$1,250 to $1,499
- 18$1,500 to $1,999
- 4$2,000 or more

| Males: | 102 |
| Females: | 139 |
Males:
| This neighborhood: | 37.7 years |
| Whole city: | 37.9 years |
| This neighborhood: | 43.5 years |
| Whole city: | 39.5 years |
Average household size:
| Whittemore Estates (Whittemore Estate): | 2.5 people |
| Derry: | 2.5 people |
Percentage of family households:
| Whittemore Estates (Whittemore Estate): | 60.2% |
| Derry: | 51.8% |
| Here: | 54.8% |
| Derry: | 46.1% |
Percentage of married-couple families with children (among all households):
| Whittemore Estates (Whittemore Estate): | 37.9% |
| Derry: | 23.3% |
Percentage of single-mother households (among all households):
| Whittemore Estates (Whittemore Estate): | 2.9% |
| Derry: | 11.9% |
Percentage of never married males 15 years old and over:
Percentage of never married females 15 years old and over:
| Whittemore Estates (Whittemore Estate): | 15.8% |
| Derry: | 16.3% |
Percentage of never married females 15 years old and over:
| Whittemore Estates (Whittemore Estate): | 14.9% |
| place: | 17.5% |
Percentage of people that speak English not well or not at all:
| Whittemore Estates (Whittemore Estate): | 0.0% |
| Derry: | 0.2% |
Percentage of people born in this state:
Percentage of people born in another U.S. state:
Percentage of native residents but born outside the U.S.:
Percentage of foreign born residents:
| Here: | 26.6% |
| Derry: | 27.6% |
Percentage of people born in another U.S. state:
| Whittemore Estates (Whittemore Estate): | 67.3% |
| Derry: | 66.0% |
Percentage of native residents but born outside the U.S.:
| Here: | 0.3% |
| place: | 1.4% |
Percentage of foreign born residents:
| Here: | 5.7% |
| Derry: | 5.0% |
Owner-occupied
Renter-occupied

- Rooms in owner-occupied houses and condos in Whittemore Estates <
> - 01 room
- 02 rooms
- 23 rooms
- 244 rooms
- 155 rooms
- 206 rooms
- 127 rooms
- 28 rooms
- 19+ rooms
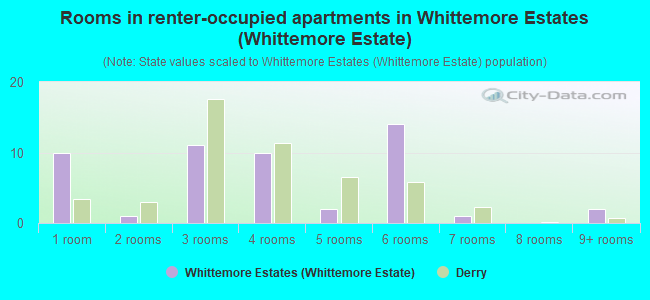
- Rooms in renter-occupied apartments in Whittemore Estates <
> - 101 room
- 12 rooms
- 113 rooms
- 104 rooms
- 25 rooms
- 146 rooms
- 17 rooms
- 08 rooms
- 29+ rooms
Owner-occupied
Renter-occupied
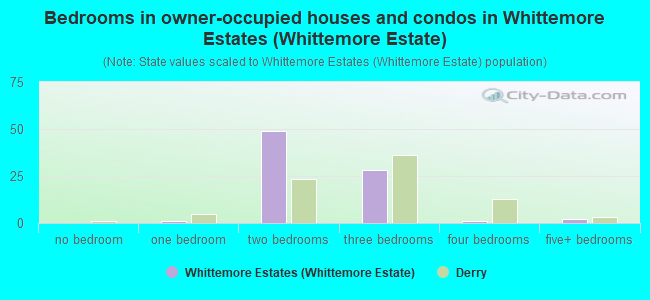
- Bedrooms in owner-occupied houses and condos in Whittemore Estates <
> - 0no bedroom
- 11 bedroom
- 492 bedrooms
- 283 bedrooms
- 14 bedrooms
- 25+ bedrooms
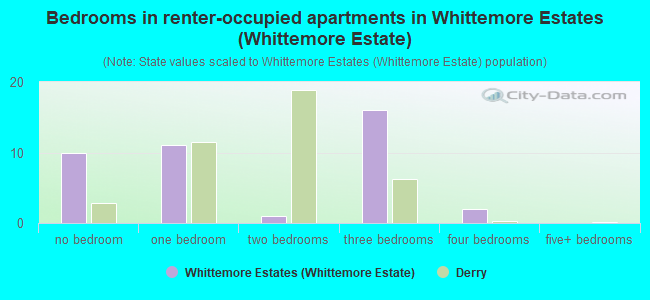
- Bedrooms in renter-occupied apartments in Whittemore Estates <
> - 10no bedroom
- 111 bedroom
- 12 bedrooms
- 163 bedrooms
- 24 bedrooms
- 05+ bedrooms
Average number of cars or other vehicles available in houses/condos:
Average number of cars or other vehicles available in apartments:
| This neighborhood: | 2.1 |
| Derry: | 2.2 |
Average number of cars or other vehicles available in apartments:
| Here: | 1.7 |
| place: | 1.3 |
Percentage of units with a mortgage:
| Whittemore Estates (Whittemore Estate): | 78.9% |
| Derry: | 71.6% |
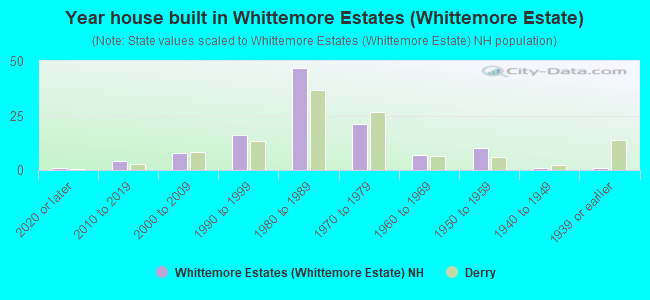
- Year house built in Whittemore Estates <
> - 12020 or later
- 42010 to 2019
- 82000 to 2009
- 161990 to 1999
- 471980 to 1989
- 211970 to 1979
- 71960 to 1969
- 101950 to 1959
- 11940 to 1949
- 11939 or earlier
City-data.com crime index for place in 2020 (higher means more crime):
| City: | 91.5 |
| U.S. average: | 219.5 |
Travel time to work (commute)
![Travel time to work (commute)]()
- 7Less than 5 minutes
- 105 to 9 minutes
- 1710 to 14 minutes
- 1815 to 19 minutes
- 1920 to 24 minutes
- 925 to 29 minutes
- 1130 to 34 minutes
- 235 to 39 minutes
- 340 to 44 minutes
- 1245 to 59 minutes
- 960 to 89 minutes
- 790 or more minutes

Means of transportation to work
![Means of transportation to work]()
- 55.8%76Drove a car alone
- 27.1%37Carpooled
- 2.2%3Bus
- 1.5%2Motorcycle
- 2.9%4Walked
- 5.1%7Other means
- 7.3%10Worked at home

Time leaving home to go to work
![Time leaving home to go to work]()
- 912:00 a.m. to 4:59 a.m.
- 15:00 a.m. to 5:29 a.m.
- 135:30 a.m. to 5:59 a.m.
- 216:00 a.m. to 6:29 a.m.
- 136:30 a.m. to 6:59 a.m.
- 167:00 a.m. to 7:29 a.m.
- 147:30 a.m. to 7:59 a.m.
- 48:00 a.m. to 8:29 a.m.
- 78:30 a.m. to 8:59 a.m.
- 99:00 a.m. to 9:59 a.m.
- 410:00 a.m. to 10:59 a.m.
- 111:00 a.m. to 11:59 a.m.
- 1012:00 p.m. to 3:59 p.m.
- 64:00 p.m. to 11:59 p.m.

Occupations of males:
- Percentage of males in management occupations (except farmers):
Here: 6.3% place: 14.1%
- Percentage of males in business and financial operations occupations:
Here: 3.3% place: 4.2%
- Percentage of males in architecture and engineering occupations:
Here: 1.7% place: 7.9%
- Percentage of males in life, physical, and social science occupations:
Here: 11.9% place: 1.7%
- Percentage of males in education, training, and library occupations:
Here: 3.9% place: 1.7%
- Percentage of males in healthcare practitioners and technical occupations:
Here: 2.1% place: 1.3%
- Percentage of males in service occupations:
Here: 2.3% place: 11.4%
- Percentage of males in sales and office occupations:
Here: 15.3% place: 13.7%
- Percentage of males in construction, extraction, and maintenance occupations:
Here: 10.4% place: 7.8%
- Percentage of males in production occupations:
Here: 17.0% place: 11.4%
- Percentage of males in transportation occupations:
Here: 5.4% place: 5.1%
- Percentage of males in material moving occupations:
Here: 19.7% place: 4.4%
Occupations of females:
- Percentage of females in management occupations (except farmers):
Here: 6.3% place: 10.6%
- Percentage of females in computer and mathematical occupations:
Here: 2.3% place: 0.6%
- Percentage of females in architecture and engineering occupations:
Here: 1.2% place: 1.6%
- Percentage of females in life, physical, and social science occupations:
Here: 1.3% place: 0.8%
- Percentage of females in community and social services occupations:
Here: 1.6% place: 1.6%
- Percentage of females in education, training, and library occupations:
Here: 10.2% place: 8.6%
- Percentage of females in healthcare practitioners and technical occupations:
Here: 6.7% place: 9.5%
- Percentage of females in service occupations:
Here: 19.3% place: 19.9%
- Percentage of females in sales and office occupations:
Here: 39.7% place: 27.0%
- Percentage of females in farming, fishing, and forestry occupations:
Here: 1.1% place: 0.4%
- Percentage of females in construction, extraction, and maintenance occupations:
Here: 3.8% place: 2.7%
- Percentage of females in production occupations:
Here: 8.6% place: 4.0%
- Percentage of females in transportation occupations:
Here: 1.9% place: 2.8%
- Percentage of females in material moving occupations:
Here: 3.9% place: 1.8%
Education in this neighborhood (subdivision or community):
- Percentage of people 3 years and older in K-12 schools:
Whittemore Estates (Whittemore Estate): 12.6% Derry: 15.8%
- Percentage of people 3 years and older in undergraduate colleges:
Whittemore Estates (Whittemore Estate): 6.7% Derry: 5.1%
- Percentage of people 3 years and older in grad. or professional schools:
Whittemore Estates (Whittemore Estate): 0.8% Derry: 2.0%
- Percentage of students K-12 enrolled in private schools:
Whittemore Estates (Whittemore Estate): 43.3% Derry: 13.0%
Percentage of population below poverty level:
| Whittemore Estates (Whittemore Estate): | 8.5% |
| Derry: | 9.9% |
Median year owner moved in (as recorded in 2022):
Median year renter moved in (as recorded in 2022):
| Whittemore Estates (Whittemore Estate): | 2008 |
| Derry: | 2008 |
Median year renter moved in (as recorded in 2022):
| Whittemore Estates (Whittemore Estate): | 2013 |
| Derry: | 2016 |
Percentage of married-couple families with both working:
| Whittemore Estates (Whittemore Estate): | 125.0% |
| Derry: | 68.6% |
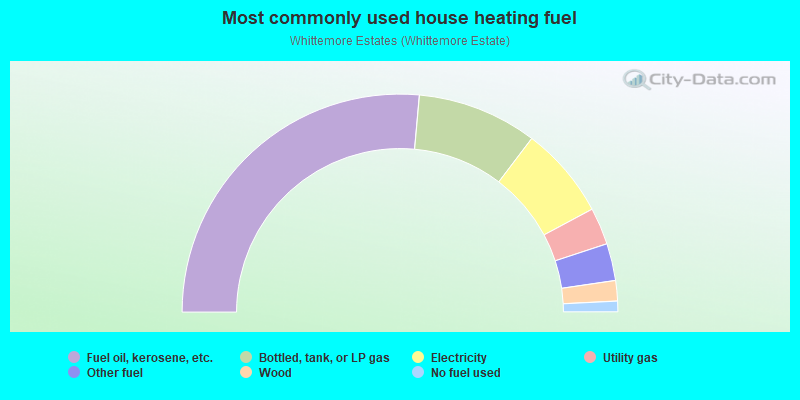
- 52.8%Fuel oil, kerosene, etc.
- 17.8%Bottled, tank, or LP gas
- 13.7%Electricity
- 5.5%Utility gas
- 5.5%Other fuel
- 3.0%Wood
- 1.6%No fuel used
Roads and streets:
Tiger Tail Cir
Length: 0.56 miles
Directions: E-W, N-S, SE-NW, SW-NE
Address range: 1 to 99
Directions: E-W, N-S, SE-NW, SW-NE
Address range: 1 to 99
Brian Ave
Length: 0.38 miles
Directions: E-W, SE-NW, SW-NE
Address range: 2 to 26
Directions: E-W, SE-NW, SW-NE
Address range: 2 to 26
Norman Dr
Length: 0.32 miles
Directions: N-S, SE-NW, SW-NE
Address range: 3 to 99
Directions: N-S, SE-NW, SW-NE
Address range: 3 to 99
Pelican Cir
Length: 0.29 miles
Directions: E-W, N-S, SE-NW, SW-NE
Address range: 2 to 99
Directions: E-W, N-S, SE-NW, SW-NE
Address range: 2 to 99
Phillip Rd
Length: 0.21 miles
Direction: SE-NW
Address range: 11 to 99
Direction: SE-NW
Address range: 11 to 99
Whittemore Dr
Length: 0.13 miles
Directions: E-W, SW-NE
Address range: 1 to 99
Directions: E-W, SW-NE
Address range: 1 to 99